1
Frontiers in Heat and Mass Transfer
Available at www.ThermalFluidsCentral.org
A DRYING AND THERMOELASTIC MODEL FOR FAST
MICROWAVE HEATING OF CONCRETE
Benjamin Lepersa,∗, Aditya Putrantob,c, Martin Ummingerd, Guido Linka, John Jelonneka
a
Karlsruhe Institute of Technology, Institute for Pulsed Power and Microwave Technology, Eggenstein Leopoldshafen, 76344, Germany
b
Monash University, Dept. of Chemical Engineering, Clayton Campus, Melbourne, Victoria 3800, Australia
cParahyangan Catholic University, Dept. of Chemical Engineering, Jolan Ciumbuleuit 94, Bandung, Indonesia d
Karlsruhe Institute of Technology, Institute of Concrete Structures and Building Materials, Karlsruhe, 76131, Germany
ABSTRACT
The use of high power microwaves to perform explosive spalling of surface concrete is a promising technique with applications in the area of concrete facilities decommissioning. The mechanism that creates explosive spalling is an interactive process of the thermal stress from high temperature gradients and the pore pressure generated from the water vaporization. In order to better predict the total stress distribution, the temperature has to be calculated by including the effect of water vaporization and water transport through a porous medium. In this paper, a one dimensional model solving the heat and diffusion equation for liquid and vapor phase with COMSOL finite element software is presented. The modelling of the drying process is based on the Spatial Reaction Engineering Approach (SREA developed by X.D. Chen). This paper discusses the influence of the relative energy activation parameter and effective diffusion coefficients on the temperature, water content and pore pressure in the case of fast microwave heating of concrete. This model is then used for a 3-D geometry with a sealed insulated concrete block and a conical antenna to compute the thermal stress, pore pressure and total stress.
Keywords:Concrete ablation, microwave heating, drying, SREA, thermal stress, pore pressure
1. INTRODUCTION
In the case of rapid heating of concrete with high power microwaves, evaporation/condensation of water occurs inside the porous material and leads to high thermal stress and pore pressure. The explosive spalling mechanism is not modelled in itself, but the effect of temperature and liquid content on the thermal stress and pore pressure respectively is in-vestigated with a coupled thermo mechanical model. To better predict the temperature field for the calculation of the thermal stress (Leperset al.,
2013) and the pore pressure, a porous model with solid, liquid and gas phase is currently developed. The concrete pore pressure has been calcu-lated by different authors using coupled heat transfer models with Lam-berts’s law for the microwave power distribution and an equation of state based on water content for the pore pressure (Bazant and Thonguthai,
1978;Akbarnezhad and Ong,2011).
The pore pressure was measured by Phan(2008) with explosive spalling occuring around2.1 MPaat240◦C. In reactive powder con-crete (RPC), the measured peak pore pressure was about3.3 MPaat a temperature of350◦C(Juet al.,2013).Bazant and Goangseup(2003b) have calculated the pore pressure with a hydro thermo mechanical model for different microwave frequencies. At2.45 GHzand temperature in the range of140−180◦
C, the pore pressure was in the range0.3−0.8 MPa. At 10.6 GHz and temperatures200−350◦C, the pore pressure was in the range1−3 MPa. They have suggested that the pore pressure could possibly trigger the mechanism of explosive spalling. In the case
∗
Corresponding author. Email: [email protected]
of concrete exposed to high temperature (such as fire for example) for time scales up to500 min,Mindeguiaet al.(2010) have measured the pore pressure for concrete of different compactness and showed that the low permeability concrete leads to higher pore pressure. Gawinet al. (2011a,b) have developed a complex multiphysics model with many pa-rameters taking into account the moisture transport, heat transfer, thermo chemical degradation and mechanical damage. For the case of concrete heated by fire, at a time scale up to7 h, the maximum calculated pore pressure was in the order of0.5 MPa.
measuring the water loss rate profile versus time. To simplify our model, the local liquid and vapor concentration are calculated with the assump-tion of a closed pore volume system and an ideal gas law for the behaviour of the vapour and air phase. For the 3-D coupled electromagnetic model, the complex permittivity of concrete and the thermal properties are ex-pressed as a function of the solid, liquid and gas phase. The computation of the temperature, liquid and water vapour concentration is necessary for the calculation of the total pressure. The pore pressure is combined with a thermoelastic model to compute the total stress. In the next section, the electromagnetic model of a conical antenna based on a standard WR 340 rectangular wave guide is briefly described. Then, the heat and mass transfer model together with the mechanical model used to compute the thermal stress and pore pressure of concrete are presented. The novelty of this work is the use the SREA approach (Chen and Putranto,2013a) in order to compute the liquid and vapor content distribution in concrete during microwave heating.
2. MATHEMATICAL MODELLING
2.1. Microwave model
The microwave power density is obtained by solving the wave equation in the frequency domain at2.45 GHzof a 3-D conical antenna including an air gap of10mm between the guide aperture and the concrete surface. The power density distribution is shown in Fig.1. The conical antenna is based on a standard86.6×43.3 mmrectangular wave guide. The length of the conical section is68 mmand is fully filled with Teflon PTFE. The width, heights of the entry and exit of the conical section are respectively
{54,43.3,21.6}mm.
(a) (b)
Fig. 1Power density distribution [W/m3] for the conical antenna with
input powerPin = 10 kWand an air gap of1 cmbetween the
antenna aperture and the concrete bloc with a constant relative permittivity= 6−0.68j(a). Power density in the center along the central y axis(b).
A 1-D model allows the calculation of the temperature, water and vapour content along the thickness of the concrete wall by the solving the coupled heat and diffusion equations with much shorter computation time than a 3-D model. Following Lambert’s law, an exponential decay of the E field and power density through the thickness of the concrete sam-ple is used. The attenuation constant is obtained from the power density calculated with a 3-D conical antenna electromagnetic model as shown in Fig.1(b). For,r = 6−0.68jat the frequencyf = 2.45 GHz,
the skin depth for the electric field is aboutδ = 4.18 cm(e−1 '0.36
attenuation of the maximum electric field). The attenuation constant is β = 1
δ = 23.9 1/m. The power density distribution used in the 1d
model is:
q(y) =q0e−2βy (1)
withq0 = 70 MW/m3 obtained with the 3-D conical antenna model
with10 kWof input power.
2.2. Heat and mass transfer model
2.2.1. Definitions For a solid material such as concrete, the volume vari-ation of the concrete sample (shrinkage or expansion) during heating is negligible and the system is assumed to be a sealed domain of constant volumeV and constant porosity.
V =Vs+Vl+Vv+Va (2)
The subscript s, l, v, a designating the solid, liquid, vapour and air phase. The porosity0and the solid fraction are:
0=
Vl+Vv+Va
V (3)
1−0=
Vs
V
The solidCsand local liquidCl, vapor concentrationCvand air
concen-trationCain kg/m3are:
Cs=
ms
V =
ms
Vs
Vs
V =ρs(1−0) (4)
Cl=
ml
V = ml
ms
ms
V =XlCs=ρlfl Cv=XvCs=ρvfv
Ca=XaCs=ρafa
Xl, Xv andXa are the local mass of liquid, vapour and air per kg of
dry solid andfi= VVi,i={l, v, a}are respectively the volume fraction
of liquid, vapour and air. For a closed volume, the air concentration is constant since the mass of air is constant.
2.2.2. Assumptions The assumptions used for the heat and mass trans-fer processes inside the porous model of concrete are:
• The effect of solid shrinkage or expansion on heat and mass trans-fer process is not taken into account, a sealed and constant volume is assumed.
• cracks formation and sudden increase of permeability are not mod-elled.
• The porous medium is homogeneous and isotropic (i.e.k, Dl, Dv
are scalar quantities).
• The diffusion coefficients are assumed to be constant. In reality, they are usually function of temperature and water content.
• The transfer of liquid and vapour water occurs by diffusion, the "effective diffusion " coefficient includes all the contribution to the fluid movement such as temperature and pressure gradient (Chen,
2007).
• The evaporation/condensation rate is proportional to the difference between the internal saturated vapour concentrationCint,sat and
the current concentration inside the solidCv.
• Because of fast microwave heating and for simplification of the analysis, the volume is sealed and insulated, no heat flux and mass flow (water or gas) cross its boundaries. In total, all the boundaries condition on the surface of the bloc are:n.∇T = 0,n.∇Cl= 0,
n.∇Cv= 0withnthe unit vector normal to the surface.
• The initial temperature and moisture content are uniformly dis-tributed.
2.2.3. Heat and mass transfer equations The temperature field is cal-culated with the heat equation for a porous medium
ρcp
∂T
∂t =∇ ·k∇T+qem−I∆H (5) with the thermal properties averaged with the solid, water and gas content (see appendix A).qemis the power density source term from microwave
heating andIthe rate of evaporation/condensation.∆H= 2257 kJ/kg
is the latent heat of vaporization of liquid water and assumed to be con-stant in the range20−300◦Cindependent of the temperature (in reality,
∆H= ∆H(P, T)). The initial temperature of the concrete block in the model isTi = 20◦C. The spatial distribution of the liquid and vapour
concentration at different times are calculated with the diffusion equa-tions:
∂Cl
∂t = ∇ ·Dl∇Cl−I (6)
∂Cv
∂t = ∇ ·Dv∇Cv+I
I = hm,inAin(Cint,sat−Cv)
Dl andDv are the effective diffusivity of the liquid and vapour phase
and depends of the micro structure of the porous material, the tempera-ture and pressure gradient (Chen,2007). The effective diffusivity can be function of the temperature and water content (Zhang and Datta,2004). It is assumed to be constant in this paper to facilitate the interpretation of the solution of the coupled heat and mass transfer equations. The heat Eq. (5) for temperature and the diffusion Eqs. (6) for liquid and vapour concentrations are coupled with the source/depletion termI modelling the evaporation/condensation process. This term is explained in more de-tails in the subsection2.2.4with the description of the drying model. The concept of using the reaction engineering approach to model this evap-oration/condensation term is based on the fact that this process can be seen as an activation process. hm,in[ m/s]is the internal mass transfer
coefficient associated with the pore surfaces (Chen and Putranto,2013a). Ain[ m2/m3]is the internal surface area per cubic meter. It depends on
the micro structure of the porous material (Putranto and Chen,2013a). The producthm,inAindepends on the micro structure of the porous
me-dia.
2.2.4. Drying model The drying model is based on the evaporation (or condensation) term proportional to the difference between the equilib-rium vapour pressure (or concentration) and the actual vapour pressure. I ∝ (Pv,sat−Pv) ∝ (Cv,sat−Cv). The equilibrium vapour
pres-sure and concentration are commonly called the saturated vapour prespres-sure Pv,satand concentration respectivelyCv,sat. To understand this relation
a constant volume with a mixture of water and vapour with three different states is considered:
Equilibrium, state 1
The closed system is in equilibrium with the environment, in this case the partial pressure of vapour is the equilibrium vapour pressure,Pv1 =
Pv1,satequivalent toCv1 =Cv1,sat. The number of gas molecules
en-tering to the liquid equals the number of molecules leaving the liquid and entering into the gas phase . Macroscopically, there is no evaporation or condensationI= 0.
Heating, state 2
The system is suddenly heated, the temperature and total pressure in-crease. In this case the saturated vapour pressure reaches a new state Pv2,sat > Pv1,sat. The vapour pressurePvof the mixture will increase
untilPv2,satto reach this new equilibrium. During this process,I > 0
and evaporation occurs.
Cooling, state 3
The system is initially in state 1 and then suddenly cooled. In this case,
the saturated vapour pressure drops to reach a new statePv3,sat< Pv1,sat.
The vapour pressurePvof the mixture will decrease untilPv3,sat. During
this transformation,I <0and condensation occurs. In this description of heating and cooling transformations of the liquid vapour mixture, the sat-urated (or equilibrium) vapour pressure and partial vapour pressure can be interchanged by the saturated vapour concentration and vapour con-centration.
The SREA approach to model the drying of a porous medium con-siders that additional energy is required to evaporate the liquid inside the solid (compared to free space for example). The evaporation/condensation term is modified and proportional to the difference between the internal saturated vapour concentrationCint,sat and the actual vapour
concen-tration Cv. In summary, when the vapour concentration of the actual
state is lower (higher) than the internal saturated vapour concentration, vapour is produced (consumed) withI∆Hbeing the power per unit vol-ume absorbed during evaporation and released during condensation. For Cv,s =Cv,I = 0, the internal vapour concentration equals the vapour
concentration, there is no evaporation or condensation and the system is in equilibrium. The main idea to model the drying process with the SREA approach is to consider evaporation as an activation process that can be described by an Arrhenius equation (Chen and Putranto,2013a):
Cint,sat = exp (−
∆Ev
RT )Cv,sat (7)
This Eq. (7) shows that if the activation energy∆Evis0, then the internal
saturated concentration is the saturated concentration in free space. If the
∆Evtakes large values, thenCint,sat << Cv,satand evaporation will
be small. The saturated vapour concentrationCv,satis not the same as
the saturated partial vapour density of waterρv,satbut can be linked to
it by taking into account the porosity and the actual liquid concentration Cl:
Cv,sat = ρv,sat
Vg
V (8)
= ρv,sat(0−
Vl
V)
= ρv,sat(0−
Cl
ρl )
WithVg =Vv+Vathe volume of the gas phase. ρv,satis the partial
density of the saturated vapour defined in respect to the gas volume and expressed with the Clapeyron relation (22) from appendix A. The partial density of air and vapour are function of the temperature and pressure described with the ideal gas law. ∆Evis the apparent activation energy
and can be expressed with a relative energy function:
∆Ev=f(Xl, Xl0, X∞)∆E∞ (9)
∆E∞=−RT∞ln(RH∞)
∆E∞represents the equilibrium activation energy or the activation en-ergy of the dry state.Xl= CCl
s, is the actual water content per unit mass
of dry solid. Xl0, X∞are given and are the liquid content of the initial and final states respectively.RH∞andT∞are the relative humidity and temperature of the dry state. To model a drying behaviour of a particu-lar porous sample the relative activation energy could be of the form for example:
f(Xl) =
Xl0−Xl
Xl0−Xl∞ n
(10)
f(Xl0) = 0
In principle, it should be obtained from a drying experiment but as ex-plained in this section below, it was not possible to experimentally obtain this function. The activation energy expressed in Eq. (9) will be used in the heat and diffusion Eqs. (5) and (6). Using Eq. (7), the internal saturated vapour concentration can be expressed as:
Cint,sat(Xl, T) =RH
T∞
T Xl
0−Xl
Xl0−Xl∞
n
∞ Cv,sat(T) (11)
in particular:
Cint,sat(Xl∞, T) = (RH∞)
T∞
T C
v,sat(T) (12)
Cint,sat(Xl∞, T∞) = (RH∞)Cv,sat(T∞)
Cint,sat(Xl0, T) = RH∞0 Cv,sat(T) =Cv,sat(T)
The Eq. (12) gives the definition of the relative humidity of the drying medium, i.e. the ratio between the vapour concentration and saturated vapour concentration of the dry state. The last equation shows that for the particular initial wet state with water concentrationXl0, the internal
vapour concentration equals the saturated water vapour concentration in free space. For an accurate drying model of the system, the relative acti-vation energy should be obtained from measurements. The time duration to achieve explosive spalling under high power microwave is in the order of10s. This short time scale gives some experimental difficulties for the measurement of the weight loss of water content during microwave heat-ing. In this sense, it is not a classical drying problem. In operation, the antenna and concrete block are placed in a shield metallic box to avoid any microwave leakage and the high electric field in the vicinity of the concrete sample does not allow to place sensitive electrical equipment nearby. According to the spatial engineering approach, the measurement of the water loss rate versus time is the central point to extract the relative activation energy function. This process will capture the behaviour of the porous material under drying conditions. In the case of rapid heating with high power microwaves, the rate of water content loss versus time was not available and the relative activation energy could not be built. For this reason, it was decided to perform the simulations for the two extreme cases of the relative activation energy functionf= 0andf= 1over the whole range, from wet to dry stateXl∞< Xl< Xl0.
Maximum evaporation (f= 0)
In this case, the activation energy isf = 0,Cint,sat =Cv,satandI =
hA(Cv,sat−Cv).
Maximum restricted evaporation (f= 1)
For the case of maximum restricted evaporation, f = 1, Cint,sat =
RH
T∞
T
∞ Cv,satandI=hminAin(RH
T∞
T
∞ Cv,sat−Cv)'0. 2.3. Mechanical model
With a 3-D mechanical model, it is possible to calculate the thermal stress from the temperature field. The total stress is calculated by adding the internal stress from the pore pressure on the diagonal components of the stress tensor.
2.3.1. Solid equilibrium
ρu¨(x, t)− ∇ ·σ(x, t)−κ(x, t) = 0 (13)
The mechanical model is based on force equilibrium (or Newton law ex-tended to solids) withρthe density of the solid,uthe displacement vec-tor,σis the material stress tensor for small deformation.κis the external volume forces such as gravity or magnetic forces. In our case, gravity can be neglected in comparison to internal thermal stress. In addition, the inertial termρu¨was neglected in comparison to the thermal stress because the time of the duration of the ”heat pulse” (microwave heating about10 s) is much larger than the characteristic time of propagation of stress waves inside the solid (speed of sound in the material over a char-acteristic length of the solid). The Eq. (13) without the inertial term is also called the quasi static approximation equilibrium of solids.
2.3.2. Linear elastic constitutive law The constitutive law used to model the concrete material behaviour is a linear elastic model or generalised 3d Hooke’s law as shown in Eq. (14). This behaviour is realistic in the elastic regime of the material. Three parameters are used to define the relation-ship between the strainand the stressσin the case of thermal expansion with a temperature difference∆T. The young moduleE, which repre-sents the stiffness of the material, the poisson ratioνwhich is the ratio between longitudinal and lateral displacement, and the linear thermal ex-pansion coefficientα. The pressurepis obtained from the heat diffusion model calculating the temperature, water and vapour content distribution inside the solid.
σ = σ0+
E
1 +ν+
Eν
(1 +ν) (1−2ν)tr()I−α
E
1−2ν∆TI
σ0 = −pI (14)
The effect of the pore pressurepis implemented as an initial stressσ0
operating only the diagonal components of the stress tensor σ. The Von Mises stressσm = √1
2
p
(σ1−σ2)2+ (σ2−σ2)2+ (σ3−σ1)2,
is used to evaluate the stress state inside the solid and to compare with the maximal material strength. σiare the main stress components of the
stress tensor. For concrete material, the maximum tensile or compres-sive strength depends on the loading scenario and more realistic failure criterion as the Von Mises stress have been developed. The choice of the failure criterion for concrete material is a field of research and is not discussed in the present paper.
2.3.3. Boundary conditions On all faces of the cube and the symmetry plane only tangential displacements are allowed, i.en·u= 0withnthe vector normal to the corresponding face. The face in front the aperture of the wave guide is not constrained, the displacements are allowed in all directions.
3. IMPLEMENTATION
3.1. 1-D model
The coupling termIbetween the heat and diffusion equations is modelled with the reaction engineering approach. Using Eqs. (7) and (8), it is written:
I=hm,inAin
exp −∆ Ev RT ρsat 0− Cl ρl
−Cv
(15)
withρsatgiven in from appendix A. The heat transfer, and partial
differ-ential equations node are chosen to solve the heat and diffusion Eqs. (6) with COMSOL 4.4 multiphysics software. The resolution of these partial differential equations is performed with the finite element method and ad-equate numerical methods incorporated in the software. The calculated fields are the temperatureT, the liquid concentrationCland the vapor
content Cv. The liquid and vapor content Xl and Xv are calculated
from Eq. (4). With the assumption of a constant sealed pore volume Vgas= (0−Cρl
l)V, the total pore pressure is calculated with the partial
pressure of vapour and air:
pv =
RT Mv mv Vgas = RT Mv Cv (0−Cρl
l)
(16)
pa =
RT Ma ma Vgas = RT Ma Ca (0−Cρl
l)
p = pv+pa
withR= 8.3 J/(mol.K), the universal gas constant and{Mv, Ma}= {18,29}g/molthe molar mass of the vapour and air. 0is the
two extreme values 0 (evaporation) and 1 (no evaporation) are used. The diffusion coefficients for vapour chosen for the simulation are: Dv = {10−2
,10−4,10−9}m2/s. The initial water content used for the model isXl0= 0.05 kg/kgdry solid.
3.2. 3-D model
The 3-D model solves the wave equation in the frequency domain, the heat and diffusion equations and the thermo elastic equations are solved every2 s until10 s. It is a non linear problem because the dielectric permittivity is function of the water content and needs to be updated at each time step. After solving this first problem, the temperature field and pore pressure are available and a second study is used to solve the mechanical model.
4. SIMULATION RESULTS AND DISCUSSION
4.1. Analytic estimation
4.1.1. Temperature increase For the maximum power density ofq = 70 MW/m3with∆t= 10 sof heating, with constant thermal properties and an adiabatic system, the temperature increase can be estimated from energy conservation during this amount of time:
∆T = q∆t
ρcp
(17)
' 364◦C
withρ= 2400 kg/m3andcp= 800 J/(kg.K).
4.1.2. Thermal stress In the case of a1d geometry and assuming a lin-ear elastic behaviour with Hooke’s law, the thermal stress is related to the thermal strain:
σ=E=Eα∆T (18)
withE= 30GP aand∆T = 300◦C, if we assume that for fast heating the concrete solid is blocked, the order of magnitude for the stress is σ'90M P awhich exceeds the tensile strength of most concrete. This estimation gives an upper limit of the possible stress because it is based on the maximal temperature difference possible and because the solid is completely blocked.
4.1.3. Pore pressure Water can be in liquid or gas state depending on the pressure and temperature conditions. In a pressure-specific volume (P-v) or pressure-temperature (P-T) diagram of water, the curves delim-iting the different states of water are called the saturated curves. For a pure substance in a closed volume, the saturated vapour pressure, is the pressure of the gas phase when in equilibrium with the liquid phase. The pressure evolution of a water vapour mixture is calculated for a con-stant volume (isochoric transformation) from an initial state of T = 100◦C and P = 101.3 kPato the final state with temperatureT = {200,300}◦
Cin order to estimate the maximal possible pore pressure. The initial specific volume for this initial state of the saturated liquid wa-ter and vapour are vvs1 = 1.67m3/kg, vls1 = 1.044dm3/kg. For
the final states atT ={200,300}◦
Cthe specific volume of liquid and vapour are respectively{vls200, vls300}={1.156,1.404}dm3/kgand
{vvs200, vvs300}={127.36,21.67}dm3/kg. If we have an initial state
made of a mixture of water and vapour, the mean specific volume of the mixture liquid and vapour is defined as:
¯
v=vl+ (vv−vl)×x (19)
withvl,vvthe specific volume of the liquid and vapour phase.x= mmv
is called the quality factor of the liquid - vapor mixture,mvandmare the
mass of the vapour and the total mass of the fluid respectively. The final pressure is calculated for the liquid vapour mixture of different initial quality factorx = {0.01,0.1,0.4,1}. In the table 1, the pressure of the water and vapour mixture is calculated for different quality factor
x 0.01 0.1 0.4 1
¯
v[m3/kg] 0.0178 0.1682 0.6698 1.6729 P200[MPa] 1.553 1.208 0.325 0.130
P300[MPa] 8.581 1.519 0.397 0.157
Table 1Pressure of the liquid-vapour mixture for an isochoric transfor-mation from initial stateT = 100◦Cand atmospheric pressure to the final temperaturesT ={200,300}◦C
and for the two final temperaturesT ={200,300}◦
Cfor the isochoric transformation (specific volume is constant from state 1 to state 2 ,v¯2=
¯
v1).
From table1, the specific volume of the mixture withx= 0.01is
¯
v = 17.8 dm3/kg
and bounded by saturated liquid and vapour specific volume{vls200, vls300} < v <¯ {vvs200, vvs300}for the final state at
{200,300}◦
C. In this case, the corresponding state is a mixture of liquid and vapour and the corresponding pressure is the saturated vapour pres-sure at these corresponding temperature,T = {200,300}◦
C. For the mixtures with higher vapour quality factorx={0.1,0.4,1}, their spe-cific volume are higher than the spespe-cific volume of the saturated vapour
¯
v = {vx0.1, vx0.4, xx1} > {vvs200, vvs300}, these mixtures are in the
super heated vapour state. Looking into the corresponding table for super heated vapour and for the specific volume, the pressure can be obtained. For the same temperature increase, a high vapour mixture tends to give a smaller pressure than a high liquid mixture. The mixture with high vapour content behaves more closely to a perfect gas. The pressure ranges from
1.5 MPafor a mixture withx = 0.01content to0.13 MPafor pure vapour (x= 1) atT = 200◦C. The pressure ranges from8.6 MPafor a mixture withx= 0.01to0.16 MPafor pure vapour atT = 300◦C.
The saturated (or equilibrium) vapour pressure of pure water can also be calculated with the Clapeyron equation:
lnpsat(T)
p0
= H
R(
1
T0
− 1
T) (20)
if we assume that the latent heat of vaporisation of water is constant H = 40 kJ/mol. R = 8.3 J/(mol.K)is the universal gas constant. T0 = 373 K with the corresponding saturated vapour pressurep0 =
101.3 kPacan be chosen for example. For the case of very fast heat-ing, an isochoric transformation is a logic assumption, since water does not have time to move through the porous medium. In reality the time scale of the mass transfer is larger or the same order than the time scale of heat transfer through the porous medium and so the transformation of the water vapour mixture during microwave heating is not isochoric. The volume of the mixture water and vapour may increase during heating, (for example if steam is moving through a open pore networks) causing a reduction of the pressure. Hence, the isochoric transformation assump-tion gives an upper limit of the pore pressure during fast heating. If the liquid-vapour mixture is mixed with air, the total pressure will be the sum of the partial pressure of the vapour and the air.
4.1.4. Time scale analysis With a characteristic lengthLof the micro structure of the medium and the thermal properties of the solid phase of the concrete taken from appendix A,κ= k
ρcp '8.8×10
−7 m2/sthe
thermal diffusivity of dry concrete, andDthe mass diffusion coefficient, the time scales for the heat and mass diffusion are:
theat =
L2
κ (21)
tdif f =
L2 D theat
tdif f
= D
κ
D = theat
tdif f
If the porous medium has large open porosity or cracks, the time constant for the mass diffusion mechanism can be smaller than the thermal time constant. In this case, the diffusion coefficient can be much larger than the thermal diffusivity. On the contrary, for a sealed domain with closed porosity, there is no mass diffusion possible,tdif f =∞and the diffusion
coefficientDis0. In our first simulation, it was assumed thatDl'0<<
Dv. The vapour diffusion coefficient is assumed to be constant (not the
case in reality) and simulations were made for a large and a small vapour diffusionDv={10−2,10−9}m2/scoefficient.
4.2. Numerical results
4.2.1. 1-D model In this section, the power density, temperature, liquid content, vapour content and pore pressure distribution through the first
10 cmthickness of the40 cmsample are given for the extreme values of the relative activation energy corresponding to maximum evaporation (f = 0) and no evaporation (f = 1). The simulation are made for three different values of vapour diffusion coefficientsDv= 10−2,10−4, 10−9 m2/s
. All these calculated variables are represented along the depth of the concrete and after10 sof microwave heating with10 kW
input power. A large vapour diffusion coefficient was chosen to evaluate the effect of diffusion on the time scale of10 s. This could hypothetically correspond for example to an open cracks where a large passage through the porous medium is available for vapour transport.
(a)f= 1 (b)f= 0
Fig. 2Power density [W/m3
] forDv = {10−2,10−4,10−9}m2/s
with no evaporation(a)and with evaporation(b)
Power density In case of no evaporation (f = 1), the Fig.2(a)shows that the power density distribution is independent of the vapour diffu-sion coefficient. Because there is no evaporation process inside the mate-rial, no vapour is created and the local liquid and vapour content remains constant. For this reason, the power density profile is not modified by different diffusion coefficients. The Fig.2(b)with maximum evapora-tionf = 0shows that the power density is modified from the endother-mic evaporation process. With larger vapour diffusion coefficient, vapour is transported through the material and more evaporation occurs. When the temperature of the water vapour mixture decreases in contact of the colder domains of the solid skeleton of the porous medium, the tempera-ture can be lower than the saturation temperatempera-ture of the mixtempera-ture. In this case, condensation occurs and the vapour releases latent heat during the condensation process. The Fig.2(b)shows that for depth above1 cm
the power density magnitude forDv = 0.01 m2/scase (blue curve) is
higher than the case with limited vapour transport (Dv = 10−9 m2/s,
red curve). In this case, heat from condensation has been released to the concrete in the colder part of the domain. It is also interesting to see that the maximum of the power density is located aty ' {4,10}mmfor Dv={10−4,10−2}m2/srespectively.
Temperature The Fig.3(a)shows that there is no influence of the va-por diffusivity because there is no evava-poration. The power density is unchanged and so the thermal properties. The Fig.3(b)shows the effect
(a)f= 1 (b)f= 0
Fig. 3Temperature [◦C] forDv ={10−2,10−4,10−9}m2/swith no
evaporation(a)and with evaporation(b)
of evaporation and vapour transport on the surface with a temperature difference of about40◦Cbetween limited (red curve) and large vapour transport (blue curve). A maximum surface temperature around300◦Cis realistic and was observed experimentally in our laboratory (See thermo camera picture in appendix B).
Liquid and vapor content Figures4(a)and4(b)show the liquid and vapor content for the case of maximum evaporation and for the 3 diffu-sion coefficients. The case of no evaporation is not of interest because the liquid and vapour content remain unchanged. More liquid is removed in the first1 cmconcrete depth when the vapour diffusivity increases. For theDv = 10−9m2/sthe vapour increases locally near the surface.
ForDv = 10−2 m2/s, the vapour diffuses through the thickness. It is
also interesting to observe that locally the water contentXlcan exceed
the uniform initial water contentXl0. This is due to the transport and
condensation of steam. These different vapour distribution through the thickness explains the different vapour and pore pressure distribution in-side the sample.
(a)Xl (b)Xv
Fig. 4Liquid contentXl[−](a)and vapor contentXv[−](b)forDv= {10−2,10−4,10−9}m2/s
Total pressure The Fig.5(a)shows that the peak pressure near the sur-face is about 0.2 MPa. For a sealed volume, with no vapour creation from the liquid phase, the effect of pressure build up with temperature is mostly due to the thermal expansion of air and vapour, according to the ideal gas model, the pressure is proportional to the temperature. The Fig. 5(b) shows that the peak pressures areP ' {2,9,14}MPafor Dv={10−2,10−4,10−9}m2/srespectively. Near the surface, vapour
is rapidly created and moves through the solid with a velocity function of the porosity of the material (or the diffusion coefficient). The partial pressure of vapour is proportional to the vapour concentration through the ideal gas law for a given temperature. At the maximum tempera-ture of320◦C, the saturated vapour pressure of liquid vapour water is
that the specific volume of the liquid vapour mixture exceeds the satu-rated specific volume, in this case the state of vapour is called superheated steam.
(a)f= 1 (b)f= 0
Fig. 5Total pore pressureP[Pa] forDv={10−2,10−4,10−9}m2/s
with no evaporation(a)and with evaporation(b)
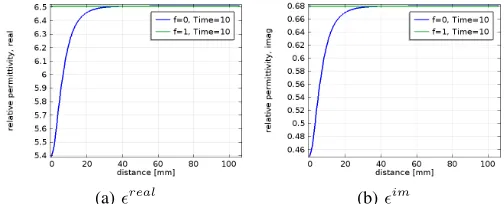
Materials properties The complex permittivity and thermal properties (thermal diffusivity and specific heat) expressed as a function of the solid, liquid and gas phase properties and weighted with the corresponding vol-ume fraction (see appendix A), are plotted in Figs.6and7. The value of the real part is between 6.7 and 8, the imaginary part is between 0.4 for the dry state and 0.7 for the wet state. The dielectric properties fol-low closely the liquid content distribution because it is the dominant fac-tor that influence the dielectric properties for a constant temperature (At room temperature, free water has a real part of the relative permittivity of about 80, but in the case of concrete, the water is also bounded and for this reason the real part was taken to be 30). The dielectric properties are also strongly affected by temperature, but this effect is not investigated in this study.
(a)real (b)im
Fig. 6 Relative permittivity, real part(a)and imaginary part (b)with evaporation forDv={10−2,10−4,10−9}m2/s
(a)κ (b)c
Fig. 7 Effective thermal diffusivity (a) and effective spe-cific heat [J/(kg.K)] (b) with evaporation for Dv = {10−2
,10−4,10−9}m2/s
The Fig.7(a)shows the effective thermal diffusivity for the 3 dif-ferent diffusion coefficients with values between{79,91} ×10−8 m2/s
. The Fig.7(b)shows the effective thermal specific heat with values be-tween{885,970}J/(kg.K). The effective specific heat decreases dur-ing microwave heatdur-ing because of the decrease of the water content inside the first centimetre of the concrete.
4.2.2. 3-D model The 3-D model solves the wave equation in the fre-quency domain at2.45 GHz. A time dependant solver is used to cou-ple the electromagnetic model to the heat transfer and mechanical model. The complex dielectric permittivity of the concrete is expressed as a func-tion of the solid, liquid and gas phase. The thermal properties are also depending on the liquid and gas content (see appendix A). Material prop-erties are updated at each time steps and the electromagnetic model com-puted with the updated dielectric permittivity of the porous material. The mechanical model solves the elasticity equations to obtain the thermal stress from the temperature of the heat transfer model. The total stress is computed by adding the pore pressure as an initial stress contribution. The pore pressure is calculated with the distribution of the water and vapour content obtained from the coupled heat and mass transfer model. The results are presented for the case of no diffusionDv= 0 m2/sand
with large diffusionDv= 10−2 m2/swithf={0,1}.
(a) (b)
Fig. 8 Power density [W/m3] for Dv = 0 m2/s (a) and Dv = 10−2m2/s(b)and with evaporation (blue) and no evaporation
(green)
Power density The Fig.8(a)shows that power density forf = 0and f = 1is nearly identical. The Fig.8(b)shows that in the case of evap-oration, the maximum of the power density is about30 MW/m3 and
located about1 cminside the material. The power profile is similar with the power profile from the 1-D model (see figure2(b)). The discrepan-cies are due to some difference in the given initial power density and the variation of the dielectric permittivity with the 3 phases in the case of the 3-D model (See blue curves of Figs. 2(b)and8(b)).
(a) (b)
Fig. 9Temperature [◦C] forDv= 0 m2/s(a)andDv= 10−2m2/s(b)
Temperature The maximal temperature is about 300◦C (see figure
9(a)) near the surface for the case with no diffusion (320◦Cfor the 1-D case). The Fig.9(b)shows that with high diffusion and evaporation, the maximum temperature is about250◦C(280◦Cfor the 1-D case). The temperature calculated with the 1-D model are slightly higher because the microwave power density does not vary with the dielectric permit-tivity since the power density is approximated with Lambert’s law. The comparison of Figs. 2(b)and8(b)shows that the maximum power den-sity with evaporation is about40 MW/m3and30 MW/m3for the 1-D and 3-D model respectively.
(a) (b)
Fig. 10 Liquid content Xl [−] for Dv = 0 m2/s (a) and Dv = 10−2m2/s (b)and with evaporation (blue) and no evaporation (green)
Liquid content The liquid content shown in Fig. 10decreases near the surface of the concrete. For the case of no diffusionXl'0.0492 kg/kg
at the surface an about0.032 kg/kgfor the case with large diffusion and is comparable to the 1-D case withXl'0.026 kg/kgfrom Fig.4(a).
(a) (b)
Fig. 11Pore pressure P [Pa] forDv= 0 m2/s(a)andDv= 10−2m2/s (b)and with evaporation (blue) and no evaporation (green)
Total pressure Figure11(a)shows that the maximum pressure near the surface is about9.5 MPawhen evaporation occurs. At300◦Cthe satu-rated vapour pressure of water is8.5M P a. With large vapour diffusivity, the Fig.11(b)shows lower pressure with a maximum of0.3 MPalocated
7 mmin depth. The pressure profile is similar to the pore pressure pro-file calculated byBazant and Goangseup(2003a,b) with a maximum of
0.2 MPaat2.45 GHz.
Von Mises stress In the case of high diffusion, the effect of the pressure on the Von Mises stress is negligible (Pσ '100) and therefore not visible in Fig.12(b). In the case of no diffusion which could correspond to a high performance concrete), the difference in the Von Mises stress when the effect of the total pressure is included or not is about8 MPa(see Fig.12(a)). The total stress is mostly driven by the thermal stress function of the temperature gradients.
(a) (b)
Fig. 12Von Mises [Pa] forDv= 0 m2/s(a)andDv= 10−2m2/s(b)
and with pressure (green) and no pressure included (blue)
(a) (b)
(c) (d)
Fig. 13Von Mises [MPa] forDv= 0 m2/sforf= 1(a)and forf= 0 (b). Von Mises stress forDv = 0.01 m2/sforf = 1(c)and
forf = 0(d). All the domains with a Von Mises stress above
25 MPaare not shown. f = 1means no evaporation,f = 0
means maximum evaporation
The Figs.13(a)and13(b)show the Von Mises stress inside the mate-rial without and with evaporation respectively. With evaporation, higher stress occurs in the center with values above25 MPa, the material with stress above this limit is not represented. For the case of high diffusion (see Figs. 13(c)and13(d), withDv = 0.01 m2s, the effect of
evapo-ration leads to a distribution of the vapour content through the domain, lowering the total pressure. Hence, the total stress is lower in case of evaporation, the transport of heat from vapour decrease the thermal gra-dients and so the thermal stress. The comparison between Fig. 13(a)and
13(c)in the case of no evaporation or Figs.13(b)and13(d)in the case of evaporation shows that a larger diffusion coefficient lowers the total stress. For comparison, typical strength of normal Portland cement con-crete are 2 to 5 MPafor the tensile strength and 20 to 40 MPafor the compressive strength.
(a)real (b)im
Fig. 14Relative permittivity forDv = 10−2m2/s, real part(a)and
imaginary part(b)with evaporation (green) and with no evapo-ration(blue)
(a)κ (b)c
Fig. 15Effective thermal diffusion [m2/s] forDv= 10−2 m2/s(a)and
effective specific heat [J/(kg.K)](b)with evaporation (green) and with no evaporation (blue)
The Figs.15(a)and15(b)show the the variation of the thermal dif-fusivity and effective specific heat within depth for the 3-D model. As the surface is drying, less water content is present and the effective specific heat falls from960J/(kg.K)(initial state) to905J/(kg.K)(dry state).
5. CONCLUSION
A coupled multiphysics model based on heat an mass diffusion equa-tions was developed in order to compute the total stress and to compare the thermal stress with the pore pressure. The deliberate use of con-stant and extremes values for the vapour diffusion coefficients is to facil-itate the interpretation of the results and to help the understanding of the physical mechanisms involved during microwave heating of the porous concrete material. It was not possible to directly compare with exper-imental work, but the pressure values are consistent with literature and with the saturated vapour pressure. With a conical antenna operating at
2.45 GHzand an input power of10 kW, the maximal temperature cal-culated near the surface are about300◦Ccorresponding to temperatures measured experimentally. For this temperature, the calculated pore pres-sure is9.5 MPafor the isochoric transformation (closed volume domain, no diffusion ) and about0.2 MPawith a large vapour diffusion coeffi-cientDv = 0.01 m2/s. The maximum Von Mises stress is in the range 28−37 MPaand located about7−8 mminside the concrete. From these first results, it seems clearly that the thermal stress is the dominant effect in case of explosive spalling of concrete with microwave heating. The pore pressure could play a role in triggering the spalling as suggested in the literature. It was observed experimentally that larger ablations oc-cur in wet concrete than in dry concrete. One explanation could be that the microwave power density is higher in the case of wet concrete because of higher loss factor. The Spatial Reaction Engineering Approach used to calculate the water and vapour content distribution has the advantage of using a limited number of new parameters. Some large uncertainty exist for some parameters describing the porous medium such as the internal
mass transfer coefficienthm,inor internal surface areaAin. In principle
these parameters could be determined experimentally or estimated from the micro structure of the material. The relative activation energy was not available from experiment and therefore only two extreme cases were simulated, maximum and no evaporation. For further works, it would be useful to obtain this relative activation energy function. Secondly, a bet-ter estimation of the effective diffusion coefficient for liquid and vapour would be useful to improve the model. This is not a simple task because concrete under fast microwave heating is experiencing probably internal micro or macro cracks. The modification of the micro structure changes drastically the values of the diffusion coefficients. Finally, the calculated total stress exceeds the concrete strength and so these values are consis-tent with the apparition of the explosive spalling which occurs with our current antenna in the range from3to10sdepending on the concrete initial water content and porosity.
NOMENCLATURE
q0 peak power density (W/m3)
β attenuation constant for a plane wave (1/m) Vi Volume of the phase i (i=s, l, v, a) (m3)
0 Porosity (-)
fi =Vi/V volume fraction of phasei=s, l, v, a(-)
Ci local concentration of phasei={s, l, g, v, a}(kg/m3)
ρi density of phasei={s, l, g, v, a}(kg/m3)
ρ effective density (kg/m3)
Xi mass content of phasei={l, v, a}(kg/kg dry)
Dl liquid effective diffusivity (m2/s)
Dv vapor effective diffusivity (m2/s)
I Evaporating / condensation rate (kg/(s.m3)) hm,in internal mass transfer coefficient (m/s)
Ain internal surface area (m2/m3) ∆Ev activation energy(J/kg)
∆E∞ equilibrium activation energy of the dry state (J/kg) RH∞ relative humidity of the dry state (-)
T∞ temperature of hot air, dry state (K) c effective specific heat (J/kg·K)
ci specific heat of phasei={s, l, g, v, a}(J/kg·K)
k effective thermal conductivity(W/(m.K))
ki conductivity of phasei={s, l, g, v, a}the solid(W/(m.K))
Cint,sat internal saturated (or equilibrium) vapour concentration(kg/m3)
Cv,sat saturated (or equilibrium) vapour concentration (kg/m3)
ρv,sat saturated vapour (or equilibrium) density((kg/m3)
I source/depletion coupling term (kg/s.m3)
∆H latent heat of vaporisation of water (J/kg) H latent heat of vaporisation of water (J/mol) σ stress tensor (Pa)
σ0 initial stress tensor (Pa)
E Young modulus (Pa) ν poisson ratio (-)
α linear expansion coefficient (1/K) Mv molar mass of water (kg/kmol)
Ma molar mass of air (kg/kmol)
R Universal gas constant (J/kg K)
real real part of the relative effective permittivity
reali real part of the relative permittivity of phasei={s, l, g, v, a}
im
imaginary part of the relative effective permittivity
imi imag part of the relative permittivity of phasei={s, l, g, v, a}
theat time constant for the heat transfer model (s)
tdif f time constant for diffusion model (s)
L characteristic length (m) κ thermal diffusivity (m2/s
ACKNOWLEDGEMENTS
This research and development project is funded by the German Federal Ministry of Education and Research (BMBF) within the funding action "Decommissioning / dismantling of nuclear facilities " (funding number 02S8719) and managed by the Project Management Agency Karlsruhe (PTKA).
REFERENCES
Akbarnezhad, A., and Ong, K., 2011, “Thermal Stress and Pore Pressure Development in Microwave Heated Concrete,”Computers and Concrete,
8(4), 425–443.
http://dx.doi.org/10.12989/cac.2011.8.4.425.
Bazant, Z.P., and Goangseup, Z., 2003a, “Decontamination of Radionu-clides from Concrete by Microwave Heating.1: Theory,”Journal of engi-neering mechanics,129(7), 777–784.
http://dx.doi.org/10.1061/(ASCE)0733-9399(2003)129:7(777).
Bazant, Z.P., and Goangseup, Z., 2003b, “Decontamination of Radionu-clides from Concrete by Microwave Heating.2: Computations,”Journal of engineering mechanics,129(7), 785–792.
http://dx.doi.org/10.1061/(ASCE)0733-9399(2003)129:7(785).
Bazant, Z.P., and Thonguthai, W., 1978, “Pore Pressure and Drying of Concrete at High Temperature,”Journal of the engineering mechanics division,52, 1059–1079.
Chen, X., 2007, “Moisture Diffusivity in Food and Biological Materials,”
Drying technology,25, 1203–1213.
http://dx.doi.org/10.1080/07373930701438592.
Chen, X., 2008, “The Basics of a Reaction Engineering Approach to Modeling Air-drying of Small Droplets or Thin Layer Materials,” Dry-ing technology,26, 627–639.
http://dx.doi.org/10.1080/07373930802045908.
Chen, X.D., and Putranto, A., 2013a, “Modelling Drying Processes, a Reaction Engineering Approach,”Cambridge University Press.
http://dx.doi.org/10.1017/cbo9780511997846.
Chen, X.D., and Putranto, A., 2013b, “Spatial Reaction Engineering Ap-proach as an Alternative for Nonequilibrium Multiphase Mass Transfer Model for Drying of Food and Biological Materials,”American Institute of Chemical Engineers,59(1), 55–67.
http://dx.doi.org/10.1002/aic.13808.
Gawin, D., Pesavento, F., and Schrefler, B.A., 2011a, “What Physical Phenomena can be Neglected when Modelling Concrete at High Tem-perature? A Comparative Study. Part 1: Physical Phenomena and Mathe-matical Model,”International Journal of Solids and Structures,48, 1927– 1944.
http://dx.doi.org/10.1016/j.ijsolstr.2011.03.004.
Gawin, D., Pesavento, F., and Schrefler, B.A., 2011b, “What Physical Phenomena can be Neglected when Modelling Concrete at High Tem-perature? A Comparative Study. Part 2: Comparison between Model,”
International Journal of Solids and Structures,48, 1927–1944.
http://dx.doi.org/10.1016/j.ijsolstr.2011.03.003.
Incropera, F.P., and DeWitt, D.P., 1996, “Fundamental of Heat and Mass Transfer,” 839–843. ISBN 0-471-30460-3.
Ju, Y., Liu, H., Tian, K., Liu, J., Wang, L., and GE, Z., 2013, “An In-vestigation on Micro Pore Structures and the Vapor Pressure Mechanism of Explosive Spalling of RPC Exposed to High Temperature,”Science China, technological science,56(2), 478–470.
http://dx.doi.org/10.1007/s11431-012-5110-4.
Lepers, B., Soldatov, S., Link, G., and Jelonnek, J., 2013, “A Thermoe-lastic Model for Microwave Ablation of Concrete,” 14th International Conference on Microwave and high frequency heating, Nottingham UK.
Mindeguia, J., Pimienta, P., Noumowe, A., and Kanema, M., 2010, “Tem-perature, Pore Pressure and Mass Variation of Concrete Subjected to High Temperature- Experimental and Numerical Discussion on Spalling Risk,”
Cement and Concrete Research,40, 477–487.
http://dx.doi.org/10.1016/j.cemconres.2009.10.011.
Phan, L., 2008, “Pore Pressure and Explosive Spalling in Concrete,” Ma-terials and Structures,41, 1623–1632.
http://dx.doi.org/10.1617/s11527-008-9353-2.
Putranto, A., and Chen, X.D., 2013a, “Multiphase Modeling of Intermit-tent Drying Using the Spatial Reaction Engineering Approach (S-REA),”
Chemical engineering and processing,70, 169–183.
http://dx.doi.org/10.1016/j.cep.2013.04.005.
Putranto, A., and Chen, X.D., 2013b, “Spatial Reaction Engineering Ap-proach as a Multiphase Drying ApAp-proach to Model the Heat Treatment of Wood under a Constant Heating Rate,”Industrial and engineering Chem-istry research,52, 6242–6252.
http://dx.doi.org/10.1021/ie4000689.
Soldatov, S., Kayser, T., Link, G., and Jelonnek, J., 2013, “Tempera-ture Dependent Dielectric Measurements of Concrete with Cavity Pertur-bation Method,”14th International Conference on Microwave and High Frequency Heating, Nottingham UK.
Zhang, J., and Datta, A., 2004, “Some Considerations in Modeling of Moisture transport in Heating Hydroscopic Materials,”Drying Technol-ogy,22(8), 1983–2008.
http://dx.doi.org/10.1081/DRT-200032740.
APPENDIX A
The saturated vapour concentration of water can be expressed from the Clapeyron Eq. (20) and the ideal gas law for vapour with the following expression:
ρv,sat(T) = Mv
RTpsat(T)
Material properties
Electric permittivity For a 3-D model solving the wave equations and computing the power density distribution inside the sample, the relative permittivity depends on the water content inside the material. The relative real and imaginary part of the dielectric permittivity can be expressed as a function of the dry solid, the water, vapor and the air.
real,im=fsreal,ims +flreal,iml + (fv+fa)real,img
withfi= Cρi
i fori={s, l, v, a}the volume fraction of the solid, liquid
vapour and air phase. The effective permittivity can be written as:
real,im = Vs
V
real,im
s +
Vl
V
real,im
l +
Vg
V
real,im g
= Cs
ρs
real,ims +
Cl
ρl
real,iml + (1−Cs
ρs −Cl
ρl
)real,img
withrealg =realv =reala = 1andimg =imv =ima = 0. The
mea-surement of different samples of dry concrete (no more free water) from
Soldatovet al.(2013) have given the following range for the loss tangent and real part of the permittivity0.01 <tanδ <0.03,4< real <5. This gives for the relative imaginary part0.04< im <0.15
es = 4−0.08j. The free water inside the concrete is in some
de-gree bounded to the concrete, and for realistic concrete permittivity value range, the permittivity of the liquid phase has to be lower than the free water. It was set tol= 30−6j. The intrinsic temperature dependence
of the dielectric properties is not taken into account in this present work.
Thermal properties
Density The effective density is the mass of all the constituents over the total volume:
ρef f =
ms+ml+mv+ma
V
= Cs+Cl+Cv+Ca
The concentration are related to the density of the substance with Eq. (4). For the dry concrete and water the density are{ρs, ρl}={2400,1000} kg/m3. The density of vapour and air function of temperature and pres-sure was calculated with the ideal gas law.
Specific heat The specific heat is calculated from energy conservation below:
mcef f =mscs+mlcl+mgcg
mcef f
V =ρef fcef f =Cscs+Clcl+Cgcg
cef f=
Cscs+Clcl+Cgcg
ρef f
The specific heatcgof the mixture vapour and air assuming an ideal gas,
follows Dalton law:
cg(T) =
naMa
naMa+nvMv
ca(T) + nvMv
naMa+nvMv
cv(T)
= ma
ma+mv
ca(T) + mv
ma+mv
cv(T)
= Ca
Ca+Cv
ca(T) + Cv
Ca+Cv
cv(T)
withm, the total mass,mithe mass of the constituent i (i=s, l, a, v).
Ciandci,i = s, l, v, a. ni is the number of moles of the constituent
i andMi is the molar mass (Ma = 29 g/molandMv = 18 g/mol).
are respectively the concentration and specific heat of the constituentiat constant volume. Cg =Cv+Ca is the concentration of the gas. For
an ideal gas, the specific heat is only function of temperature.cv(T)and ca(T)are linearly interpolated from thermodynamic table. {cs, cl} = {800,4200}J/(kg.K)for dry concrete and liquid water.
Thermal conductivity The effective thermal conductivity is defined in the same way as the specific heat and weighted with the mass fraction of its constituents.
kef f =
Csks+Clkl+Cgkg
ρef f
kg =
Ca
Ca+Cv
ka(T) + Cv
Ca+Cv
kv(T)
withVi , ki andρi the volume, thermal conductivity and density
of the constituenti. ka(T)andkv(T)are defined fromIncropera and DeWitt(1996). The thermal conductivity of the gas is defined according to the mass ratio of air and vapour.{ks, kl}={1.7,0.6}W/(m.K).
Mechanical properties For the mechanical model, standard properties of normal Portland cement concrete were used. The following values for the young modulus, poisson ratio and linear thermal expansion coefficient were used.{E, ν, α}={30 GPa,0.12,10−5 1/K}
APPENDIX B
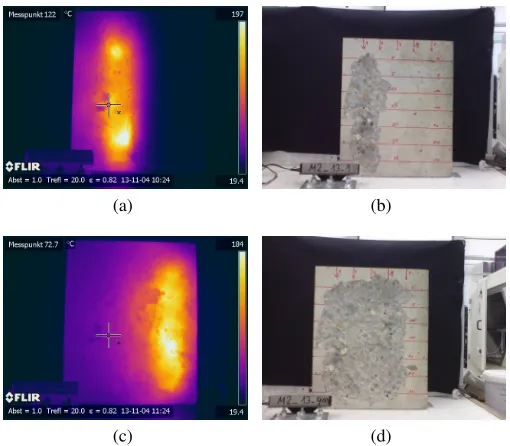
Ablation tests were performed on concrete blocs of33×40×10 cm
with a conical antenna of input power10 kWoperating at2.45 GHz. An air gap of 1 cm between the surface of the concrete and the aperture of the antenna avoids direct heat conduction from the concrete surface to the antenna. Explosive spalling depends of the water content and the type of the concrete. With our antenna explosive spalling occurs after3
to10 sof high power microwave heating depending on the input power and displacement rate of the concrete blocs(see Fig.16(b)).
(a) (b)
(c) (d)
Fig. 16Pictures of the surface ablation and temperature of the surface recorded with a thermo camera. The ablation time for one column takes about30 s. Surface temperature was about160−190◦C af-ter some seconds of air natural convection cooling. Temperatures in the range of200−300◦
![Fig. 1 Power density distribution [ W/m3] for the conical antenna withinput power Pin = 10 kW and an air gap of 1 cm between theantenna aperture and the concrete bloc with a constant relativepermittivity ϵ = 6 − 0.68j (a)](https://thumb-us.123doks.com/thumbv2/123dok_us/8813618.1779032/2.612.47.296.382.486/density-distribution-withinput-theantenna-aperture-concrete-constant-relativepermittivity.webp)

![Fig. 3 Temperature [ ◦C] for Dv = {10−2, 10−4, 10−9} m2/s with noevaporation (a) and with evaporation (b)](https://thumb-us.123doks.com/thumbv2/123dok_us/8813618.1779032/6.612.319.572.59.164/fig-temperature-c-dv-m-s-noevaporation-evaporation.webp)
![Fig. 5 Total pore pressure P [ Pa] for Dv = {10−2, 10−4, 10−9} m2/swith no evaporation (a) and with evaporation (b)](https://thumb-us.123doks.com/thumbv2/123dok_us/8813618.1779032/7.612.39.295.605.705/fig-total-pore-pressure-pa-swith-evaporation-evaporation.webp)
![Fig. 13 Von Mises [ MPa] for Dv = 0 m2/s for f = 1 (a) and for f = 0(b). Von Mises stress for Dv = 0.01 m2/s for f = 1 (c) andfor f = 0 (d)](https://thumb-us.123doks.com/thumbv2/123dok_us/8813618.1779032/8.612.316.559.215.437/fig-von-mises-mpa-von-mises-stress-andfor.webp)