Designing Multifaceted Open Social Learner Models
Lei Shi, Alexandra I. Cristea and Suncica Hadzidedic Department of Computer Science, University of Warwick,
CV4 7AL, Coventry, United Kingdom {lei.shi, acristea, s.hadzidedic}@dcs.warwick.ac.uk
Abstract. Open social learner modelling (OSLM) approaches are promoted in order to assist learners in self-directed learning, towards a higher level of presence and engagement. Still, most approaches only focus on visualising learners’ performance, or providing complex tools for social navigation. Our proposal, additionally, emphasises the importance of visualising both learners’ performance and their contribution to a learning community. We seek also to seamlessly integrate OSLM with learning contents, in order for the multifaceted OSLM’s prospect for ubiquity and context-awareness to enrich the adaptive potential of social e-learning systems. This paper thus presents the design of multifaceted OSLM by introducing novel, personalised social features into Topolor, a social personalised adaptive e-learning environment. The umbrella target is to create and study aspects of social learner models. An experimental study is conducted to analyse the impact of the newly introduced features. The results are concluded to suggest future research and improvements.
1 Introduction
Following from existing studies, the main research goal presented in this paper is to explore the design of multifaceted open social learner models (OSLM) in a social personalised adaptive e-learning environment [18]. Compared to existing studies, this research aims at enabling interactive visualisation of different OSLM angles, to potentially promote metacognitive activities. Unlike existing approaches that use OSLM visualisation only as a social navigation tool, our approach also seeks to seamlessly and adaptively integrate OSLM with the learning contents, so that its ubiquity and context-awareness can support new adaptation and personalisation methods for social e-learning. It is also noteworthy that, unlike existing studies that focus only on visualising learners’ performance, we emphasise the possibility and (in our view) necessity of visualising both performance and contribution, reflecting not only a learner’s role as a knowledge consumer, but also that of a knowledge producer, which can better integrate in the Web 2.0 and Web 3.0 era. Importantly, the visualisation is built on a Facebook-like appearance, and on features inspired from popular games, instead of on traditional learning environment visualisations.
In the remainder of the paper, section 2 details related work on OSLM and systems supporting social learner models visualising, explaining the need of a multifaceted OSLM. Section 3 shortly describes Topolor, the social e-learning environment and the basis for the new multifaceted OSLM. Section 4 elaborates on the newly introduced features. An experimental study is reported in section 5, analysing the impact of these features; and section 6 outlines conclusions and future work suggestions.
2 Related Work
A learner model often refers to a model of knowledge, or other characteristics of a learner, constructed from direct input or observation of learning activities in, e.g., adaptive educational hypermedia systems (AEHS), and updated according to the learner’s current understanding of the target learning contents; while an open learner model has specific provisions for the learner to explicitly view the information in her model, so as to support self-observation and self-reflection of her own and her peer learning processes, as well as explain to her the reason of getting a recommendation [9]. OLM have been implemented using a wide range of modelling approaches, such as models constructed using conceptual graphs [16], fuzzy models [17], and transferable belief models [12]. Various educational benefits brought by OLM are thoroughly discussed in the literature, such as raising learners’ awareness of their current knowledge levels and encouraging them to reflect on the learning process [6].
In comparison with OLM, social OLM (OSLM) have pushed the research area of AEHS towards fostering diversification of learner modelling, richer visualisation and interaction of learner models [2, 32], and accumulating a great set of theories and techniques to build a variety of e-learning environments with personalised, adaptive and social features. Recent studies, as visited below, mainly focus on visualising the learning progress and providing social navigation support based on learner models.
average progress of the entire learning group. However, the comparisons have limited-level granularity representation of learning contents. QuizMap [1] has a 4-level hierarchical representation of a tree-map, and each 4-level clusters different 4-level of information in detail (from entire class’s performance to individual’s performance on a single question). A learner can also observe her own performance in comparison with the rest of the class. However, QuizMap cannot fit larger classes that generate too many cells on the TreeMap, causing it to become too crowded (information overload). ProgressiveZoom [13] is built upon the Google-Maps paradigm, seeking to address information overload issues, by enabling learners to zoom in or out in a multi-layer fashion. However, it has limited ability to control comparisons between learners.
To address these limitations, we thus seamlessly integrated multifaceted OSLM at all granularity levels of learning contents, i.e., at course level, topic level, resource level, etc. This addresses the limited-level granularity learning content representations in IntrospectiveViews, and the concern of too crowded user interface or information overload in QuizMap. Moreover, a multifaceted OSLM allows a learner to compare to individuals and groups, unlike in Progressive Zoom. Additionally, unlike these systems, we build multifaceted OSLM with Facebook-like and popular game-like visualisation, which potentially makes features easier to use by now-a-day’s learners.
3 Topolor
Topolor is a social personalised adaptive e-learning environment. Its design refers to the connectivist learning theory [7], which argues that learning is process of creating networks of information, contacts and resources [30], and it is implemented based on requirement analysis studies [19]. The 1st version of Topolor [20, 27], launched in Nov 2012, was used as an online learning environment for MSc level students at two universities. It has been evaluated from various perspectives [21, 28, 29]. Based on prior evaluation results [22, 23, 25], the 2nd version Topolor has been developed. This is the environment in which we added and evaluated the proposed multifaceted OSLM. This section only presents those features related to multifaceted OLSM.
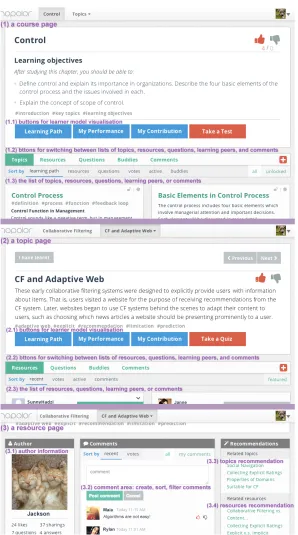
The backbone of Topolor is a hybrid network connecting learning contents and learners. Learning contents are organised in a classic course-topic-resource structure: a course consists of a set of tree-structured topics; a topic contains one or more resources, and could be shared by different courses. A learner can, e.g., register to a course, learn a topic, and share a resource. The multifaceted OLSM are seamlessly integrated at all granularity levels of learning contents beside learners’ profile pages.
Fig. 2. A profile page.
4 Multifaceted Open Social Learner Modelling
We call the OSLM in Topolor ‘multifaceted’, because, firstly, a learner can access her model and her peers’ models ubiquitously, and Topolor adapts the visualisations to fit various contexts, corresponding to the hierarchy course pages, topic pages, resource pages and profile pages. Additionally, it provides various visualisation modes, e.g., comparison between individuals, to all other learners, etc. These modes of multi-context and multi-cohort comparisons require enhancements of both adaptivity and adaptability, and are expected to further promote metacognitive activities. Unlike existing systems providing a single complex view of OSLM with many criteria to manually select in order to adjust visualisations, We propose to adapt appropriate views of visualisations automatically, to potentially improve the system’s usability; and to visualise both learners’ performance and contribution, reflecting learners’ roles as both knowledge consumers and producers; specific features are shown below.
4.1 Visualisation of performance
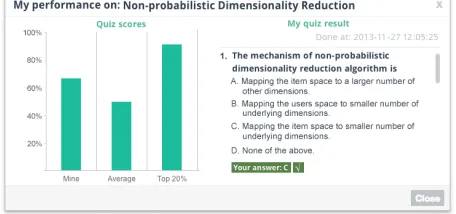
shows a radar chart and a column chart comparing activities (Fig 4). Fig. 5 illustrates the respective pop-up view of performance in a topic page, showing on the left the comparison of quiz scores, and on the right, the learner’s corrected quiz answers.
[image:6.595.181.413.334.417.2]Fig. 3. Pop-up view of performance at a course level, also displaying its 3 other alternate tabs.
Fig. 4. Part of the pop-up view of performance, corresponding to a course level tab in Fig. 3.
Fig. 5. Pop-up view of performance at a topic level.
4.2 Visualisation of contribution
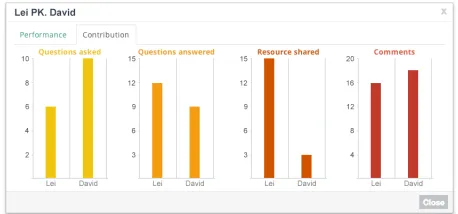
[image:6.595.184.412.441.548.2]Fig. 6 Pop-up view of contribution, compared to others.
4.3 The PK. mode
The PK. mode is designed drawing from educational gamification [26], as an acronym for ‘Player Killer’. On a profile page (Fig. 2), by clicking on the button ‘PK.’, a pop-up view shows, presenting comparisons of performance and contribution between a learner and the profile page’s owner (Fig. 7). Contributions are questions asked and answered, resources, comments shared. Performances include correct tests, topic completion rate, the number of shared (‘liked’ and bookmarked) resources.
Fig. 7. The PK. mode: one-to-one comparison of contribution of two learners.
4.4 Visualisation of learning path
[image:7.595.183.412.401.508.2]Fig. 8. Pop-up view of learning path.
4.5 Visualisation of activities
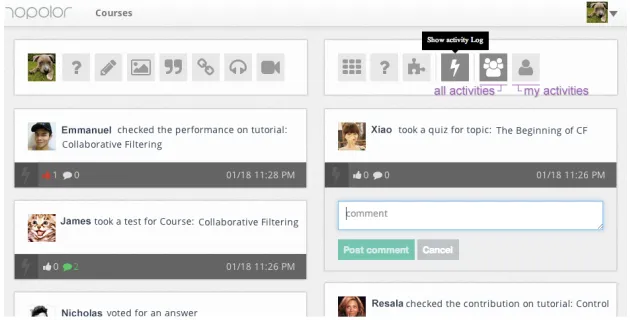
Topolor exposes learners’ activity logs to learners, and they can ‘like’ and comment on each other’s activity logs. This feature is designed based on our hypothesis that observation of activity logs of a learner and her peers’ can stimulate interactions, hereby improve the system’s engagement. There are two ways of viewing learners’ activity logs. One is on the Topolor home page, as shown in Fig. 9, where a learner can filter to view her own activity logs or to view all learners’ activity logs; the other is on a profile page (see Fig. 2) by clicking on the button ‘Activities’, where a learner can view the profile owner’s activity logs, to allow various paths to information.
Fig. 9. List of activity logs on the Topolor home page
5 Experimental Study
[image:8.595.140.455.392.552.2]5.1 Experiment and survey
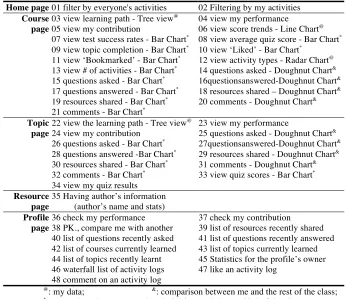
[image:9.595.124.471.378.677.2]The experiment involved 15 students registered for an MSc module ‘Dynamic Web-Based Systems’, at the University of Warwick, learning a lesson on ‘Collaborative Filtering’ using Topolor, and familiarizing themselves with the multifaceted OSLM features. The experiment was divided into four stages: two time-controlled one-hour learning stages (students sat in the same classroom), one not time-controlled learning stage (students accessed Topolor at their preferred time and location), and finally the survey stage (coordinator-led optional questionnaire answering, feature by feature, to make sure they knew clearly which question referred to which feature). Students were explicitly told that their participation in the survey had no impact on module results. Ten of them submitted questionnaires. The questionnaire contains 165 questions, each of which applies a 5-Likert scale from 1 (very useless / very hard to use) to 5 (very useful / very easy to use) to evaluate the selected feature’s usefulness and ease of use. Table 1 compresses only the 48 OSLM-related features, and with their visualisation modes; e.g., feature 13 visualises the comparison of the number of activities performed by a learner to the whole class, and the top 20% learners, as a bar chart.
Table 1. The evaluated multifaceted OSLM-related features.
Home page 01 filter by everyone's activities 02 Filtering by my activities Course
page
03 view learning path - Tree view@ 04 view my performance
05 view my contribution 06 view score trends - Line Chart@
07 view test success rates - Bar Chart* 08 view average quiz score - Bar Chart*
09 view topic completion - Bar Chart* 10 view ‘Liked’ - Bar Chart*
11 view ‘Bookmarked’ - Bar Chart* 12 view activity types - Radar Chart@
13 view # of activities - Bar Chart* 14 questions asked - Doughnut Chart&
15 questions asked - Bar Chart* 16questionsanswered-Doughnut Chart&
17 questions answered - Bar Chart* 18 resources shared – Doughnut Chart&
19 resources shared - Bar Chart* 20 comments - Doughnut Chart&
21 comments - Bar Chart*
Topic page
22 view the learning path - Tree view@ 23 view my performance
24 view my contribution 25 questions asked - Doughnut Chart&
26 questions asked - Bar Chart* 27questionsanswered-Doughnut Chart&
28 questions answered -Bar Chart* 29 resources shared - Doughnut Chart&
30 resources shared - Bar Chart* 31 comments - Doughnut Chart&
32 comments - Bar Chart* 33 view quiz scores - Bar Chart*
34 view my quiz results Resource
page
35 Having author’s information (author’s name and stats) Profile
page
36 check my performance 37 check my contribution
38 PK., compare me with another 39 list of resources recently shared 40 list of questions recently asked 41 list of questions recently answered 42 list of courses currently learned 43 list of topics currently learned 44 list of topics recently learnt 45 Statistics for the profile’s owner 46 waterfall list of activity logs 47 like an activity log
48 comment on an activity log
5.3 Results
[image:10.595.126.471.253.394.2]The blue (dark) columns in Fig. 10 present the responses for usefulness. The mean values rank between 3.6 and 4.7, with standard deviations between 0.422 and 0.994. All the reported values are larger than 3 (the neutral response), suggesting students’ attitudes to be generally positive. The yellow (light) columns in Fig. 10 present the responses for ease of use. The mean values rank between 4.0 and 4.7. The standard deviations are between 0.483 and 0.816. As all the mean values are greater than 3, we infer that most students found the multifaceted OSLM to be relatively easy to use.
Fig. 10. Mean value and standard deviation of responses for multifaceted OSLM features.
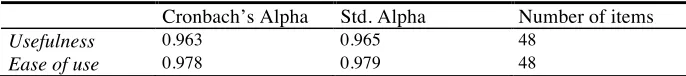
Cronbach’s alpha is adopted to measure the reliability of the test. A Cronbach’s Alpha of 0.8 is considered as highly reliable [4]. The values of Cronbach’s Alpha for the questions are shown in Table 2. Values for both usefulness and ease of use are considerably larger than 0.8, suggesting a high level of reliability of the results.
Table 2. Cronbach’s Alpha (Reliability Statistics)
Cronbach’s Alpha Std. Alpha Number of items
Usefulness 0.963 0.965 48
Ease of use 0.978 0.979 48
6 Conclusion and Future Work
[image:10.595.125.468.501.539.2]adapted to learning contents, so that its ubiquity and context-awareness could enhance any system's adaptivity and adaptability, which potentially improves usability.
We also reported on an experimental study and evaluation, which illustrates a generally high level of learner acceptance of our proposed multifaceted OSLM features. This result may appear possibly counter-intuitive, due to the high number of features introduced, which may seem complex to a learner. In fact, in our previous study [24], we have found that using a Facebook-like appearance, and a game-inspired paradigm, quickly transforms learners into system experts. The study limitation is the low number of participants, although Cronbach’s Alpha suggests a high level of reliability of the results. Moreover, Topolor has been opened to public (www.topolor.com), with larger learner cohorts expected in the near future, allowing for feedback, use data and suggestions collecting, in further studies. Other evaluation perspectives are on our agenda, e.g., if learners feel in control in interactions with multifaceted OSLM; if and how multifaceted OSLM leads learners to access recommended learning contents and to communicate with others, if and to what extent it promotes metacognition and makes Topolor more engaging.
Finally, we suggest new challenges for future work: (1) privacy management to allow learners to expose data to different groups in different ways; (2) metacognitive activity visualisation to promote self-reflection, self-direction and transparency; (3) visualisation-mode adaptation to provide personalised visualisation of the same data.
References
1. Brusilovsky, P. et al.: QuizMap: open social student modeling and adaptive navigation support with TreeMaps. Towards Ubiquitous Learning. pp. 71–82 (2011).
2. Bull, S., Gardner, P.: Highlighting learning across a degree with an independent open learner model. Proceedings of the 2009 Conference on Artificial Intelligence in Education. pp. 275–282 IOS Press, Amsterdam, The Netherlands (2009).
3. Bull, S., Kay, J.: Open learner models as drivers for metacognitive processes. International Handbook of Metacognition and Learning Technologies. pp. 349–365 (2013).
4. Carmines, E.G., Zeller, R.A.: Reliability and validity assessment. Sage (1979).
5. Davis, F.D.: Perceived usefulness, perceived ease of use, and user acceptance of information technology. MIS Q. 319–340 (1989).
6. Dimitrova, V.: STyLE-OLM: interactive open learner modelling. Int. J. Artif. Intell. Educ. 13, 1, 35–78 (2003).
7. Downes, S.: Connectivism and connective knowledge: essays on meaning and learning networks. National Research Council Canada (2012).
8. Hsiao, I-Han. et al.: Open social student modeling: visualizing student models with parallel IntrospectiveViews. User Modeling, Adaption and Personalization. pp. 171–182 (2011). 9. Kay, J.: Stereotypes, student models and scrutability. In: Gauthier, G. et al. (eds.) Intelligent
Tutoring Systems. pp. 19–30 Springer Berlin Heidelberg (2000).
10. Kop, R.: The challenges to connectivist learning on open online networks: Learning experiences during a massive open online course. Int. Rev. Res. Open Distance Learn. 12, 3, 19–38 (2011).
11. Kurilovas, E. et al.: Web 3.0–based personalisation of learning objects in virtual learning environments. Comput. Hum. Behav. 30, 654–662 (2014).
13. Liang, M. et al.: Collaborative e-learning through open social student modeling and Progressive Zoom navigation. Collaborative Computing: Networking, Applications and Worksharing, 2012 8th International Conference on. pp. 252–261 (2012).
14. Long, Y., Aleven, V.: Supporting students’ self-regulated learning with an open learner model in a linear equation tutor. Artificial Intelligence in Education. pp. 219–228 (2013). 15. Martínez, R. et al.: Who did what? who said That?: Collaid: an environment for capturing
traces of collaborative learning at thetabletop. Proceedings of the ACM International Conference on Interactive Tabletops and Surfaces. pp. 172–181 ACM, NY, USA (2011). 16. Mazza, R., Dimitrova, V.: CourseVis: A graphical student monitoring tool for supporting
instructors in web-based distance courses. International Journal of Human-Computer Studies. 65, 2, 125–139 (2007).
17. Mohanarajah, S. et al.: Opening a fuzzy learner model. Proceedings of Workshop on Learner Modelling for Reflection. In: International Conference on Artificial Intelligence in Education. pp. 62–71 (2005).
18. Shi, L. et al.: A social personalized adaptive e-learning environment: a case study in Topolor. IADIS Int. J. WWWInternet. 11, 2, (2013).
19. Shi, L. et al.: Apply the We! Design methodology in E-learning 2.0 system design: a pilot study. 2012 Imperial College Computing Student Workshop. pp. 123–128 (2012).
20. Shi, L. et al.: Designing social personalized adaptive e-Learning. Proceedings of the 18th ACM Conference on Innovation and Technology in Computer Science Education. pp. 341– 341 ACM, New York, NY, USA (2013).
21. Shi, L. et al.: Evaluating system functionality in social personalized adaptive e-Learning systems. Scaling up Learning for Sustained Impact. pp. 633–634 (2013).
22. Shi, L. et al.: Evaluation of social interaction features in Topolor - a social personalized adaptive e-Learning system. Proceedings of the 13th IEEE International Conference on Advanced Learning Technologies. pp. 15–18 (2013).
23. Shi, L. et al.: Evaluation of social personalized adaptive e-Learning environments: From end user point of view. Proceedings of the 3th Imperial College Computing Student Workshop. pp. 101–108 (2013).
24. Shi, L. et al.: Social e-learning in topolor: a case study. Proceedings of the 7th IADIS Conference e-Learning. pp. 57–64 IADIS Press, Prague, Czech Republic (2013).
25. Shi, L. et al.: Social personalized adaptive e-Learning environment: Topolor - implementation and evaluation. In: Lane, H.C. et al. (eds.) Artificial Intelligence in Education. pp. 708–711 Springer Berlin Heidelberg (2013).
26. Shi, L. et al.: To build light gamification upon social interactions: requirement analysis for the next version of Topolor. Proceedings of the 6th York Doctoral Symposium on Computer Science and Electronics. (2013).
27. Shi, L. et al.: Topolor: a social personalized adaptive e-learning system. User Modeling, Adaptation, and Personalization. pp. 338–340 Springer (2013).
28. Shi, L. et al.: Towards understanding learning behavior patterns in social adaptive personalized e-Learning systems. Proceedings of the 19th Americas Conference on Information Systems. pp. 1-10 (2013).
29. Shi, L., Cristea, A.I.: Investigating the impact of social interactions in adaptive E-Learning by learning behaviour analysis. Proceedings of Sixth York Doctoral Symposium on Computer Science and Electronics. (2013).
30. Siemens, G.: What is the unique idea in Connectivism. Connectivism Blog - Http://connectivism.ca/cgi-bin/mt/mt-tb/cgi/112 (2008).
31. Tschofen, C., Mackness, J.: Connectivism and dimensions of individual experience. Int. Rev. Res. Open Distance Learn. 13, 1, 124–143 (2012).