Determination of New Student Networking Promotion Media
Using AHP and Topsis (Case Study: High School of Science
of Al-KhairiyahCilegon Computer)
Fenny Fadilah*, Samudera Dipa Legawa**, Efi Rohman***
* (Computer Science, Budi Luhur University, and Jakarta Email: [email protected])
**(Computer Science, Budi Luhur University, and Jakarta Email: [email protected])
*** (Computer Science, Budi Luhur University, and Jakarta Email: [email protected])
---
************************
---Abstract:
Every university promotes new prospective students, one of the effects of promotionalactivities to run effectively and efficiently is the selection of the right media promotion. This study aims to conduct decision-making analysis using the AHP (Analytical Hierarchy Process) method and TOPSIS (Technique for Order Preference by Symbolity to Ideal Solution) to determine the priority of promotional media. The AHP (Analytical Hierarchy Process) method is used to determine the criteria weight, while the TOPSIS (Technique for Order Preference by Similarity to Ideal Solution) is used to rank alternative promotional media. The criteria used in prioritizing college promotion media are Reach, Durability and Cost. The weight of the criteria produced from the AHP method is the input value in the TOPSIS method to sort the alternative promotional media chosen.The results of testing the system acceptance with 4 (four) aspects of the test, obtained the Perception of Ease results of 91.43%, Usability Perception of 86.86%, Attitude Towards Use 87.90%, and the Value of Using the System of 81.90%. So overall the average value of testing with the TAM method is 86.66% and overall the quality of the system is running well.
Keywords —Promotional Media, University, AHP,TOPSIS.
---
************************
---I. INTRODUCTION
The impact of globalization which has an impact on the world of education and higher education in Indonesia is a symptom that is getting stronger and is not unstoppable again. Every new school year, PTS always competes with PTN and other PTS in fighting over the number of students. In order to survive, each PTS must understand what are the considerations or attractiveness of prospective new students choosing a particular university, and this uniqueness can also be used as a competitive advantage.
College marketing activities are certainly different from business organizations. The difference is certainly caused by different goals, scale, and customers. The tight competition requires every university to be able to face and win it by implementing marketing strategies appropriately. To keep the image of a university always good, the manager must be able to implement various marketing strategies, including choosing promotional media.
The most important parameter is the characteristics of the target market, both geographically, demographically and socio graphically. By understanding our target market,
IJCT
then we can determine which media is the most appropriate for promotion. Expenditures on promotion costs are followed by an expectation that these efforts will lead to efforts to introduce universities and their study programs as well as those contained therein.
The number of promotional media available today makes the management of Al-Khairiyah College of Sciences having difficulty choosing effective promotion media. Each promotional media has advantages and disadvantages, so to determine the media promotion needed a good information system, so that the selection of promotional media in accordance with expectations. To choose promotional media, Al-Khairiyah's College of Computer Science Technology must consider the cost of making, the scope of the spread of promotional media, and the durability of the promotional media. The AHP and TOPSIS method, a scientific method proposed by Thomas L. Saaty, is a quantitative method for ranking various alternatives and choosing the best one based on specified criteria. By knowing the influential factors, it is hoped that effective promotion media can be determined with low cost and a fairly wide range of spreads and have long durability[1].
The promotion is expected to increase the number of students, so that the sustainability of the academic process at the AL-Khairiyah Computer Science College can be maintained. With the increasing number of students, in addition to improving the academic atmosphere, it will also affect the welfare of the managers involved in it.
II.METHODOLOGY
The research methodology used in this research is the quantitative method. Research can be understood as a dialogue that occurs continuously between two types of reality, namely agreement reality and experimental reality. Research is an attempt to connect empirical reality and theory. This is because quantitative research is done not in order to test theories or hypotheses, but to find them.
Determination of media promotion of new student selection by using AHP and Topsis will serve as a means to speed up decision making in the management environment of Al-Khairiyah Computer Science College. The process of
collecting data about the importance of the factors that influence in terms of determining media promotion by distributing questionnaires.
1. Analytical Hierarchy Process (AHP)
Analytic Hierarchy Process (AHP) was developed by Prof. Thomas Lorie Saaty of the Harvard Business School in the early 1970s, used to find the ranking or priority order of various alternatives in solving a problem. In everyday life, a person is always faced with making choices from various alternatives. Here, it is necessary to determine priorities and test the consistency of the choices that have been made. One of the strengths of AHP lies in the pairing comparison matrix and conducting a consistency check analysis.
There are some basic principles that must be understood include:
1. Decomposition (create a hierarchy)
The process of analyzing the real problems in the hierarchical structure of the supporting elements, namely the supporting elements, arranging the elements in a hierarchical manner, and combining them or synthesising them.
2. Comparative judgment (evaluation of criteria and alternatives)
IJCT
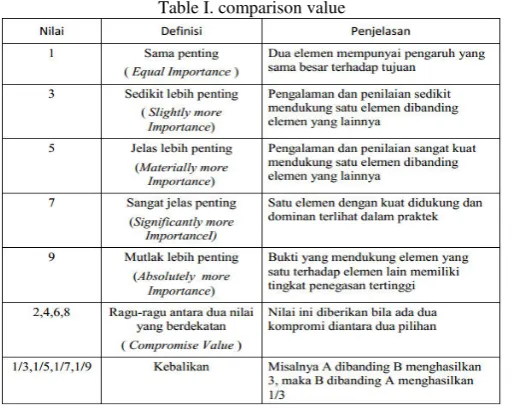
Table I. comparison value
Various types of comparative methods for parameterizing are already widely used by model researchers. One of them is the Analytic Hierarchy Process (AHP). In fact, the use of AHP is not only limited to the parameterization needs, but also the decision making process by using multiple criteria (more than one decision making criteria). Analytic Hierarchy Process (AHP) is a concept for multic Criteria based decision making (multiple criteria). AHP becomeseffective methods for handling complex decision making, and can help decision makers set priorities to support the best decisions.
AHP is a decision support model developed by Thomas L. Saaty. This decision support model will describe a complex multi-factor or multi-criteria problem into a hierarchy according to [1].
AHP is often used as a method of solving problems compared to other methods for the following reasons[2]:
1. The hierarchical structure, as a consequence of the selected criteria, reaches the deepest sub-criteria.
2. Calculates the validity up to the tolerance limit of inconsistencies of various criteria and alternatives chosen by decision makers.
3. Take into account the durability of the decision making sensitivity analysis output.
In general, the Analytic Hierarchy Process (AHP) model can be seen in Figure II-2 as follows. In the picture, it can be seen that the hierarchy process starts from the goal or goal to be achieved, then sets some criteria to achieve that goal so that an
alternative is possible from the results of the analysis of various criteria.
Fig 1. Three Level Hierarchy
2. Technique For Others Preference by
Similarity to Ideal Solution (TOPSIS)
The TOPSIS method is one of the decision making methods multicriteia, which was first introduced by Yoon and Hwang in 1981. This method is one of the most widely used methods for completing practical decision making. TOPSIS has a concept where the alternative chosen is the best alternative that has the shortest distance from a positive ideal solution and the farthest distance from a negative ideal solution. More and more the many factors that must be considered in the decision making process, the more difficult it is also to make decisions from an issue.
TOPSIS is a multi-attribute decision making technique that is widely accepted because of its logic, simultaneously considering ideal and anti-ideal solutions, and calculation procedures that are easy to program. This technique is based on the concept that the alternative is ideal has the best level for all attributes, while the negative ideal is one that has all the worst attribute values. The TOPSIS principle is that the chosen plan must be as close as possible to the positive ideal solution and as far as possible from the negative ideal solution. TOPSIS will rank alternatives based on the priority value of the relative proximity of an alternative to a positive ideal solution.
The alternatives that have been ranked are then used as a reference for decision makers to choose the best solution desired. This method is widely used to solve practical decision making.
IJCT
ability to measure the relative performance of decision alternatives [3].
a. Strengths of the TOPSIS Method:
1. The concept is simple and easy to understand, simplicity is seen from the flow of the TOPSIS method which is not so complicated. Because it uses indicator indicators and alternative variables as helpers to make decisions.
2. Computation is efficient, computation calculation is more efficient and fast.
3. Can be used as a measure of alternative performance and alternative decisions in a simple form of computational output.
4. Can be used because of a faster decision making method.
b. The weakness of the TOPSIS method
1. There is no determination of priority priorities calculation of criteria, which is useful to increase the validity of the weight of the criteria calculation. So for this reason, this method can be combined for example with the AHP agar method produce maximum results or decisions
2. There is no linguistic form for alternative assessment of criteria, its basic form is interpreted in a linguistic fuzzy number 3. There is no mediator such as a hierarchy if it
is processed independently then the accuracy of decision making tends not yet produce the perfect decision.
3. Study Overview
1) Method AHP is used because it is very good for ranking with certain criteria. Whereas TOPSIS has the ability to find ideal solutions to solve problems. AHP and TOPSIS methods are combined in the first and second stages of the selection process. The decision support system that was built was then evaluated with a User Acceptance Test and implemented to help determine the location of new student promotion promotions [4].
2) AHP (Analytical Hierarchy Method) is Process used to determine the weighting of criteria, while TOPSIS (Technique for Order Preference by Similarity to Ideal Solution) is used to
determine the alternative ranking of promotional media. The criteria used in determining the priority of college promotion media are funding, reach, level of influence, target achievement and completeness of information. Criteria weights generated from the AHP method become the input values in the method TOPSIS to sort the selected promotional media alternatives. The aim of this research is to produce a priority order of promotional media that can be recommended for use in college promotion activities [5]. 3) From the results of the study show the use of
Analytical Hierarchy Process (AHP) as a decision support system model for determining the media for promotion of new student admissions at Serang Raya University can help the work of the promotion team and leadership in determining the priorities of the most appropriate promotional media for the promotion through a process of weighting criteria and alternatives more quickly, careful and more effective [6].
4) Combination of the ANP Method and TOPSIS in determining Higher Education Media Priorities. The decision support system developed in this study uses the ANP (Analytical Network Process) and TOPSIS (Technique for Order Preference by Similarity to Ideal Solution) methods. The ANP method is used to determine the criteria weights by taking into account the effect of interdependence between the criteria, while the TOPSIS is used to determine the ranking alternative media promotion. The results of this study are a system used to determine the priority of promotional media based on predetermined criteria. The test results show that the system is able to give priority order of media promotion as a material consideration in conducting college promotion [7].
4. Sample Selection Method
IJCT
purposive means intentionally. So, purposive sampling means deliberate sampling technique.
The sample used in this study was Active Students from Al-Khairiyah Computer Science College. From this sample technique it is hoped that it will be able to provide comprehensive input and illustrate the Promotion Media. The following is data from selected selected respondents, namely active students of Al-Khairiyah Computer Science College:
Figure 2. List of Student Respondents
Figure 3. Promotion Media Selection Sample Data
Sample data to be used in this research at the Al-KhairiyaCilegon Computer Science High School are 320 Active Students. The data was obtained from the Al-Khairiyah Computer Science College in Cilegon.
Here is a picture of the hierarchical structure of the Determination of Media Promotion for New Student Selection:
Figure 4. Promotion Media Promotion Hierarchy
5. Technology Acceptance Model (TAM)
The TAM model, developed from psychological theories, explains the behavior of computer users that is based on beliefs, attitudes, desires, and user behavior relationships. The purpose of this model is to explain the main factors of user behavior towards user acceptance of technology. In more detail it explains about the acceptance of IT with certain dimensions that can beaffect the acceptance of IT by users (users) (Wibowo, 2008).
Fig 5. Technology Acceptance Model
This model puts the attitude factor of each user's behavior with two variables, namely:
1. ease of use (ease of use) 2. usefulness (usefulness).
This study uses 5 (five) constructs that have been modified from the previous TAM research model, namely:
Perceived Ease of Use, Perceived Usefulness, Attitude Toward Using, Behavioral Intention To Use, and Actual System Usage.
1. Perceived Ease of Use (PEOU)
The perception of ease of use of a technology is defined as a measure by which a person believes that computers can be easily understood and used. Some indicators of the ease of use of information technology, including:
a. Computers are very easy to learn.
b. Computers do easily what the user wants c. Computers are very easy to improve user skills.
d. The computer is very easy to operate. 2. Perceived Usefulness (PU)
Perception of usefulness is defined as a measure where the use of a technology is believed to bring benefits to those who use it. Dimensions about the benefits of information technology include:
IJCT
b. Effectiveness, including dimensions: enhance effectiveness, develop work performance.
3. Attitude Toward Using (ATU)
Attitude Toward Using in TAM is conceptualized as an attitude towards the use of a system in the form of acceptance or rejection as an impact if someone uses a technology in their work.
4. Behavioral Intention to Use (ITU)
Behavioral Intention to Use is the tendency of behavior to keep using a technology. The level of use of a computer technology in someone can be predicted from the attitude of attention to the technology, for example the desire to add supporting peripherals, motivation to keep using, and the desire to motivate other users. 5. Actual System Usage (ASU)
Actual System Usage is the real condition of system usage. Conceptualized in the form of measurements of the frequency and duration of time of technology use. Someone will be satisfied using the system if they believe that the system is easy to use and will increase their productivity, which is reflected in the real conditions of use.
6. Model Testing Techniques
In this study two testing techniques were used, namely:
1. AHP Method Testing The results of the calculation of the determination of the best participants using the AHP method were tested again for their Consistency Ratio (CR). The level of consistency is important to note because we do not want decisions based on considerations with low consistency. By following the AHP calculation steps. Then the Consistency Ratio is recalculated if the value is more than 100%, then the judgment judgment data must be improved but if the Consistency Ratio is less than or equal to 0.1, then the calculation results can be declared correct. 2. Testing Application Determination of
Promotion Media is tested using Black Box Testing so that it can be known whether the system built is correct in accordance with what is needed, Black Box Testing is testing the
fundamental aspects of the system without regard to the internal logic structure of the software. This method is used to find out whether the software is functioning properly.
III. RESULT AND DISCUSSION
1. Research Instrumentation
In this study, the instrumentation used was for data collection :
1. Data and information obtained in determining the results of the analysisThe determination of promotion media is carried out with the approval of the Chairman of the AL-Kahiriyah Cilegon Computer Science College. 2 Questionnaire as data complementary data and
information for designing Media Promotion decision support systems.
3. Literature about the basic concepts of the Analitical Hierarchy Process (AHP) method and Technique Order Performance by Similarity (TOPSIS).
4. Software or applications used in SPK research using AHP and TOPSIS methods use applicationsdesktop based programming, namely Borland Delphi 7.0
5. Application for the process of storing basic data for the analysis of decision support systems using MySQL databases.
2. Analytical Hierarchy Process (AHP) Analysis
Technique
There are three main principles in problem solving in AHP(Analytical Hierarchy Process), namely: Decomposition, Comparative Judgmentand logical consistency. Broadly speaking, the AHP (Analytical Hierarchy procedure).
Process) includes the following stages: a. Decomposition of the problem;
b. Rating / weighting to compare elements; c. Matrix preparation and consistency test; d. Setting priorities in each hierarchy; e. Synthesis of priorities; and
f. Decision making / decision making.
3. Technical Analysis of the TOPSIS Method
IJCT
solutions, and calculation procedures that are easily programmed. This technique is based on the concept that an ideal alternative has the best level for all attributes, while a negative ideal is one that has all the worst attribute values. The calculation steps on the TOPSIS method are as follows:
a. Determine the participant value matrix. b. Make a normalized decision matrix.
c. Make a normalized weighted decision matrix. d. Prioritize positive ideal solutions and negative
ideal solutions.
e. Determine the distance between the value of each alternative with a positive ideal solution and a negative ideal solution.
f. Determine the preference value for each alternative.
4. Calculation of the weight of the Media
Promotion Determination Criteria using the AHP Method
AHP calculation process is carried out to get the weight valuethe priority of the criteria that exist in determining the promotion media, in this case what will be described is the criteria of determining the promotion media. The following are the steps taken in carrying out the AHP calculation process.
1) Calculate the criteria weights for the promotion media, as follows:
In conducting assessments / comparisons, experts developAHP uses a scale from 1/9 to 9. If choices A and B are considered to be the same (indifferent), then A and B are each given a value of 1. If for example A is better / preferred than B, then A is given a value of 3 and B is given 1/3. If A is much preferred by B, then A, for example, is given a value of 7 and B is given a value of 1/7. The result of weighting the criteria above is a matrix of magnitude n x n, where n is the number of criteria.
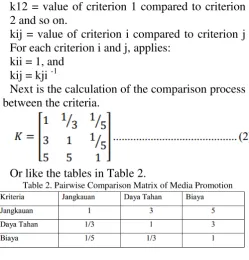
The resulting matrix
Where;
k11 = value of criterion 1 compared to criterion 1
k12 = value of criterion 1 compared to criterion 2 and so on.
kij = value of criterion i compared to criterion j For each criterion i and j, applies:
kii = 1, and kij = kji -1
Next is the calculation of the comparison process between the criteria.
Or like the tables in Table 2.
Table 2. Pairwise Comparison Matrix of Media Promotion
2) Next change the fraction matrix into a matrix into decimal numbers as shown in table 3.
Table 3. Matrix Decimal Number Media Promotion Criteria
3) Next, normalize and add up the pairwise comparison matrix calculated from table IV-3 as shown in table 4.
Table 4. Normalization Matrix Comparison of Promotion Media
Reachable rows obtained = [1.0000 * 1.5333], [3.0000 * 4.3333],[5,0000 * 9,0000]
Endurance lines obtained = [0.3333 * 1.5333], [1.0000 * 4.3333],[3.0000 * 9.0000]
Cost lines obtained = [0.2222 * 1.53333], [0.3333 * 4.3333],[1.0000 * 9.0000]
IJCT
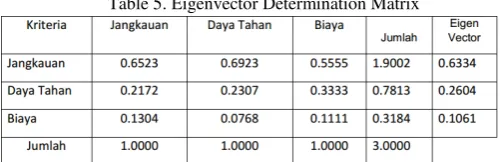
Table 5. Eigenvector Determination Matrix
Vector Eigenvalue is calculated from the number of columns divided by the total number of columns.
Reach obtained = [1.9002 / 3.0000] = 0.6334
Endurance obtained = [0.7813 / 3.0000] = 0.2604
Costs obtained = [0.3184 / 3.0000] = 0.1061 The Eigen Vector values obtained are:
5. Testing the Analytical Hierarchy Process
(AHP) method
To get a good solution, it requires deep consistencycharging the weighting criteria. For example, if aij represents the degree of importance of criterion i against criterion k and it represents the importance of criterion j with criterion k, then it should be aik = aij.ajk so that the resulting matrix is consistent.
The problem is in our daily lives we cannot impose consistent values, for example comparing that oranges are 2 times sweeter than guava, while grapes are 2 times sweeter than oranges. But in reality we find that wine is only 3 times sweeter than guava, when it should:
a orange grapefruit = a grapefruit grapefruit
a orange wine = 2. 2
a orange wine = 4
Sweet grapes = 4 times sweet guava
Therefore Saaty defines a consistency ratio (CR) to provide a consistent tolerance criteria matrix. A matrix is considered consistent if the CR value <0.1 or inconsistencies are allowed only 10%.
To calculate the inconsistent limit of a matrix, the Consistency Ratio can be calculated using the following formula:
where RI is a random index whose magnitude differs accordingly
with the order. Saaty determines the random index of an order matrix according to the following table:
Table 6. Matriks Value Random Index (Oarkridge Laboratory)
Where :
CI = consistency index
λ max = the largest eigenvalue of the order matrix n, obtained by adding up the product of the number of columns for each criterion with the main eigenvector value, according to the following equation:
Where :
Ki = the sum of all the criteria in column i of the K matrix (the result of weighting criteria criteria) Ni = eigenvector value of the criteria matrix in line i
1) Multiplying the decimal numbers of each criteria matrix byeigenvector
2) Calculate the consistency vector by determining the average value of the Weighted Sum Vector
1,9451: 0.6334 = 3.0709 0.2604: 0.7896 = 3.0332 0.1061: 0.3194 = 3.0121
3) Calculate the average value of the Vector Consistency is
IJCT
5) Calculating the consistency ratio, the RI value is needed, namely the Random Index obtained from the Oarkridge table (CR = CI / RI). For n = 3, the RI value is 0.58. So the CR value for the Media Promotion criteria is 0.0189 / 0.58 = 0.0326. Comparative ratings are said to be consistent if the CR is not more than 0.10. So that the comparison of the best participant criteria is consistent and does not require revision of the assessment.
6. Determine Media Promotion Priorities with
TOPSIS
In the AHP Method calculation process, the consistency value (CR) is obtainedconsistency, then the calculation is done using the TOPSIS method to determine the priority of promotional media. Alternative media promotions in this study are Brochure (A1), Member Get Member (A2), Website (A3), Banner (A4), Roadshow (A5), Newspaper (A6).
1) Alternative data of people / objects to be assessed. Alternative data as shown in table 7.
Table 7. Promotion Media Matrix
2) Criteria data as a basis for evaluating alternatives. Criteria can be either cost or benefit. Benefit means the greater the value the better, on the contrary the smaller the value is the value. there is an additional attribute which is the criteria weight. This weight is to determine which criteria is preferred. The
greater the weight, the more preferred the criteria the better as shown in table 8.
Table8. Criteria Weights Matrix
3) Alternative values are used to provide an assessment ofalternative to each criterion. For easier usuallydisplayed in tabular form (matrix) with alternatives asrow headings, and criteria as column headings. Every alternative musthas values on all criteria even though the value is 0 (zero) likeshown in table 9.
Table9. Criteria Weights Matrix
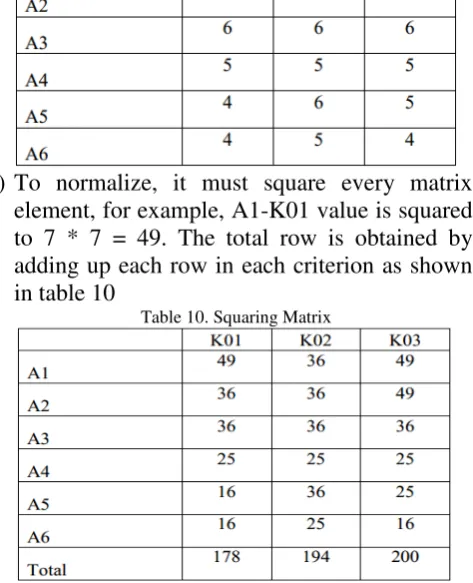
4) To normalize, it must square every matrix element, for example, A1-K01 value is squared to 7 * 7 = 49. The total row is obtained by adding up each row in each criterion as shown in table 10
Table 10. Squaring Matrix
After getting the total, all you have to do is normalize by dividing each element of the 10 matrix table with the root (sqrt) of the total corresponding rows, the results are as follows:
IJCT
For example the first line (A1-K01) is obtained from = 7 / SQRT (178) = 0.52467.
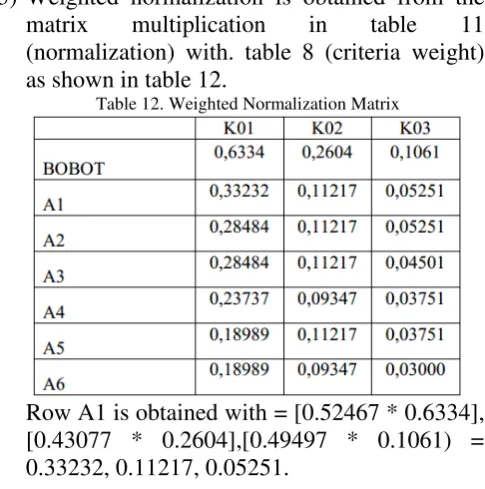
5) Weighted normalization is obtained from the matrix multiplication in table 11 (normalization) with. table 8 (criteria weight) as shown in table 12.
Table 12. Weighted Normalization Matrix
Row A1 is obtained with = [0.52467 * 0.6334], [0.43077 * 0.2604],[0.49497 * 0.1061) = 0.33232, 0.11217, 0.05251.
6) Prioritize positive ideal solutions and negative ideal solutions. The ideal Sulusi matrix is obtained based on weighted normalization and attribute criteria (cost or benefit). The positive ideal solution is to take
the maximum value from weighted
normalization if the benefit criterion attributes, if the cost is taken the minimum value. Instead the positive ideal solution is taken the minimum value of normalized weighted if the attribute benefit criteria, if the cost is takenthe maximum is as shown in table 13.
Table 13. Matrix of Ideal Solutions and Negative Ideal Solutions
7) Determine the distance between the values of each alternative and the ideal solutionpositive and negative ideal solutions. To find totals and rankings,we must find the distance of the ideal positive and negative solutions obtainedfrom processing table 12 (weighted normalization) and table 13(ideal solution matrix). The trick is to square each differencenormalized matrix elements are weighted with an ideal solution matrix,then add up each alternative, after that it is rooted. Table 14. Matrix of Ideal Solutions and Preferences.
Table 15. Matrix of Ideal Solutions and Preferences
From the above values it can be concluded that alternative A1 has the most optimal value compared to other alternatives. Therefore, a decision can be taken that A1 (Brochure) chosen as the best Media Promotion.
7. Design Application Determination of
Promotion Media
The Media Promotion application screen design consists of 11 (eleven) screen designs but the author will only explain 5 system designs. Following is the screen design of the application that will be made:
1. Login Design
IJCT
Fig 6 Login System
2. This screen design is used to display the Sub Menu File containing the master data sub menu, AHP analysis, and TOPSIS analysis of the Al-Khairiyah Cilegon College of Computer Science Promotion application, as shown in figure 7:
Fig 7. File Menu
3. AHP Calculation Analysis Design
This design is used to process the calculation of criteriausing the AHP method in the Media Promotion application where the user will click the Process button, as shown in figure 8
Fig 8. AHP Calculation Analysis Screen Design
4. Design Analysis of TOPSIS Calculation
This screen design is used to process student rankingusing the TOPSIS method in the scholarship SPK application where the user will click the Process button, as shown in figure 9.
Fig9. TOPSIS Calculation Analysis Screen Design
5. Decision Screen Design
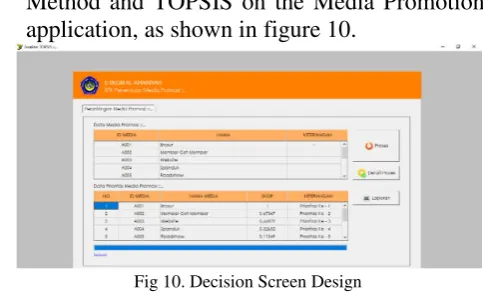
This screen design is used to process the Results displayDecisions are based on the AHP Method and TOPSIS on the Media Promotion application, as shown in figure 10.
Fig 10. Decision Screen Design
IV. CONCLUSIONS
The results achieved from this research are able to design and build a system of Determination of the Best Promotion Media that has been determined by using the AHP and TOPSIS methods to obtain solutions that are close to expectations:
1. AHP calculation calculates consistency Ratio, it takes the value of RI which is the Random Index obtained from the Oarkridge table (CR = CI / RI). For n = 4, the RI value is 0.58. So the CR value for the best participant criteria is 0.0189 / 0.58 = 0.0326. Comparative ratings are said to be consistent if the CR is not more than 0.10. So that the comparison of the best participant criteria is consistent and does not require revision of the assessment.
2. The TOPSIS calculation results in an alternative A1 (Brochure) having the most optimal value compared to other alternatives. Therefore, a decision can be made that A1 (Brochure) is chosen as a Media Promotion.
3. The results of testing the system acceptance with 4 (four) aspects of the test, obtained the Perception of Ease results of 91.43%, Usability Perception of 86.86%, Attitude Towards Use 87.90%, and the Value of Using the System of 81.90%. So overall the average value of testing with the TAM method is 86.66% and overall the quality of the system is running well.
ACKNOWLEDGMENT
IJCT
journal our lectures and also we are Fenny Fadilah,Samudera Dipa Legawa and Efi Rohman.
REFERENCES
[1] F. Alfiah, B. W. Pandhito, A. T. Sunarni, D. Muharam, and R. Matusin, “Data Mining Systems to Determine Sales Trends and Quantity Forecast Using Association Rule and CRISP-DM Method Abstract :,” vol. 4, no. 1, pp. 186–192, 2018.
[2] Saaty, T. L. 2012, Decision Making for Leaders: The Analytic Hierarchy Process for Decisions.
[3] Brunelly, M. 2015, Introduction to the Analytic Hierarchy Process. Finland: Springer.
[4] S. I. Made A, B. danWardoyo, R. 2017, SistemPendukungKeputusanKelompokPenentuanKaryawanTerba ikMenggunakanMetodeTopsisdanBorda. IJCCS, Vol.11, No.2, July 2017, pp. 165~176.
[5] Michael Rusli, SatriaPerdanaArifin, AnggiTrisnadoli(2017), PengembanganSistemPendukungKeputusanUntukPenentuanLok asiPromosiPenerimaanMahasiswaBaruMenggunakan AHP danTopsisJurnalKomputer TerapanVol.3 No.1 Mei 2017. [6] YustianServanda, Kusrini,AnalisisPenentuan Media
PromosiPerguruanTinggiMenggunakanKombinasi AHP danTopsis. MetikJurnalVol .02 2018 ISSN: 2580 – 1503. [7] SuhuddanSolehDwiyanto,AnalisisPendukungKeputusan Media
PromosiPenerimaanMahasiswaBaruUniversitasSerang Raya MenggunakanMetode AHP. Jurnal PROSISKO Vol.1 September 2014 ISSN:2406-7733