Journal of Pharmaceutical Technology, Research and Management Volume 1, No. 2, November 2013 pp. 191–203
©2013 by Chitkara University. All Rights Reserved.
DOI: 10.15415/jptrm.2013.12012
Analytical Method Development and Validation
for Assay of Rufinamide Drug
JitenDeR Singh1*, SoniA SAngwAn1, PARul gRoVeR1,
loVekeSh MehtA1, DeePikA kiRAn1 and AnJu goyAl2
1Lord Shiva College of Pharmacy, Sirsa, Haryana, India
2Chitkara College of Pharmacy, Chandigarh-Patiala National Highway, Rajpura, Patiala, Punjab, India
e-mail: [email protected]
Abstract A simple, rapid, sensitive, cost effective and reproducible reverse
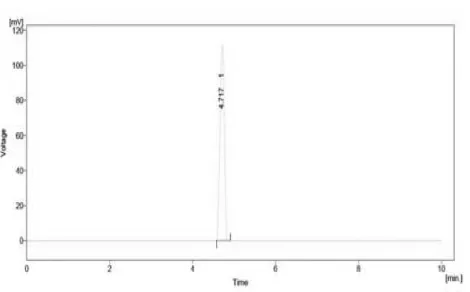
phase high performance liquid chromatographic (RP-HPLC) method was developed and validated for the stability testing of rufinamide. The proposed RP-HPLC method was developed on phenome-nex LunaR C-18 5µm ,250 mm × 4.6 mm id. Column (at ambient temperature) and mobile phase consisting of phosphate buffer: acetonitrile (60:40) was delivered at a flow rate 1.0ml/ min. The analyte was detected by using UV detector at the wavelength of 293 nm. The method was found to be linear over the concentration range of 50-150 µgml-1 (r2=0.999). 30. The retention time of rufinamide was 4.717 min.
keywords: RP-HPLC, Rufinamide, API, Method Validation
1. intRoDuCtion
S
tability testing forms an important part in the process of drug product development. Active pharmaceutical ingredient (API) is the important part of drug formulation and drug degrades with time so there is a need to develop methods which can detect degradation as well as degraded products (Chafez, L., 1971 and Sethi, P.D., 2001). The purpose of stability testing is to provide evidence on how the quality of drug substance varies with time under the influence of variety of environmental factors such as temperature, humidity and light which enables recommendation of storage conditions, retest periods and shelf life.1.1 Drug Profile (Rufinamide)
Description: (1-[(2, 6-difluorophenyl)methyl]triazole-4-carboxamide)
Singh, J. Sangwan, S. Grover, P. Mehta, L. Kiran, D.
Goyal, A. Figure: Rufinamide structure
Physiochemical properties Rufinamide
Parameter Values
Molecular Weight 238.19
Physical state White crystalline powder
Melting point 237 - 2400 C
Solubility in Water Very low Soluble in water and soluble in THF and methanol
Stability Stable under ordinary conditions.
Assay 98.5%
Residue on Ignition 0.15% max
Loss on Drying 9.5-12.5% max
Optical Rotation -0.820 Heavy Metal ≥ 20 ppm
Category Anti-epileptic Drug
State Solid
Half Life 6-10 hours
1.2 Method Development
Analytical Method Development and Validation for Assay of Rufinamide Drug
2. eXPeRiMentAl woRk
2.1 Materials
2.1.1 Instruments
The HPLC system consisted of HPLC 10AT-VP (Shimdadzu corporation ltd., Kyoto, Japan), manual injector port with 20 µL fixed loop (Rheodyme USA), UV detector SPD-20A (Shimadzu Corporation Ltd., Kyoto, Japan) and LC-20 AT (Prominenceseries) pumps were used. Separation was carried out on phenomenax C18, column (250 mm × 4.6 mm, 5 µm) Japan. Detector output was quantified on Spinchrom CFR chromatography software. Mettler-Toledo International Inc. Greifensee (Switzerland) microbalance was used for the purpose of weighing, and spinix vortex was used for the mixing. Samples were injected into HPLC system using Hamilton micro syringe.
2.2 Chemicals and Reagents
A gift sample of pure rufinamide was supplied from Varda Biotech pvt. Limited, Mumbai. Acetonitrile, water, methanol, potassium dihydrogen phosphate and triethylamine were procured from M/S Qualigens Fine Chemicals, Mumbai.
2.3 Methods
2.3.1 Selection of wavelength
10 ppm of drug solution was prepared by dissolving 100 mg of drug in small amount of methanol and volume was adjusted to 100 mL; after that 1 ml of above solution was diluted to 100 mL with methanol to get final concentration of 10 ppm. The solution was scanned in the U.V range of 200 nm to 400 nm (Green, J.M., 1996).
2.3.2 Preparation of Mobile Phase
For the analysis of rufinamide the aqueous system selected was phosphate buffer. Dissolved 6.08 Gm of potassium dihydrogen phosphate in sufficient water to produce 1000mL. pH was adjusted with glacial acetic acid using pH meter. After that buffer was mixed and sonicated with organic solvent i.e. acetonitrile in the ratio of 60 : 40 (Taylor and Francis, 2007).
2.3.3 Preparation of Calibration Curve
Stock solution (50 µgmL-1) of rufinamide was prepared by dissolving in mobile
Singh, J. Sangwan, S. Grover, P. Mehta, L. Kiran, D. Goyal, A.
to give the series of standard dilution for preparation of calibration curve (Taylor and Francis., 2007). The different concentration of sample solution (12.5, 25, 50, 62.5, 75, 100 µgml-1) was injected in the concentration range of
50% - 150% of drug substanceand the Calibration Curve results are presented in Table 1 and Figure 1.
table 1: Linearity data for Rufinamide
S.no. Concentration/µgml-1 inj-1/Area inj-2/Area inj-3 Area count/mV*secAverage area
1 12.5 336 338 340 338
2 25 668 662 674 668
3 50 1368 1333 1340 1337
4 62.5 1680 1696 1703 1693
5 75 1998 2009 2008 2005
6 100 2675 2688 2650 2671
Slope 26.71
Intercept 4.71
R2 0.999
Figure 1. Linear calibration curve of rufinamide ( Area vs Concentration / µg/ml-1)
2.3.4 Preparation of standard solution and test solution
Analytical Method Development and Validation for Assay of Rufinamide Drug
2.3.5 Chromatographic Conditions
Optimisation of chromatographic conditions
The mobile phase for the proposed method (Phosphate buffer pH 4 : Acetonitrile 60 : 40) was filtered through 0.45 µm membrane filter. It was degassed with a sonicator for 15 min and pumped from the reservoir to the column (Phenomenex C-18, 250 mm × 4.6 mm, 5µm) at aflow rate of 1mL
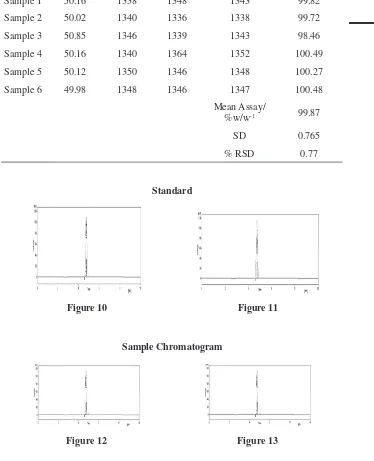
Standard
Figure 2 Figure 3
Figure 4 Figure 5
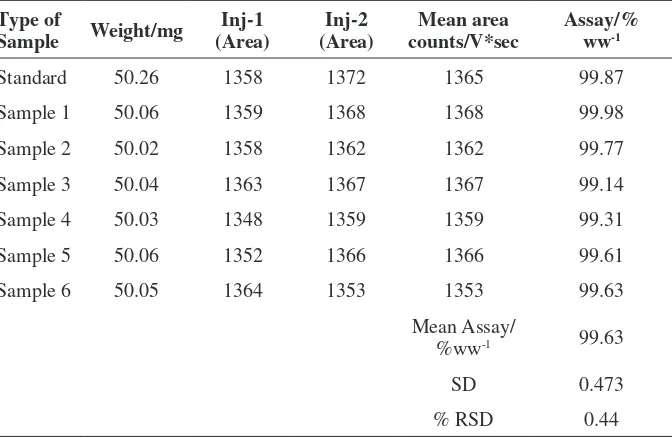
Sample Chromatogram
Figure 6 Figure 7
Singh, J. Sangwan, S. Grover, P. Mehta, L. Kiran, D. Goyal, A.
min-1. The run time was set at 10 min. Prior to injection of the drug solutions
the column was equilibrated for at least 1 h with mobile phase flowing through the system.The analyte was monitored at 225 nm and data acquired was stored and analyzed with spinchrom CFR chromatography software.
2.4 Method Validation Studies
Selectivity of the method was assessed on the basis of elution of Rufinamide using the above mentioned chromatographic conditions. The linearity, precision, accuracy, limit of detection, limit of quantitation and robustness has been validated for the determination of Rufinamide.
2.4.1 System precision
Six replicate injections of standard solution were given and mean of all of these values gives rise to the RSD value obtained. According to USP %RSD (Relative Standard Deviation) should not be more than 2% (Riley, M., Rosanke, T.W., 1996).
2.4.2 Method Precision
Method precision or Intra-assay precision data were obtained by repeatedly analyzing, in onelaboratory on one day, aliquots of homogeneous sample, each of which were independently prepared according to method procedure (Sethi, P.D., 2001 and Kar, A., 2005).
2.4.3 Linearity
Linearity of method is determined in the range 50-150 µg mL-1 (50%-150%).
According to International Conference on Harmonisation (I.C.H) guidelines correlation coefficient should be less than 0.999 (ICH, 1996).
2.4.4 Ruggedness
This analysis was repeated with different column on different day with different analyst and different system and %RSD value was determined.
2.5 Stability in Analytical Solution
A drug solution of 50 ppm was prepared and kept at room temperature i.e. 25oC for 24 hrs. After that drug solution was analyzed and it was found to be
stable at room temperature (Chafez, L., 1971).
2.5.1 Degradation studies of Rufinamide
Analytical Method Development and Validation for Assay of Rufinamide Drug
3. ReSultS AnD DiSCuSSion
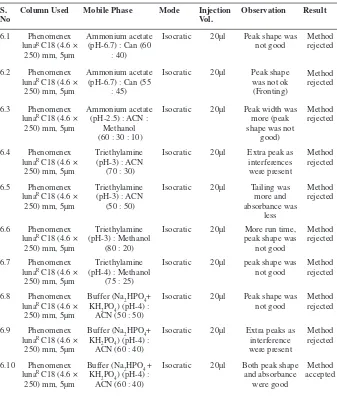
3.1 System precision
The system precision was analyzed by six replicate injections each of standard solutions of rufinamide (50 ppm) into the HPLC system and the results are presented in Table 2. Percentage RSD for system precision was found to be 0.75%.
table 2: Different trials carried out for developing the current HPLC
S.
no Column used Mobile Phase Mode injection Vol. observation Result
6.1 Phenomenex lunaR C18 (4.6 ×
250) mm, 5µm
Ammonium acetate (pH-6.7) : Can (60
: 40)
Isocratic 20µl Peak shape was
not good Method rejected
6.2 Phenomenex lunaR C18 (4.6 ×
250) mm, 5µm
Ammonium acetate (pH-6.7) : Can (55
: 45)
Isocratic 20µl Peak shape was not ok (Fronting)
Method rejected
6.3 Phenomenex lunaR C18 (4.6 ×
250) mm, 5µm
Ammonium acetate (pH-2.5) : ACN :
Methanol (60 : 30 : 10)
Isocratic 20µl Peak width was more (peak shape was not
good)
Method rejected
6.4 Phenomenex lunaR C18 (4.6 ×
250) mm, 5µm
Triethylamine (pH-3) : ACN
(70 : 30)
Isocratic 20µl Extra peak as interferences were present
Method rejected
6.5 Phenomenex lunaR C18 (4.6 ×
250) mm, 5µm
Triethylamine (pH-3) : ACN
(50 : 50)
Isocratic 20µl Tailing was more and absorbance was less Method rejected 6.6 Phenomenex lunaR C18 (4.6 ×
250) mm, 5µm
Triethylamine (pH-3) : Methanol
(80 : 20)
Isocratic 20µl More run time, peak shape was
not good
Method rejected 6.7 Phenomenex
lunaR C18 (4.6 ×
250) mm, 5µm
Triethylamine (pH-4) : Methanol
(75 : 25)
Isocratic 20µl peak shape was
not good Method rejected 6.8 Phenomenex
lunaR C18 (4.6 ×
250) mm, 5µm
Buffer (Na2HPO4+ KH2PO4) (pH-4) :
ACN (50 : 50)
Isocratic 20µl Peak shape was
not good Method rejected 6.9 Phenomenex
lunaR C18 (4.6 ×
250) mm, 5µm
Buffer (Na2HPO4+ KH2PO4) (pH-4) :
ACN (60 : 40)
Isocratic 20µl Extra peaks as interference were present
Method rejected
6.10 Phenomenex lunaR C18 (4.6 ×
250) mm, 5µm
Buffer (Na2HPO4 + KH2PO4) (pH-4) :
ACN (60 : 40)
Isocratic 20µl Both peak shape and absorbance
were good
Singh, J. Sangwan, S. Grover, P. Mehta, L. Kiran, D. Goyal, A.
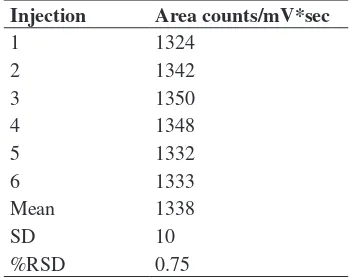
3.2 Method Precision
Two injections of standard solutions of rufinamide (50 ppm) were injected to check the system suitability. Then six sample rufinamide each batch were prepared separately andinjected in duplicate. Results are presented in Table 3, then %RSD for method precision was found to be 0.77%.
table 3: Six replicate injection of the stock solution (50ppm)
injection Area counts/mV*sec
1 1324
2 1342
3 1350
4 1348
5 1332
6 1333
Mean 1338
SD 10
%RSD 0.75
3.3 linearity
Linearity was determined by injecting six replicate injections of standard solutions of rufinamide (50 ppm) to check the system suitability. Then, the different concentration of sample solution was injected in duplicate in the concentration range of 50%–150% of drug substance, and the results are presented in Table 3. The correlation coefficient was found to be 0.999 from six replicate injections.
3.4 Ruggedness
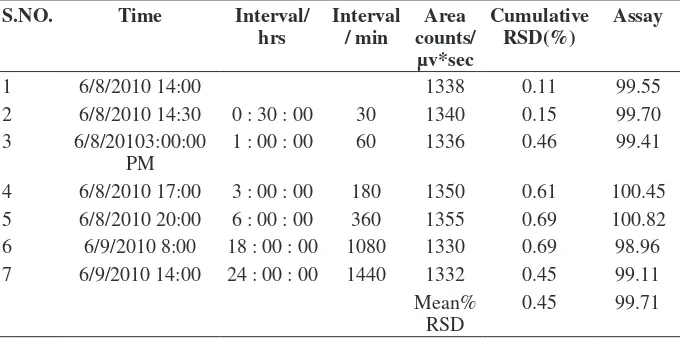
Analysis was carried out with different analyst, using different column and different day and the results are presented in Table 4. The %RSD for ruggedness was found to be 0.44%.
3.5 Robustness
Analytical Method Development and Validation for Assay of Rufinamide Drug
table 4. Method precision for calibration data Rufinamide
type of
Sample weight/mg (Area)inj-1 (Area)inj-2 counts/mV*secMean area Assay/% w/w-1
Standard 50.16 1324 1342 1333
Sample 1 50.16 1338 1348 1343 99.82
Sample 2 50.02 1340 1336 1338 99.72
Sample 3 50.85 1346 1339 1343 98.46
Sample 4 50.16 1340 1364 1352 100.49
Sample 5 50.12 1350 1346 1348 100.27
Sample 6 49.98 1348 1346 1347 100.48
Mean Assay/
%w/w-1 99.87
SD 0.765
% RSD 0.77
Figure 10 Figure 11
Standard
Figure 12 Figure 13
Singh, J. Sangwan, S. Grover, P. Mehta, L. Kiran, D. Goyal, A.
Figure 14 Figure 15
Figure 16 Figure 17
table 5. Rufinamide Ruggedness Assay
type of
Sample weight/mg (Area)inj-1 (Area)inj-2 counts/V*secMean area Assay/% ww-1
Standard 50.26 1358 1372 1365 99.87
Sample 1 50.06 1359 1368 1368 99.98
Sample 2 50.02 1358 1362 1362 99.77
Sample 3 50.04 1363 1367 1367 99.14
Sample 4 50.03 1348 1359 1359 99.31
Sample 5 50.06 1352 1366 1366 99.61
Sample 6 50.05 1364 1353 1353 99.63
Mean Assay/
%ww-1 99.63
SD 0.473
% RSD 0.44
3.6 Stability in Analytical Solution
Analytical Method Development and Validation for Assay of Rufinamide Drug
3.7 Degradation studies of Rufinamide
The drug was allowed to degrade in acidic, basic, oxidative and thermal conditions and results are presented in Table 8. There was no co eluting peaks (Figure 18).
4. ReSultS
Figure 2 shows typical chromatogram of Rufinamide. System stability tests were carried out on freshly prepared standard stock solutions of Rufinamide at 25°C (Table 5). The calibration curve was linear in the range of 50-150 µg/ml for rufinamide. The degradation studies of Rufinamide are shown in Table 6.
table 6: Robustness parameter
Parameter % RSD %Assay
Increased Wavelength (+5) 0.74 98.88
Decreased Wavelength (-5) 0.64 98.86
Increased pH (- 0.2) 0.69 99.38
Decreased pH (+ 0.2) 0..69 99.65
Increased Flow rate (+0.1ml) 0.84 98.79
Decreased Flow rate (-0.1ml) 0.77 99.59
Organic content increased 0.66 99.58
Organic content decreased 0.71 99.19
table 7: Stability data for Rufinamide (at 25°C):
S.no. time interval/
hrs interval / min counts/ Area µv*sec
Cumulative
RSD(%) Assay
1 6/8/2010 14:00 1338 0.11 99.55
2 6/8/2010 14:30 0 : 30 : 00 30 1340 0.15 99.70
3 6/8/20103:00:00
PM 1 : 00 : 00 60 1336 0.46 99.41
4 6/8/2010 17:00 3 : 00 : 00 180 1350 0.61 100.45 5 6/8/2010 20:00 6 : 00 : 00 360 1355 0.69 100.82 6 6/9/2010 8:00 18 : 00 : 00 1080 1330 0.69 98.96 7 6/9/2010 14:00 24 : 00 : 00 1440 1332 0.45 99.11
Mean%
Singh, J. Sangwan, S. Grover, P. Mehta, L. Kiran, D. Goyal, A.
Figure 18. Chromatogram of Rufinamide. (The peak retention time of Rufinamide
was 4.717 min)
table 8: Degradation studies of Rufinamide:
Degradation studies % degradation
Alkaline degradation (0.05 N NaOH, 1 h) 3 Alkaline degradation (0.01 N NaOH, 1 h) 7
Alkaline degradation ( 1 N NaOH, 1 h) 13
Alkaline degradation ( 2 N NaOH, 1 h) 15
Alkaline degradation (5 N NaOH, 1 h) 25
Acidic degradation ( 0.1 N HCl) 16
Oxidative degradation ( 1% H202) 11
Oxidative degradation ( 3% H202) 20 Thermal degradation ( solid sample, 100 °C, 24 h) 0 Thermal degradation ( solid sample, 100 °C, 24 h) 0
5. ConCluSion
HPLC method was successfully developed and validated for determination of rufinamide. The total run time was 10 min. Method validation results have proved the method to be selective, precise, accurate, robust and stability indicating. Thus, the developed stability indicating assay method can be successfully applied for routine analysis of rufinamide.
6. ReFeRenCeS
Beckett, A.H and Stanlake, J.B., (2002). Practical Pharmaceutical Chemistry. 4th Edn, Part 2, CBS
Analytical Method Development and Validation for Assay of Rufinamide Drug Boubakar, B.B., Etienne, R., Ducint, D., Quentinc, S., (2001). An HPLC method was developed and
validated for the estimation of Moxifloxacin in growth media. Journal of chromatography. B: Biomedical sciences and Applications. 754(1), 107-112.
Chafez, L., (1971). Stability-indicating assay methods for drugs and their dosage forms.Journal of Pharmaceutical Sciences. 60, 335. http://dx.doi.org/10.1002/jps.2600600302
Chatwal, G., Anand, S.K., (2004).Instrumental methods of chemical analyses. 5th ed, Himalayas
publishing house, India.
Green, J.M., (1996). A Practical Guide to Analytical Method Validation. Analytical Chemistry. 68, 305A-309A. http://dx.doi.org/10.1021/ac961912f
Hong, D. and Shah, M., (2000). Development and Validation of HPLC Stability Indicating Assays in Drug Stability Principles & Practice. Marcel. Decker, New York, pp 338.
ICH, (1996). Validation of Analytical Procedure. International Conference on Harmonization. IFPMA, Geneva, 739-49.
Kar, A., (2005). Pharmaceutical Drug Analysis. Second edition, New Age International (P) Ltd. Publishers, New Delhi, 453-476.
Riley, M., Rosanke, T.W., (1996). Development and Validation of Analytical Method. Biddle Ltd., 46-70.
Sethi, P.D., (2001). HPLC Quantitative Analysis of Pharmaceutical Formulations. 1st ed, New Delhi: CBS Publishers & Distributors, 3.
Taylor and Francis, (2007). Developed Differential pulse polarographic method for the determination of Moxifloxacin in Pharmaceutics,serum and urine. Analytical letters. 40(3), 529-546.