University of Technology, Department of Automotive Vehicles, Nadbystrzycka Street 36, 20-618 Lublin, e-mail: [email protected], [email protected]
ABSTRACT
The authors’ tests results on the impact of the guiding system (the guides) contamina-tion in the friccontamina-tion lift on the delay of progressive gears braking process are presented in this article. The tests were conducted using a free fall method and a test bench built for that purpose. In order to render all working conditions the guiding system of tested gears was lubricated with the most commonly used lubricating agents. Solid grease (SM), mineral oil (OL), the mixture of solid grease and quartz sand (S50) as well as the mixture of mineral oil and quartz sand (O50) were used.
Keywords: elevator, progressive gears.
INTRODUCTION
When the friction lifts are operated they move along the steel guides which are usually placed in the concrete shafts. The guides play a role of a guiding system for the cabin [3] in motion. The gears (brakes) are installed under each cabin. The gears operation depends on the nominal speed of a lifting device. The lift guide (Fig. 1) consists of a mounting part and a guiding one. When the gears are operated the guides are subject to overloading. That is why two different types of the guides are manufactured. The drawn and the ground guides are used. The lift guide is present-ed in a schematic way in the Figure 1. The main variable dimensions depending on the type of the lifting device and the main parts of the guide are illustrated in the Figure 1. During the lifts service life the guides can be dry or lubricated with a lu-bricating agent as per lifts manufacturer’s instruc-tions. Solid greases or mineral oils can be used as lubricating agents. Due to the nature of the lift-ing device operation, there is huge dustiness in the lifts shafts. The dust settles on the guides. It has a negative impact on the guide cooperation with the guide shoes. Consequently, the comfort of the guide shoe moving along the guide is
re-duced (the noise increases). Contamination on the guides can disturb the braking process and in consequence [5]:
• the carrying ties can break off,
• there can be a failure of power plant causing a rapid acceleration of the cabin.
In the articles [1, 2] the authors paid their attention to the application of different types of polymer. The polymer was used as an enve-lope of the roller in the lift guide shoe. The au-thors’ tests results, focused on the dimensional repeatability of the roller envelope in chang-ing loadchang-ing, were presented in the study. The results of numerical analysis and verification of received results for CHP 2000 type progres-sive gear conducted on the test bench are pre-sented by the authors in the research study [4]. The results of numerical calculations obtained by the authors were in line with the results of experimental tests. Four types of progressive gears available in the market are described and compared in the article [5] in respect of the new construction of CHP 2000 type gear. The received results of calculations for the brak-ing process delay, free movement of a brakbrak-ing roller and the gears kinematics allowed the au-Received: 2016.10.18
thor to implement some improvements to CHP 2000 gear design. Finite element method is touched in many publications also in the study [9] in which the author highlights a possibil-ity to use FEM method in designing process of thin-walled elements. Taking into account the possibilities given by the finite element method, the authors in their research study [6] focused on the application of FEM to analyse the loading variability of CHP 2000 type gear and the impact of loading changeability on the braking distance. The numerical analyses re-sults were verified on the test bench with the loading of 8000 N and 12000 N applied. The results confirmed the assumptions used for the numerical calculations. In the research study [7] the authors described the pre-tests for the impact of progressive gears geometry on the braking distance length both in changing op-eration conditions and changing loading. The tests were performed for the progressive gears used in hoisting and hauling equipment. The tests were conducted by use of the free fall
method allowing to evaluate the operational reliability of tested gears systems. Tests re-sults obtained in the experiment let the authors collect necessary data to perform further tests on the subject. While analysing the world lit-erature a lack of information in this subject-matter can be noticed. Thus, it is justifiable to continue the tests in this specific field of study.
Fig. 1. The lift guide [10]
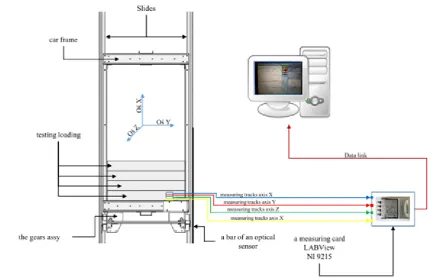
Fig. 2. The test bench [4]
Fig. 3. The test bench frame with the gears installed
b) c)
THE TEST BENCH, TESTING
METHODOLOGY
Tests conducted by using the free fall meth-od were performed on the test bench, the scheme of which is presented in Figure 2. The respective types of the gears were mounted in the frame presented in Figure 3. Kinematic schemes of sliding gears: PP16, CHP2000 and KB160 used for the tests are presented in Figure 4.
The Figure 5 presents the guides: the dry one starting from the left side and the guides with lubricating agents applied. The tests aimed at in-creasing the speed of tested system. The speed
increased due to the free fall. The gears were ac-tivated with a speed limiter, the speed of which was set at 1.25 m/s. When the speed set for the speed limiter was exceeded the release of tested systems and in other words the start up of brak-ing process took place. The test bench scheme is presented in Figure 6.
Measuring equipment and software prepared especially for the tests described in this research study were used to measure accelerations and braking distance. All four measuring paths were connected to LABVIEW 9215 measuring card. The card was coupled with PC class computer to record the received data.
with a mixture of mineral oil and O50 quartz sand applied, d) the guide with SM solid grease applied, e) the guide with a mixture of solid grease and S50 quartz sand applied
THE KEY RESULTS OF EXPERIMENTAL
TESTS
Data was recorded at the sampling frequency of 1kHz and the number of samples in one round was 2000. Due to the experimental tests the time of recording was 2 seconds. Theoretical modal analysis is often based on the numerical grounds which are broadly used to verify dynamics of tested construction. With reference to the above, the following empirical dependence (1) [6] can express an exemplary formula of the mechanical system dynamic movement:
(1) where: {ü},{u̇},{u} – represent the vectors respec-tively: acceleration, speed and displace-ment, |M|,|C|,|K| – represent the matrices re-spectively: mass, stiffness and dampening. In the above mentioned cases, it is difficult to describe the analysed aspects using empirical equations due to the complexity of phenomena occurring during the braking process in various operating conditions.
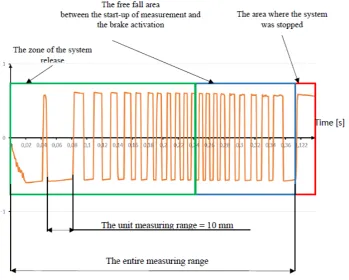
Figure 7 presents an effective recording frag -ment (braking process) of the free fall distance for tested systems. The total area of the free fall
dur-first one (green) is the free fall area starting from the fall initiation up to the gear release. The gear release means that a braking roller has changed its position. The second area (blue) represents the stage from the gear release to its stop. The third one (red) is the stage from the stop of recording to its end. The unit measuring range described on the measuring tape of the optical sensor was
Fig. 7. Stages of tested systems braking process
Fig. 8. The values of braking delay of the system tested with 10000 N loading for CHP2000, KB160,
in Figure 7 cut through a horizontal axis. It was caused by the read out of the optical sensor mea-suring bar. A positive value was described with light colour on the bar and for the negative value a dark colour was used. Thus, the braking dis-tance was recorded by the read-out of changing colouring placed on the sensor bar. It was the bar with 10 mm scale.
Results for maximum values of delays re-ceived in the experiment conducted with the gears of CHP2000, KB160 and PP16 type in changing operating conditions, described above, are present-ed in Figures 8, 9 and 10.
STATISTICAL ANALYSIS OF THE RESULTS
Examples of descriptive statistics for mea-surements conducted with 6000 N loading are presented in Figures 11-12. The statistics of skewness and kurtosis were analysed. In the ana-lysed cases the skewness is a measure of distri-butions deviation from symmetry. The empirical dependence (2) [11] describes the mathematical interpretation of skewness.
(2)
where: SKE – the skewness coefficient, n – the number of observations, xi – the result of the successive observation, x̄ – the aver-age, s – the standard deviation
In the analysed cases, kurtosis measures the distribution „pointedness”. If the value of kurtosis
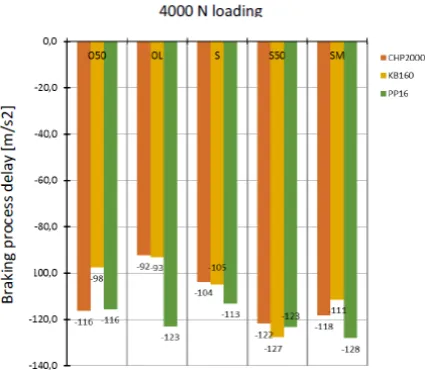
Fig. 9. The values of braking delay of the system tested with 4000 N loading for CHP2000, KB160
and PP16 gears in different operating conditions
Fig. 10. The values of braking delay of the system tested with 6000 N loading for CHP2000, KB160
and PP16 gears in different operating conditions
is visibly different to zero then the distribution is either more flat or more pointed than the normal distribution. The empirical dependence (3) [11] de-scribes the mathematical interpretation of kurtosis.
(3)
where: K – kurtosis, n – the number of observa-tions, xi – the result of the successive ob-servation, x̄ – the average, s – the standard deviation
Figure 11 presents the examples of kurtosis coefficients with the values higher than zero. Es -pecially it refers to CHP2000 gears for which the values were in a range from 15 to 22. For KB160 and PP16 gears the kurtosis reached the values in a range from 5 to 10. Basing on that, the con-clusion can be drawn that the average values of delays during the experiment for CHP2000 gears are lower than for the gears of KB160 and PP16 type. Generally, it is connected with the gears construction where the cam is the main braking element and not the roller. Thus, the distribution takes the form of leptokurtosis.
method, in the working condition of the gears the carrying frame was subject to loadings connected with the braking process dynamics. In effect, the vibrations in the frame construction were damped in the final stage of braking process.
CONCLUSIONS
Complexity of phenomena accompanying the braking process, in other words the condition of the guides cleanliness or the quality of applied grease do not always allow to identify the process to full extent. Then, a trial is made to identify a physical model by observation using simulation and laboratory tests [7]. Analysing the values of
the guides lubrication and contamination caused by greasing agents, their significant influence on the braking distance and in consequence on the delay value can be noticed. For the lift gears a steadiness of braking process is an indispensable condition to avoid some permanent damage of the lift carrying construction.
Basing on the received diagrams of delays for different loadings it can be noticed that PP16 gears are the least susceptible to changing con-ditions of the guides cleanliness. Probably, it is connected with a blocking mechanism construc-tion. The mechanism has a bigger contact surface on the both sides of the guide. It is also linked with the longest reached braking distance caused by the lowest pressure on the blocking element
Fig. 11. The kurtosis coefficient for the gears tested with 6000 N loading in different operating conditions
and 128 mm/s respectively. For the guides lubri-cated with oil the following delay results were re-corded: 98, 104 and 129 mm/s2. Whereas, for the
guides lubricated with a mixture of oil and quartz sand the values of delay were the following: 119, 128 and 129 mm/s2.For the guides lubricated with
grease and a mixture of grease, the lowest values of delay were reached for KB160 type gears due to their kinematics and different construction of susceptible elements (used in the gears) respon-sible for the braking process. Alike similarities of delay values were obtained for 4000 N and 10000 N loadings. Analysing the obtained values of de-lay it can be stated that CHP2000 type gears dem-onstrate a greater sensitivity to changing working conditions than the two remaining types of the gears subject to experimental tests.
Moreover, it can be noticed that in majority of analysed cases the contamination of the guides with quartz sand reduced the braking distance. As a result of that the friction coefficient was in -creased by adding silica (kinematic friction of a steel roller – it is approximately 0.09 for steel, for the steel roller in a contact with concrete (mate-rial containing silica) 0.3). It was caused by the increase of friction coefficient by adding silica
The achieved results confirm the regularity of proposed gears construction and provide the grounds to continue further research studies to reduce the impact of environmental conditions (condition of the guides) on effectiveness of braking distance.
the construction and operating conditions”, AGH University of Science and Technology Press, Cra-cow 2006.
4. Lonkwic P, Różyło P, Dębski H. Numerical and
experimental analysis of the progressive gear body
with the use of finite-element method. Mainte -nance and Reliability 17(4), 2015, 542–548, http:// dx.doi.org/10.17531/ein.2015.4.9.
5. Lonkwic P. Influence of friction drive lift gears
construction on the length of braking distance. Chinese Journal of Mechanical Engineering 28 (2), 2015, 363-368.
6. Lonkwic P., Różyło P. “Theoretical and experimen -tal analysis of loading impact from the progressive gear on the lift braking distance with the use of the free fall method”, Advances in Science and Tech-nology Research Journal, vol. 10 (30) , 103-109, 2016, DOI: 10.12913/22998624/62628.
7. Lonkwic P., Szydło K., Molski Sz. “The impact of
progressive gear geometry on the braking distance length under changeable operating conditions”, Advances in Science and Technology Research Journal vol. 1 (2016), 29, pages 161 – 167, DOI: 10.12913/22998624/61948.
8. The Polish Standard PN EN 81-1 Safety regula-tions on the elevators construction and installation. Part 1. Electrical elevators 2002.
9. Różyło P.: Optimization of I-section profile design by the finite element method;. Advances in Science
and Technology Research Journal, 2016, vol. 10, no. 29, p.52-56.
![Fig. 1. The lift guide [10]](https://thumb-us.123doks.com/thumbv2/123dok_us/8807531.1775385/2.595.76.521.575.752/fig-the-lift-guide.webp)