ISSN 2319-7625 (Online) (An International Research Journal), www.chemistry-journal.org
Theoretical Estimation of Surface Tension for Binary
Mixtures at Different Temperatures
Sadhna Shukla1, Ghan Shyam Gupta1 and R. K. Shukla*2
1 Department of Physical Science, Faculty of Science & Environment,
M.G.C.G. Vishwavidyalaya, Chitrakoot, Satna, INDIA.
1 2Department of Chemistry,
V.S.S.D.College, Kanpur-208002., INDIA. email: [email protected].
(Received on: February 14, 2018)
ABSTRACT
Theoretical estimation of surface tensions for benzyl alcohol + benzene binary system at 298.15, 303.15 and 313.15 K and atmospheric pressure over the whole concentration range has been done from the experimental data of density and surface tension. Prigogine-Flory-Patterson model (PFP), Ramaswamy and Anbananthan (RS), model derived by Glinski, Sanchez equation, Goldsack relation and Eberhart models were utilized to predict the associational behavior of weakly interacting liquids. The measured properties were fitted to Redlich-Kister polynomial relation to estimate the binary coefficients and standard errors. Furthermore, McAllister multi body interaction model was also used to correlate the binary properties. These non-associated and associated models were compared and tested for different systems showing that the associated processes yield fair agreement between theory and experiment as compared to non-associated processes.
Keywords: Surface Tension, Prigogine-Flory-Patterson, McAllister, Sanchez, Eberhart, GoldSacks.
INTRODUCTION
Prediction of surface tension is of out standing importance in many scientific and technological areas such as liquid-liquid extraction, gas absorption, distillation, condensation, environmental sciences, material sciences, process simulation, molecular dynamics1,2 etc and
play a significant role in several industries3 such as paints, detergents, agrochemicals and
experimental parameter that describes the thermodynamic state and contains at least implicit information on the internal structure of a liquid interface. Apart from this theoretical interest, a detailed understanding of the behavior of a vapor-liquid interface, such as enrichment of one component in a liquid surface is important for modeling a distillation process.
In the present work, we present the theoretical results of surface tension for benzyl alcohol + benzene binary liquid mixtures at 298.15, 303.15 and 313.15 K and atmospheric pressure over the whole concentration range. These data were analyzed in terms of associated models of Ramaswamy and Anbananthan (RS) model4 & model derived by Glinski5 and
non-associated models of Prigogine-Flory-Patterson (PFP) model6-8, Sanchez model9, Goldsack
model10 and Eberhart Model11. Associated models are based on the association constant as an
adjustable parameters where as non-associated are based on the additivity of liquids. For that purposes, we selected the liquids containing poor interacting properties. From these results, deviations in surface tension, were calculated and fitted to the Redlich-Kister polynomial equation12 to derive the binary coefficients and the standard errors. An attempt has also been
made to correlate the experimental data with the McAllister multi body interaction model13
which is based on Eyrings theory of absolute reaction rates.
THEORETICAL
Ramswamy and Anbananthan4 proposed the model based on the assumption of
linearity of acoustic impedance with the mole fraction of components. Further it is assumed, that any equilibrium physical property such as viscosity, refractive index, surface tension etc can be predicted. Further Glinski5 assumed that when solute is added to solvent the molecules
interact according to the equilibrium as:
A+B = AB (2)
and the association constant Kas can be defined as;
[
]
[ ][ ]
as
AB
K
A B
(3)where A is amount of solvent and B is amount of solute in the liquid mixture. By applying the condition of linearity with composition
obs = xA A + xAB AB (4)
where xA, xAB, A and AB and obs are the mole fraction of A, mole fraction of associate AB,
surface tension of A, surface tension of associate AB and observed surface tension respectively. The component AB can not be obtained in its pure form. Following simplifications have been made, firstly, concentration term should be replaced by activities for concentrated solution and second, there are also molecules of non associated components in the liquid mixture. The eq (4) takes the form,
obs = [xA A + xB B + xAB AB] (5)
Now, assuming any value of surface tension in the pure component AB, AB, it is
On changing both the adjustable parameters Kas and AB gradually, one can get different values
of the sum of squares of deviations,
S = (obs - cal) 2 (6)
where obs and cal are the observed and calculated equilibrium properties respectively.
The minimum value of S can be obtained theoretically by a pair of the fitted parameters. But we found that for some Kas and AB, the value of S is high and changes rapidly,
and for others, it is low and changes slowly when changing the fitted parameters. In such cases, the value of AB should not be much lower than the lowest observed surface tension of the
system or much higher than the highest one. Quantitatively, it should be reasonable to accept the pair of adjustable parameters Kas and AB which has the physical sense and which
reproduces the experimental physical property satisfactorily.
On inspecting the results obtained from Ramaswamy and Anbananthan model, Glisnki5 suggested the equation assuming additivity with the volume fraction, as;
1 2 2
1
2 1
cal (7)
where cal is the theoretical surface tension of binary liquid mixture, 1, 2 are the volume
fractions of component 1 and 2 and 1 and 2 are the surface tensions of pure component liquids.
The original cell model of Prigogine7 for spherical chain molecules uses a dependence
of the configurational energy on volume equivalent to the the Lennard-Jones (6, 12) energy-distance relation i.e. Flory and collaborators6 used the cell partition function of Hirschfelder
and Eyring and a simple Van der Waals energy- volume relation, by putting m=3, n so that the Flory equations for the mixing functions and partial molar quantities may be obtained from the general corresponding states equations given by making this particular choice of (m,n). Patterson et al.8 have drawn attention to the close connection between the Flory theory
and corresponding state theory of Prigogine employing a simple cell model of the liquid state. The equation of state for the materials conforming to the principle of corresponding states can be expressed in a universal form through the use of suitable characteristic values i.e. (reduction parameters) P*, V*, T* for the pressure, volume and temperature respectively.
In order to extend corresponding state theory to deal with the surface tension, Patterson and Rastogi8 used the reduction parameters as,
3 / 1 3 / 2 3 / 1 *
* * T P k
(8)called the characteristic surface tension of the liquid. Here k is the boltzmann constant. Paterson and Rastogi extended the simple cell model theory of the surface tension of spherical molecules by Prigogine and Saraga15 to the case of chain molecules. With a particular choice
m, n potential, Flory equation takes the form,
)]
0 . 1
5 . 0 ln(
) 0 . 1 (
[ )
( 1/3
~ 3 / 1 ~
~ 2 3 / 1 ~ 3 / 5 ~ ~
~
V V
V V V
M V
(9)
)
(
~ ~ *V
(10)All the notations used in the above equations have their usual significance as detailed out by Flory.
The relationship between surface tension, isothermal compressibility, T, and
density, of a liquid was obtained by Sanchez9 as;
2 / 1 0 2 / 1
)
/
(
T
A
(11)and applied successfully to binary liquids, assuming the following approximations as;
i T i i
T
2 1 and i i i 2 1 (12)Above expressions yield the final equation for the surface tension of binary liquids as;
i T i i i i i i i i A x 2 1 2 1 2 / 1 2 1 (13)
where Ai is defined as;
) / ( 2 i T i i i
A (14)
all the notations used in the equations have their usual significance as described by Sanchez. Goldsack and Sarvas10 used the mole fraction and volume fraction statistics to obtain the
expression surface tension and applied to various systems as;
1 ] ) [( , , T i i B i i R A x S
x (15)
where xi, S and xi, B are the mole fraction of the component in surface and bulk phase
respectively and Ai is the molar surface area of the component for binary liquids, the resulting equation is given by,
)] exp( ) exp( ln[ 2 2 1 1 T T T R A x R A x A
R
(16)
Where A1=A2= A and the volume of A is obtained from the relation
3 / 2 3 / 1 3 / 2 ) 4 3
( N Vi
A A
(17)
where N is the Avogadro number and vi is the molar volume of the component.
Eberhart11 assumed that the surface tension of binary liquids is a linear function of surface
layer mole fractions as;
2 2 1
1
y y (18)Using a semi-empirical constant, S, which is defined as the surface enrichment factor for the component having the lower surface tension,
) / /( ) /
(y2 y1 x2 x1
S (19)
where y1 and y2 are surface mole fractions and x1 and x2 are bulk mole fractions and where
) /(
)
(x1 1x2S 2 x1Sx2
(20)
RESULTS & DISCUSSION
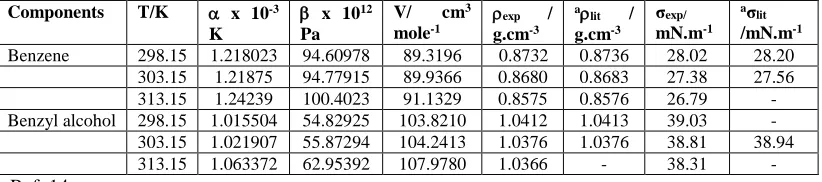
Pure component results and comparison with literature values14 are provided in Table 1.
The reported uncertainty ( 1.9 X 10⁻⁴ N.m-1) is the highest uncertainty found from all the data
points. The mixture data are presented in Tables 4-5.
The results of fittings obtained from the models were utilized properly. The calculations were performed using a computer program which allows fittings easily both the adjustable parameters simultaneously or the parameters were changed manually.
We constructed the data sheet in a computer program with association constant Kas
and CA,B as the fitted parameters. On changing these parameters, the equilibrium
concentrations of species [A], [B] and [AB] will change and the surface tension can be computed. The difference between experimental and theoretical values for surface tension is used to obtain the sum of squares of deviation. The values of surface tension in pure associate can be treated as a fitted one with the value of Kas.
Values of thermal expansion coefficient () and isothermal compressibility needed in the PFP model were obtained from the equation which have already been tested in many cases16.
The mixing function can be represented mathematically by Redlich-Kister polynomial equation for correlating the experimental data. The values of coefficients were determined by a multiple regression analysis based on the least square method and are summarized along with the standard deviations between the experimental and fitted values of the respective function in Table 2.
Multibody interaction model of McAllister13 is widely used for correlating the surface
tention viscosity of liquid mixtures with mole fraction. The coefficients a,b, and c were calculated using the least square procedure and the results of estimated parameters and standard deviation between the calculated and experimental values are presented in Table 3. It is observed that four body model is correlated the mixture surface tension to a significantly higher degree of accuracy for all the systems than the three body model.
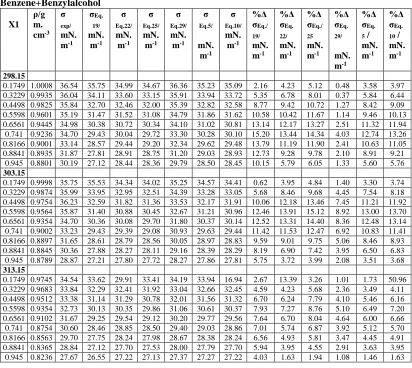
Mixture data are presented in Table 4-5. With the increase of mole fraction, the values of surface tension obtained from all the models decrease at all temperatures except at few places. The absolute average deviations (AAD) in surface tension obtained from different models are provided in Table 4. It is observed that all the equations are equally good and provide fairly good results. Higher deviation values in PFP model (eq 19) can be explained as the model was developed for non-electrolyte -meric spherical chain molecules and the system under investigation have interacting and associating properties. Moreover, the expression used for the computation of and T are also empirical in nature.
Results of surface tension obtained from different models along with percent deviation are reported in Table 5. A careful perusal of the results clearly indicates the close proximity of our results with the experimental findings.
the plots, the trend is almost similar and negative. Sometimes positive deviations are also observed which indicate strong molecular interactions between mixing molecules. These deviations are much prevalent as the composition of polar group increases as evidenced in figures. The negative deviations are usually explained quantitatively by the fact that surface layer of the liquid is enriched in the component of lower surface tension, thereby minimizing the Gibbs free energy of the mixture. Similar results have been presented earlier by many workers30 in recent past.
Table 1 Comparison of density (ρ) and Surface tension (σ) with literature data for pure components at 298.15, 303.15, and 313.15 K
Components T/K x 10-3 K
x 1012 Pa
V/ cm3 mole-1
exp / g.cm-3
a lit / g.cm-3
σexp/ mN.m-1
aσ lit /mN.m-1 Benzene 298.15 1.218023 94.60978 89.3196 0.8732 0.8736 28.02 28.20
303.15 1.21875 94.77915 89.9366 0.8680 0.8683 27.38 27.56 313.15 1.24239 100.4023 91.1329 0.8575 0.8576 26.79 - Benzyl alcohol 298.15 1.015504 54.82925 103.8210 1.0412 1.0413 39.03 -
303.15 1.021907 55.87294 104.2413 1.0376 1.0376 38.81 38.94 313.15 1.063372 62.95392 107.9780 1.0366 - 38.31 - a Ref. 14
Table 2 Coefficients of the Redlich-Kister equation and standard deviations ( ) for surface tension of binary liquid mixtures at various temperatures.
Benzene+Benzylalcohol
/mN.m-1 T A
0 A1 A2 A3 δ
298.15 12.7894 10.0663 10.0663 0.3097 0.1998 303.15 17.1911 7.0611 -8.9754 3.8436 0.1620 313.15 7.5755 4.4203 -2.5178 -1.4961 0.1122
Table 3 Parameters of McAllister Three body and Four body Interaction Models and Standard Deviations () for Surface Tension of Binary Liquid Mixtures at Various Temperatures
McAllisterThreeBody (/m N.m-1) McAllister Four Body (/m N.m-1)
Component Temp a b () a b c (δ)
Benzene+Benzyl alcohol 298.15 42.1778 33.6207 0.4234 29.1982 33.4461 33.0062 0.1825 303.15 39.5465 35.7636 0.2514 28.3772 33.1275 32.9763 0.1046 313.15 34.0128 33.7965 0.1125 27.7798 32.6639 31.2272 0.1597
Table 4Comparison of absolute average deviation values obtained from various liquid state models.
Component Liquids
Temp (K)
σ Eq.5/ mN.m
-1
σ Eq.10/ mN.m -1
σ Eq.19/ mN.m
-1
σ Eq.22/ mN.m
-1
σ Eq.25/ mN.m-1
σ Eq.29/ mN.m-1
Benzene+Benzylalcohol 298.15 2.91 3.08 3.46 3.15 3.47 0.59
303.15 2.91 3.09 2.86 3.15 3.46 1.84
Table 5 Experimental densities (), experimental surface tensions (σexp), theoretical surface tension from PFP model (σEq.19),Sanchez method,(σEq.22), Goldsack model, (σEq.25), Eberhart model, (σEq.29), RS model (σEq.5), Glinski model (σEq.10) of binary liquid mixtures and their percent deviations (% Δσ) at various temperatures.
Benzene+Benzylalcohol
X1 ρ/g m. cm-3
σ exp/ mN. m-1
σEq. 19/ mN.
m-1 σ Eq.22/ mN. m-1
σ Eq.25/ mN. m-1
σ Eq.29/ mN. m-1
σ Eq.5/
mN. m-1
σ Eq.10/ mN. m-1
%Δ σEq./ 19/ mN. m-1
%Δ σEq. 22/ mN. m-1
%Δ σEq./ 25 mN. m-1
%Δ σEq. 29/
mN. m-1
%Δ σEq. 5 / mN. m-1
%Δ σEq. 10 / mN. m-1
298.15
0.1749 1.0008 36.54 35.75 34.99 34.67 36.36 35.23 35.09 2.16 4.23 5.12 0.48 3.58 3.97
0.3229 0.9935 36.04 34.11 33.60 33.15 35.91 33.94 33.72 5.35 6.78 8.01 0.37 5.84 6.44
0.4498 0.9825 35.84 32.70 32.46 32.00 35.39 32.82 32.58 8.77 9.42 10.72 1.27 8.42 9.09
0.5598 0.9601 35.19 31.47 31.52 31.08 34.79 31.86 31.62 10.58 10.42 11.67 1.14 9.46 10.13
0.6561 0.9445 34.98 30.38 30.72 30.34 34.10 31.02 30.81 13.14 12.17 13.27 2.51 11.32 11.94
0.741 0.9236 34.70 29.43 30.04 29.72 33.30 30.28 30.10 15.20 13.44 14.34 4.03 12.74 13.26
0.8166 0.9001 33.14 28.57 29.44 29.20 32.34 29.62 29.48 13.79 11.19 11.90 2.41 10.63 11.05
0.8841 0.8935 31.87 27.81 28.91 28.75 31.20 29.03 28.93 12.73 9.28 9.78 2.10 8.91 9.21
0.945 0.8801 30.19 27.12 28.44 28.36 29.79 28.50 28.45 10.15 5.79 6.05 1.33 5.60 5.76
303.15
0.1749 0.9998 35.75 35.53 34.34 34.02 35.25 34.57 34.41 0.62 3.95 4.84 1.40 3.30 3.74
0.3229 0.9874 35.99 33.95 32.95 32.51 34.39 33.28 33.05 5.68 8.46 9.68 4.45 7.54 8.18
0.4498 0.9754 36.23 32.59 31.82 31.36 33.53 32.17 31.91 10.06 12.18 13.46 7.45 11.21 11.92
0.5598 0.9564 35.87 31.40 30.88 30.45 32.67 31.21 30.96 12.46 13.91 15.12 8.92 13.00 13.70
0.6561 0.9354 34.70 30.36 30.08 29.70 31.80 30.37 30.14 12.52 13.31 14.40 8.36 12.48 13.14
0.741 0.9002 33.23 29.43 29.39 29.08 30.93 29.63 29.44 11.42 11.53 12.47 6.92 10.83 11.41
0.8166 0.8897 31.65 28.61 28.79 28.56 30.05 28.97 28.83 9.59 9.01 9.75 5.06 8.46 8.93
0.8841 0.8845 30.36 27.88 28.27 28.11 29.16 28.39 28.29 8.19 6.90 7.42 3.95 6.50 6.83
0.945 0.8789 28.87 27.21 27.80 27.72 28.27 27.86 27.81 5.75 3.72 3.99 2.08 3.51 3.68
313.15
0.1749 0.9745 34.54 33.62 29.91 33.41 34.19 33.94 16.94 2.67 13.39 3.26 1.01 1.73 50.96
0.3229 0.9683 33.84 32.29 32.41 31.92 33.04 32.66 32.45 4.59 4.23 5.68 2.36 3.49 4.11
0.4498 0.9512 33.38 31.14 31.29 30.78 32.01 31.56 31.32 6.70 6.24 7.79 4.10 5.46 6.16
0.5598 0.9354 32.73 30.13 30.35 29.86 31.06 30.61 30.37 7.93 7.27 8.76 5.10 6.49 7.20
0.6561 0.9102 31.67 29.25 29.54 29.12 30.20 29.77 29.56 7.64 6.70 8.04 4.64 6.00 6.66
0.741 0.8754 30.60 28.46 28.85 28.50 29.40 29.03 28.86 7.01 5.74 6.87 3.92 5.12 5.70
0.8166 0.8563 29.70 27.75 28.24 27.98 28.67 28.38 28.24 6.56 4.93 5.81 3.47 4.45 4.91
0.8841 0.8365 28.84 27.12 27.70 27.53 28.00 27.79 27.70 5.94 3.95 4.55 2.91 3.63 3.95
0.945 0.8236 27.67 26.55 27.22 27.13 27.37 27.27 27.22 4.03 1.63 1.94 1.08 1.46 1.63
CONCLUSION
helpful in deducing the internal structure of associates through the fitted values of surface tension in a hypothetical pure associate and observed dependence of concentration on composition of a mixture.
REFERENCES
1. Wang,L.C, Xu,H.S., Zhao,J.H.,Song,C.Y., Wang,C.Y.: Density and viscosity of (3-picilone + water) binary mixtures from T= (193.15 to 343.15) K. J. Chem. Thermodyn. 37 , 477-483 (2005).
2. Mchaweh,A., Alsaygh,A., Nabrifar, Kh., Moshfeghiam, M.A.: A simplified method for calculating saturated liquid densities. Fluid Phase Equilibria. 224, 157-167 (2004). 3. Baker, K., Garbe, D., Surburg, H.: Common Fragrance and Flavor Materials: Preparation
Properties and Uses, 4th Ed.; Wiley VCH: Weinheim, Germany ( 2001).
4. Ramaswamy, D.Anbananthan, Acustica. 48, 281-282 (1981): Determination of the conditional association constants from the sound velocity data in binary liquid mixtures.
J. Chem. Phy. 118, 2301-2307 (2003).
5. Glinski, J.: Determination of the conditional association constants from the sound velocity data in binary liquid mixtures. J. Chem. Phy. 118, 2301-2307 (2003).
6. Abe, A., Flory, P.J.: The thermodynamic properties of mixtures of small non-polar molecules. J. Am. Chem. Soc. 82, 1838-1845 (1965).
7. Prigogine, I., Bellemans, A., Mathod, A.:Molecular Theory of Solutions, North-Holland, Amsterdam (1957).
8. Patterson, D., Rastogi, A.K.: The surface tension of polyatomic liquids and the principle of corresponding states. J. Phy. Chem. 74, 1067-1071 (1970).
9. Sanchez, I.C.: Liquids: Surface tension, compressibility and invariants. J. Chem. Phys. 79, 405 (1983).
10. Goldsack, D.E., Sarvas, C.D.: Volume fraction statistics and the surface tensions of non-electrolyte solutions. Can. J. Chem. 59, 2968 (1981).
11. Eberhart, J.G.: The surface tension of binary liquid mixtures. J. Phys. Chem. 70, 1183 (1966).
12. Redlich, O., Kister, A.T.:Thermodynamics of nonelectrolytic solutions. Algebric representation of thermodynamic properties and the classification of solutions. Ind. Eng. Chem. 40, 345-348 (1948).
13. McAllister, R.A.: The viscosity of liquid mixtures. AIChE J. 6, 427-431(1960).
14. Riddick, J.A., Bunger, W.B. Sakano, T.K.: Organic Solvents Techniques of Chemistry, 4th Ed. Willey: New York (1986).
15. Prigogine, I., Saraga, L.: Test of monolyer model for surface tension of simple liquids. J. Chem. Phys. 49, 399-407 (1952).