R E S E A R C H
Open Access
Functional characterization of biodegradable
nanoparticles as antigen delivery system
A. Petrizzo
1†, C. Conte
2†, M. Tagliamonte
1, M. Napolitano
3, K. Bifulco
4, V. Carriero
4, A. De Stradis
5, M. L. Tornesello
1,
F. M. Buonaguro
1, F. Quaglia
2and L. Buonaguro
1*Background:Peptide based vaccines may suffer from limited stability and inefficient delivery to professional antigen-presenting cells (APCs), such as dendritic cells (DCs). In order to overcome such limitations, several types of biodegradable nanoparticles (NPs) have been developed as carrier system for antigens. The present study describes for the first time the extensive biological characterization of cationic NPs made of poly (D,L-lactide-co-glycolide) (PLGA) and polyethylenimine (PLGA/PEI) as delivery system for protein/peptide antigens, with potential in therapeutic cancer vaccine development.
Results:Flow cytometry as well as confocal laser scanning microscopy (CLSM) showed that PLGA/PEI NPs are more readily taken up than PLGA NPs by both human CD14+monocytes and mouse Hepa 1–6 hepatoma cell line. No signs of toxicity were observed in either cellular setting. Sequential image acquisition by TEM showed an intracellular apical localization for PLGA NPs and a perinuclear localization for PLGA/PEI NPs. Both NPs showed a clathrin-dependent as well as a caveolin-dependent internalization pathway and, once in the cells, they formed multivesicular endosomes (MVE). Finally, anex vivopriming experiment showed that PLGA/PEI NPs are comparable to PLGA NPs in delivering a non-self antigen (i.e., ovalbumin - OVA) to immature dendritic cells (imDCs), which matured and induced autologous naïve CD4+ T cells to differentiate to memory (i.e., central memory and effector memory) cells. Such a differentiation was associated with a Th1 phenotype suggesting a downstream activation and amplification of a CD8+T cell cytotoxic response. The same OVA antigen in a soluble form was unable to induce maturation of DCs, indicating that both NP formulations provided an intrinsic adjuvanting effect combined to efficient antigen delivery.
Conclusions:Our study represents the first report on side-by-side comparison of PLGA and PLGA/PEI NPs as strategy for protein antigen delivery. PLGA/PEI NPs are superior for cellular uptake and antigen delivery as compared to PLGA NPs. Such an evidence suggests their great potential value for vaccine development, including therapeutic cancer vaccines.
Keywords:PLGA nanoparticles, PLGA/PEI nanoparticles, Antigen delivery system, Cancer vaccine
Background
Our improved understanding of antigen recognition and presentation by professional APCs to effector lympho-cytes has led to the development of several cancer vac-cine concepts, most of which based on peptides [1].
Cancer vaccines based on autologous DCs loaded ex
vivowith peptides have been developed and tested in sev-eral clinical trials with controversial results (reviewed in [2, 3]) due to several reasons, including the variable effi-ciency of the generated DCs in antigen presentation [4].
Recently, biocompatible PLGA NPs have generated tremendous interest in antigen delivery due to several features, including 1) antigen protection from early deg-radation in biological environments [5]; 2) prolonged antigen presentation by DCs for induction of B and T cell response after both systemic and mucosal adminis-tration [6]; 3) antigen reservoir for stimulation of CTL response [7]. However plain PLGA NPs have suboptimal adjuvant properties in vivoresulting in poor DC matur-ation [8].
Several strategies have been developed so far to en-hance NP uptake by DCs, including surface decoration with ligands of DC receptors as well as modification of surface charge with polycations able to promote electro-static interactions with anionic cell membranes [9]. The latter approach was found to be successful when PLGA
* Correspondence:[email protected] †Equal contributors
1Laboratoy Molecular Biology and Viral Oncology, Department of
Experimental Oncology, Istituto Nazionale per lo Studio e la Cura dei Tumori
“Fondazione Pascale”- IRCCS, Via Mariano Semmola 142, 80131 Naples, Italy Full list of author information is available at the end of the article
© 2015 Petrizzo et al.Open AccessThis article is distributed under the terms of the Creative Commons Attribution 4.0 International License (http://creativecommons.org/licenses/by/4.0/), which permits unrestricted use, distribution, and reproduction in any medium, provided you give appropriate credit to the original author(s) and the source, provide a link to the Creative Commons license, and indicate if changes were made. The Creative Commons Public Domain Dedication waiver (http://creativecommons.org/publicdomain/zero/1.0/) applies to the data made available in this article, unless otherwise stated. Petrizzoet al. Journal of Experimental & Clinical Cancer Research (2015) 34:114
NPs were modified with protamine that enhanced the NP properties of inducing activation and maturation of bone-marrow DCs [10, 11].
In this perspective, polycations may represent a prom-ising option in“nanovaccine”approaches to modify sur-face properties of PLGA NPs. Indeed, polyethylenimine (PEI) has been recently shown to have anticancer/immu-nostimulatory activities [12] as well as adjuvant proper-ties for glycoprotein antigens administered at mucosal sites [13].
On these premises, in the present study we developed NPs made of PLGA, alone or in association with PEI, to assess whether the modification would result in en-hancement of both NP cellular uptake and presentation of the carried non-self OVA antigen [14].
The rate of uptake and intracellular distribution of both NPs was assessed in a murine Hepa 1–6 hepatoma cell line and in human PBMCs.
Finally, an ex vivo priming experiment showed that both NPs were efficient in delivering the OVA antigen to immature dendritic cells (imDCs), inducing their matur-ation. Such matured DCs (mDCs) were able to prime autologous naïve CD4+T cells to differentiate into mem-ory T cells with a Th1 phenotype. This is suggestive of a downstream activation and amplification of a CD8+ T cell cytotoxic response, which is the relevant one in a therapeutic cancer vaccine setting.
Results
Nanoparticle properties
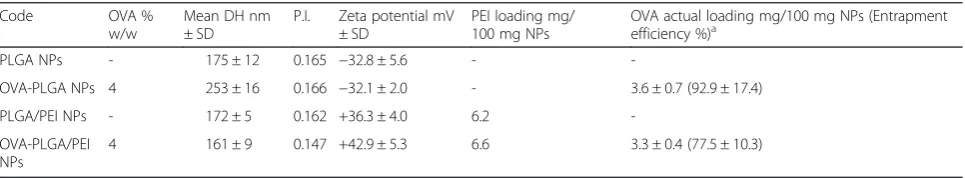
Properties of the produced NPs are reported in Table 1. The size of NPs was increased by OVA entrapment only in the case of PLGA NPs. Negative zeta potential of PLGA NPs switched to positive values in the case of PLGA/PEI NPs, suggesting that PEI was partly present onto NP surface. Lower entrapment efficiency of OVA was found for OVA-PLGA/PEI NPs, presumably due to the occurrence of electrostatic interactions between OVA and PEI, resulting in both localization of an OVA fraction onto NP surface and escape from the polymer matrix to the external phase during particle formation.
TEM analysis of NP morphology showed monolayer spheroid particles with a diameter ranging from 100 to 200 nm for PLGA NPs (Fig. 1a and c) and 50 to 250 nm
for PLGA/PEI NPs (Fig. 1b and d) in line with values ob-served by PCS.
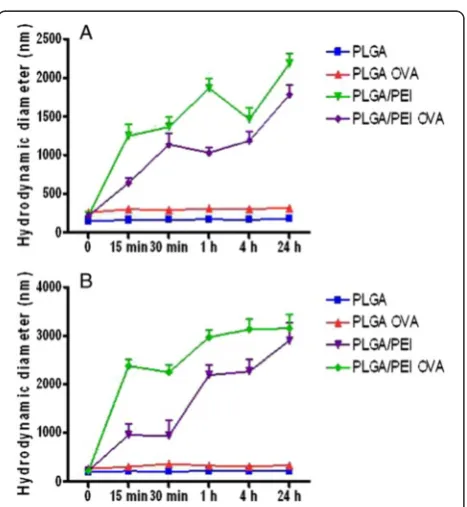
NP stability in both DMEM and RPMI culture media was analyzed. Both unloaded and OVA-PLGA NPs showed a satisfactory stability in the media. Conversely, the presence of PEI induced a remarkable aggregation of the NPs, likely due to interactions with serum proteins (Fig. 2a and b).
NP uptake in human PBMCs and mouse Hepa 1–6 cell line Cellular uptake studies were performed in a murine Hepa 1–6 hepatoma cell line and in human PBMCs. Fluorescently-labeled NPs prepared from a Rhodamine-PLGA conjugate (Additional file 1: Table S1) were employed for cellular uptake studies.
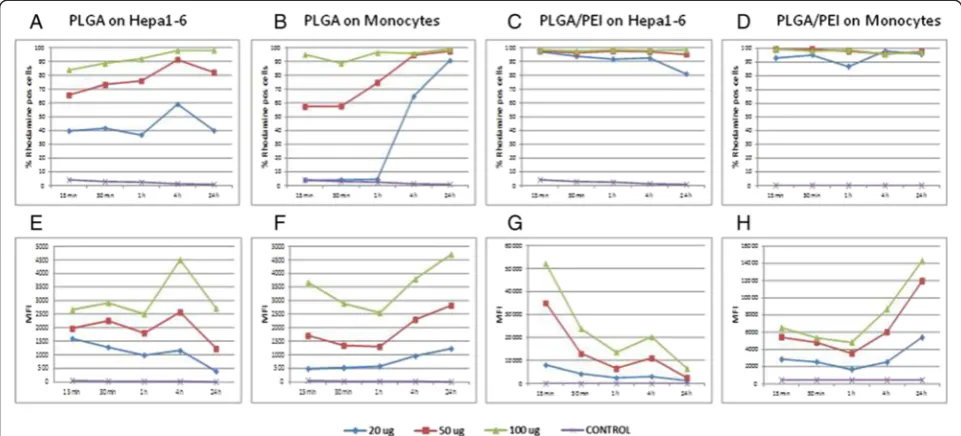
The percentage of cellular uptake was evaluated at se-quential time points, loading both cell types with increas-ing doses of both NPs (20, 50 and 100 μg/mL) (Fig. 3). Uptake of PLGA-Rhod NPs showed a dose- and time-dependent curve, reaching the saturation with the highest dose (i.e., 100μg/mL) in Hepa 1–6 cells, and with all three doses in PBMCs, after 4–24 h (Fig. 3a and b). On the con-trary, cellular uptake of PLGA-Rhod/PEI NPs in both cell types showed a dose- and time-independent curve, reach-ing the saturation as soon as 15 min, regardless the amount of NPs used for induction (Fig. 3c and d).
Moreover, the pattern of intracellular fluorescence showed a dose response curve in both cell types with both NPs (Fig. 3e-h). Considering the Hepa 1–6, for each of the three doses, the cellular fluorescence in-duced by PLGA-Rhod NP uptake was characterized by an initial lag phase, with a spike at 4 h, followed by a steep decline at 24 h (Fig. 3e), while the fluores-cence induced by PLGA-Rhod/PEI NP uptake peaked as soon as at 15 min, with a MFI (mean fluorescence intensity) >20 fold than with PLGA-Rhod NPs, to sharply reduce at subsequent time points, with a small rebound at 4 h. This finding was consistently observed for all three doses (Fig. 3g).
CD14+ monocytes showed a different profile (Fig. 3f and h). Indeed, the cellular fluorescence induced by up-take of PLGA-Rhod NPs progressively increased at dif-ferent time points with the lowest dose (20 μg/mL), while it progressively decreased for the first hour and
Table 1Properties of unloaded and OVA-loaded NPs. SD were calculated on three different batches
Code OVA % w/w
Mean DH nm ± SD
P.I. Zeta potential mV ± SD
PEI loading mg/ 100 mg NPs
OVA actual loading mg/100 mg NPs (Entrapment efficiency %)a
PLGA NPs - 175 ± 12 0.165 −32.8 ± 5.6 -
-OVA-PLGA NPs 4 253 ± 16 0.166 −32.1 ± 2.0 - 3.6 ± 0.7 (92.9 ± 17.4) PLGA/PEI NPs - 172 ± 5 0.162 +36.3 ± 4.0 6.2
-OVA-PLGA/PEI NPs
4 161 ± 9 0.147 +42.9 ± 5.3 6.6 3.3 ± 0.4 (77.5 ± 10.3)
a
Ratio between actual and theoretical loading x 100
sharply increased at 4 and 24 h with the higher doses (Fig. 3f). Moreover, unlike Hepa 1–6 cell line, the cellular fluorescence induced by uptake of PLGA-Rhod/PEI NPs in CD14+ monocytes was characterized by a “ parabola-like” pattern similar to the one observed for PLGA-Rhod NPs, with a sharp increase at 24 h reaching >3 fold MFI values (Fig. 3h).
Analysis of intracellular NP distribution by CLSM
Intracellular nanoparticle distribution was evaluated at dif-ferent time points by fluorescence microscopy and CLSM in Hepa 1–6 cells and PBMCs loaded with 50 μg/mL of PLGA and PLGA-Rhod/PEI NPs.
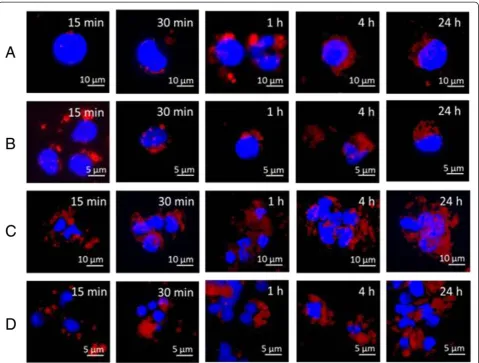
The fluorescence microscopy analysis showed that PLGA-Rhod NPs exhibited a low aggregation profile and a time-dependent internalization in both cell types as in-dicated by the appearance, already after 30 min, of punc-tuate red fluorescent spots that progressively pervaded the entire cytoplasm (Fig. 4a and b). Conversely, an in-crease in size of NPs due to their aggregation was ob-served in both cell types loaded with PLGA-Rhod/PEI NPs. A massive internalization of clustered PLGA-Rhod/ PEI NPs was observed already after 1 h incubation, in both Hepa 1–6 and PBMCs (Fig. 4c and d). Such obser-vations are fully in agreement with data on hydro-dynamic diameter (Fig. 2a and b).
The time dependent internalization of PLGA-Rhod NPs by monocytes exposed to 50 μg/mL PLGA-Rhod NPs for 30 min, 1 h, 4 h and 24 h was further confirmed Fig. 1TEM morphology study. TEM analysis of PLGA (aandc) and PLGA/PEI (bandd) NPs
Fig. 2NP stability in cell culture media. Stability of NPs was analyzed at 37 °C in DMEM (a) and RPMI 1640 (b), respectively, by monitoring size by PCS. Data are reported as mean of three independent experiments ± SD
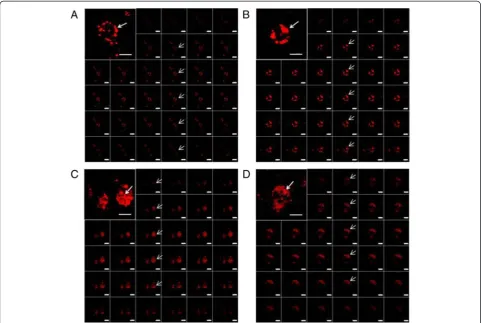
by z-stack analysis of confocal images taken through the cell at 0.1 μm intervals (Fig. 5a-d). Internalization of PLGA-Rhod NPs occurred already after 30 min (Fig. 5 a) and increased after 1 h (Fig. 5b) and 4 h (Fig. 5c). After 24 h, cells showed a diffuse intra-cytoplasmic fluores-cence together with smaller fluorescent spots, suggesting that, at this time point, escape from endolysosomes of PLGA-Rhod NPs might occur (Fig. 5d). The analysis of cells loaded with PLGA-Rhod/PEI NPs was not possible because of extensive cellular aggregation.
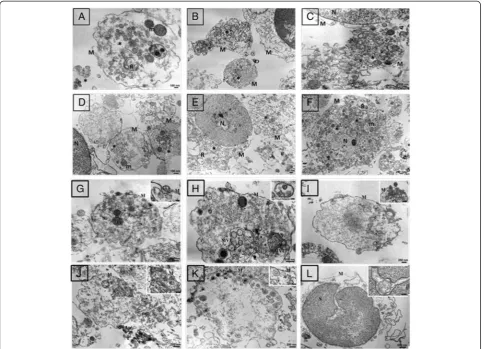
Analysis of NP intracellular compartmentalization by TEM TEM analysis of PBMCs showed a significantly different pattern of intracellular localization according to the NP formulation loaded. PLGA NPs were internalized as sin-gle particles and localized mostly at the cellular apical area for the entire incubation period (Fig. 6a-c). On the contrary, PLGA/PEI NPs were internalized as multiple particles, confirming particle-to-particle interactions found in the presence of proteins and more extensive uptake observed by flow cytometry as well as CLSM. Moreover, PLGA/PEI NPs were massively internalized already at 15 min post treatment (Fig. 6d), moved to-wards cellular core areas at 30 min (Fig. 6e) and reached the perinuclear region at 24 h (Fig. 6f ). Both NPs showed a clathrin-dependent (Fig. 6g and i) and a caveolin-dependent (Fig. 6j and k) internalization path-way [15] and, once in the cells, they formed multivesicu-lar endosomes (MVE) (Fig. 6h) [16]. Moreover, PBMCs loaded with PLGA PEI NPs often showed interactions between vesicles and nuclear membrane (Fig. 6l).
Effect of NPs onex vivoactivation of naïve CD4+T cells MDDCs obtained from human PBMCs by standard pro-cedure [17] were pulsed with 1.55 and 7.75μg OVA (1X and 5X dose), either soluble or encapsulated in NPs. Loaded cells did not show any significant toxicity due to NP loading, as assessed by MTT assay (data not shown).
Half of the immature DCs pulsed with the two doses of OVA (OVA-imDCs) were further matured by a 48 h treatment with LPS (200 ng/mL), resulting in mature DCs (OVA-mDCs). Both OVA-imDCs and OVA-mDCs were used to prime autologous naïve CD4+ T cells la-beled with CFSE in a 1:5 ratio.
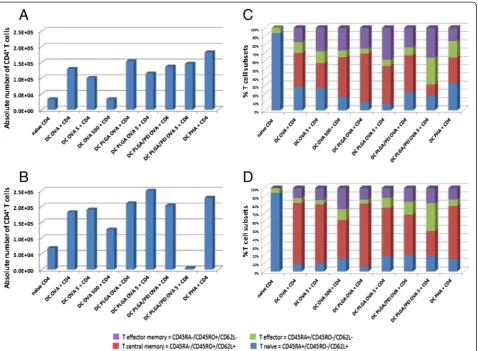
After 7 days of co-cultivation with imDCs or mDCs pulsed with the different OVA formulations, the absolute number of CD4+ T cells was assessed(Fig. 7a and b). As expected, the number of CD4+ T cells was significantly higher when co-cultured with mDCs and no significant difference was found among the different antigen formu-lations. The only major difference was observed in the co-culture with mDCs pulsed with 5X dose of OVA-PLGA/PEI NPs, in which the absolute number of CD4+ T cells was unexpectedly almost 2 logs lower than the others (5.6x10³) (Fig. 7b). The co-cultivation with imDCs showed that the OVA antigen was able to induce a significant increase in the number of CD4+T cells only when formulated in NPs. No significant difference was observed between the two NP formulations. (Fig. 7a).
In addition, the percentage of proliferating cells was evaluated as further parameter (Table 2). Immature DCs induced proliferation of 31.9 and 24.8 % of CD4+T cells when loaded with OVA-PLGA NPs at 1X and 5X dose, Fig. 3NP uptake in human PBMCs and mouse Hepa 1–6 cell line. Percent of Hepa 1–6 (aandc) and monocytes (bandd) which uptake PLGA-Rhod NPs (aandb) and PLGA-Rhod/PEI NPs (candd) at different time points. Mean fluorescence intensity (MFI) of Hepa 1–6 (eandg) and monocytes (fandh) loaded with different concentration of PLGA-Rhod NPs (eandf) and PLGA-Rhod/PEI NPs (gandh), at different time points
respectively. This was approx. a 2 fold increase com-pared to the proliferation induced by imDCs pulsed with the same doses of soluble OVA (17.4 and 12.8 %, re-spectively). Such an increase in proliferation was not ob-served in CD4+T cells co-cultivated with imDCs loaded with either doses of OVA-PLGA/PEI NPs (17.1 and 5.0 %, respectively). Indeed, the 5X dose of OVA-PLGA/ PEI NPs seemed to have an inhibitory effect on the over-all CD4+T cell proliferation.
On the contrary, mDCs induced similar levels of pro-liferating CD4+ T cells when loaded with either OVA-PLGA NPs or soluble OVA at both 1X and 5X doses, without any significant increment given by the antigen encapsulation in NPs (above 30 %). Also for mDCs, PLGA/PEI OVA NPs seemed to have an inhibitory effect on the overall CD4+ T cell proliferation at both doses (approx. 16.0 %).
Naïve unstimulated CD4+ T cells showed 0.1 % basal activation, whereas CD4+ T cells pulsed with PHA showed a 27.4 % proliferation.
Effect of NPs onex vivodifferentiation of naïve CD4+T cells Proliferating CD4+T cells induced by co-cultivation with imDCs as well as mDCs were fully characterized for their differentiation pattern. As expected, OVA antigen presentation by imDCs to CD4+ T cells induced a pro-gressive reduction of CD45RA+/CD45RO−/CD62L+ naïve T cells, with a complementary increase of the effector memory and central memory T cells (Fig. 7c). Such an effect was more evident when OVA antigen was delivered to imDCs in both NP formulations. Similarly, OVA antigen presentation by mDCs to CD4+ T cells induced a progressive reduction of CD45RA+/CD45RO
−/CD62L+
naïve T cells with a complementary increase of the effector memory and central memory T cells (Fig. 7d). However, such an effect was very comparable regardless the way of OVA antigen delivery to DCs (i.e., soluble or in NP formulation). Overall, OVA presenta-tion by imDCs and mDCs was equally effective in indu-cing effector T cells. In particular, effector memory T cells were more efficiently induced by imDCs, whereas Fig. 4Intracellular NP distribution evaluated by fluorescence microscopy. Hepa 1–6 (aandc) and monocytes (bandd) were loaded with either 50μg/mL PLGA-Rhod NPs (aandb) or PLGA-Rhod/PEI NPs (candd) at different time points. Original magnification: 400X
central memory T cells were more efficiently induced by mDCs.
Effect of NPs on cytokine secretion
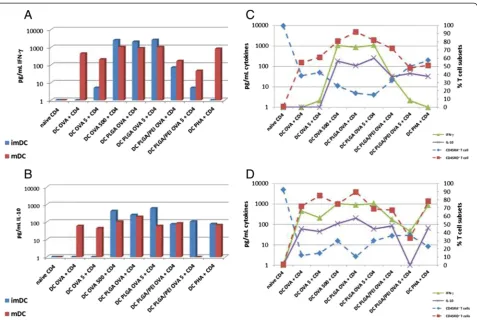
IFN-γand IL-10 production was evaluated in cell super-natants at the end of the 7 days co-culture. In particular, CD4+T cells co-cultured with imDCs loaded with soluble OVA did not produce any detectable cytokine level unless OVA was delivered at a 500X dose (Fig. 8a and b). On the contrary, imDCs loaded with NPs loaded with OVA were extremely effective in inducing both IFN-γand IL-10 pro-duction by CD4+T cells (IFN-γ> IL-10). In particular, ei-ther doses of OVA-PLGA NPs induced 2–3 log increase in cytokine production over the same doses of OVA as soluble antigen. The 1X dose of OVA-PLGA/PEI NPs was less effective but still induced an approx. 100 fold increase in cytokine production compared to the same dose of sol-uble OVA. Interestingly, the 5X dose of OVA-PLGA/PEI NPs did not increase IFN-γproduction (Fig. 8a).
On the other hand, CD4+ T cells stimulated by mDCs produced very high levels of both cytokines (IFN-γ> IL-10) with a limited 2–4 fold increase provided by NPs vs. soluble
delivery of OVA antigen. Indeed, the highest production was observed when mDCs were stimulated by either the 500X dose of soluble OVA or the 1X and 5X doses of OVA-PLGA NPs. Interestingly, either doses of PLGA/PEI OVA NPs did not induce an increase in cytokine produc-tion compared to corresponding dose of soluble antigen (Fig. 8a and b).
In addition, to determine which subset of CD4+T cells (i.e., naïve T cells, effector T cells, central memory, ef-fector memory) was the major contributor to the ob-served cytokine production, a correlation analysis was performed between the percentage of distinct T cell phe-notypes and the cytokine levels.
The correlation analysis was performed combining the four subsets in two distinct groups: the CD45RA+(naïve and effector T cells) and the CD45RO+(effector memory and central memory T cells) cells (Fig. 8c and d). In this setting, the analysis clearly showed a very strong direct correlation between the pattern of CD45RO+T cells and cytokine production with almost superimposable curves in the mDCs setting (correlation coeff. 0.62; p= 0.01) (Fig. 8d). Similarly, the pattern of CD45RA+ cells and Fig. 5Analysis of intracellular NP distribution by CLSM. monocytes were loaded with 50μg/mL PLGA NPs at different time points (a30 min;b1 h;c4 h; d24 h). Z-series images represent focal planes corresponding to 0.1μm vertical interval. Internalization areas are indicated by arrows. Original magnification: 630X. Scale bar: 10μm and 5μm
cytokine production showed a very strong inverse correl-ation (correlcorrel-ation coeff.–0.47p= 0.01) (Fig. 8d).
Discussion
A functional characterization of biodegradable NPs based on PLGA modified with PEI (PLGA/PEI) was per-formed in the present study. Their property as carriers to promote Ag presentation in human DCs was com-pared to plain PLGA NPs. Unloaded and OVA-loaded PLGA and PLGA/PEI NPs showed very similar size with opposite zeta potential (Table 1). Both NPs entrapped OVA with high encapsulation efficiency. However, PLGA/PEI NPs exhibited a tendency to aggregation in the presence of FBS-enriched cell culture media as pre-viously found for PEI-coated PLGA NPs [18].
NP uptake was evaluated in mouse Hepa 1–6 continu-ous cell line and in primary human PBMCs at different concentrations and time points (Fig. 3). The uptake pro-file of PLGA-Rhod/PEI NPs, analyzed by flow cytometry,
showed saturation soon after 15 min of incubation with very high levels of fluorescent cells (Fig. 3c and d). On the contrary, the uptake of PLGA-Rhod NPs by both cell types showed a dose- and time-dependent increasing profile, reaching the saturation level only after 24 h of incubation (Fig. 3a and b). Such a result could be explained by the positive surface charge of PLGA-Rhod/PEI NPs which facil-itated adherence to negatively charged cellular membranes, increasing intracellular uptake [19]. These results were fur-ther confirmed by fluorescence microscopy as well as CLSM analysis (Figs. 4 and 5). Indeed, PLGA-Rhod/PEI NPs showed a marked trend to aggregation with a massive cellu-lar internalization associated with a clear pattern of cellucellu-lar clustering. PLGA-Rhod NPs showed progressive internaliza-tion in both cell types. A lack of correlainternaliza-tion between the two measurements was not surprising given that the number of Rhodamine-labeled NPs entering each cell greatly varied.
TEM analysis confirmed a significantly different pat-tern of intracellular localization according to the type of Fig. 6TEM ultrastructural study. Monocytes were loaded at different time points with either 50μg/mL PLGA NPs (a15 min;b30 min;c24 h) or PLGA/PEI NPs (d15 min;e30 min;f24 h). Clathrin-dependent (gandi) and caveolin-dependent (jandk) pathways; multivesicular enodosomes (MVE) (h); interactions between vesicles and nuclear membrane (l) at 24 h post loading. NP internalization is indicated by asterisks. M: cytoplasmic membrane, N: nucleus, R: endoplasmic reticulum, m: mitochondria
NPs loaded on the cells. Indeed, while PLGA/PEI NPs were taken up as multiple particles and reached the peri-nuclear area (Fig. 6d - f ), PLGA NPs were taken up as single particles and remained localized at the cellular ap-ical area (Fig. 6a - c). Both NPs showed an internaliza-tion pathway resembling clathrin-dependent (Fig. 6g and i) as well as a caveolin-dependent (Fig. 6j and k) path-ways [15]. Moreover, PBMCs loaded with PLGA/PEI NPs often showed interactions between vesicles and nu-clear membrane (Fig. 6l). The latter observation is ex-tremely interesting because it has never been reported in literature [20].
Finally, the efficacy of antigen delivery by PLGA and PLGA/PEI NPs to antigen-presenting cells was assessed in anex vivopriming assay. Results showed that imDCs loaded with 1X dose of OVA formulated in both NP for-mulations induced the duplication of CD4+T cells more efficiently than soluble OVA (even at 500X dose) (Fig. 7a). On the contrary, T cell duplication was induced by mDCs at same levels when OVA was delivered to Fig. 7Effect of NPs onex vivodifferentiation of naïve CD4+T cells. Absolute number of CD4+T cells after 7 days of co-cultivation with either OVA-imDCs (a) or OVA-mDCs (b). CD4+T cell differentiation after 7 days of co-cultivation with either OVA-imDCs (c) or OVA-mDCs (d). Naïve unstimulated CD4+T cells represent basal activation. CD4+T cells pulsed with PHA represent a positive proliferation control
Table 2Percentage of proliferating CD4+T cells co-cultivated with imDCs or mDCs
Treatment Antigen presenting cells
imDCs mDCs Null 1.7 % 0.1 % OVA 17.4 % 32.0 % OVA 5X 12.8 % 27.0 % OVA 500X 22.4 % 28.9 % OVA-PLGA 31.9 % 35.3 % OVA-PLGA 5X 24.8 % 34.4 % OVA-PLGA/PEI 17.1 % 16.0 % OVA-PLGA/PEI 5X 5.0 % 15.9 % PHA 26.2 % 27.4 %
DCs as soluble antigen or encapsulated in both types of NPs (Fig. 7b).
Such a result strongly indicates that the 1X dose of OVA formulated in NPs is able to induce a maturation of imDCs and subsequent activation of co-cultured au-tologous naïve CD4+ T cells. On the contrary, OVA-PLGA/PEI NPs, and in particular the 5X dose, seemed to have an inhibitory effect on the overall CD4+ T cell proliferation. This unexpected result is currently under investigation.
Overall, the effect elicited was stronger when OVA was encapsulated in mDCs than in imDCs, showing that PLGA NPs are not able to induce a full maturation pat-tern of DCs even in the presence of PEI. This strongly supports the need for additional functionalization in order to provide NPs with the full adjuvanting effect.
Differentiation of naïve CD4+ T cells varied according to antigen delivery to imDCs and mDCs. Indeed, the most evident increase in effector memory and central memory T cells was observed when OVA antigen was delivered to imDCs in NP formulations (Fig. 7c). On the contrary, no striking difference in CD4+T cell differenti-ation was observed when OVA antigen was delivered to
mDCs either soluble or encapsulated in NPs (Fig. 7d). In both experimental settings, the highest percentage of cen-tral memory T cells was induced by the 1X dose of OVA-PLGA NPs. The highest percentage of effector memory T cells was induced by the 5X dose of OVA-PLGA NPs, in the imDC setting, and by the 500X dose of soluble OVA in the mDC setting. Conversely, in both experimental set-tings, the highest percentage of effector T cells was induced by the 5X dose of OVA-PLGA/PEI NPs. Such results pro-vide epro-vidence that either imDCs or mDCs when loaded with 1X dose of OVA formulated in PLGA NPs are ex-tremely effective in skewing naïve CD4+T cells toward the full spectrum of activated T cell phenotypes, including cen-tral memory T cells which are crucial for the establishment of immunological memory.
The apparent discordance between efficient uptake and antigen presentation to T cells observed for PLGA/PEI NPs, could be explained by the strong interaction occur-ring between PEI and OVA. This could significantly reduce the OVA protein release and its availability for processing and presentation in the context of MHC II.
The evaluation of cytokines produced in the co-cultures indicated a strong induction of a Th1 Fig. 8Effect of NPs on cytokine secretion. IFN-γ(a) and IL-10 (b) production was evaluated after 7 days of T cell co-cultivation with either OVA-imDCs or OVA-mDCs. A correlation analysis between CD4+T cell subsets and cytokine production was performed in either OVA-imDCs (c) or OVA-mDCs (d) co-culture setting
phenotype, characterized by high levels of IFN-γ pro-duction and lower levels of IL-10 (Fig. 8a and b). Such CD4+ T helper phenotype is suggestive of an effective CD8+ T cell response, as previously shown for PLGA NPs [8, 21]. Only OVA encapsulated in NPs was able to induce same levels of cytokines when presented to both imDCs and mDCs. The modification with PEI did not enhance the effect of PLGA NPs but even reduced it. Additional studies are in progress to dissect such an ef-fect. Soluble OVA induced the same effect in both DCs only at the 500 X dose, at lower doses the effect was observed in mDCs only.
The present results are in agreement with the evidence that Th1 cells may produce both IFN-γ and its negative regulator IL-10 as negative feed-back loop to contain an excessive immune response [22, 23].
Furthermore, a correlation analysis showed that, in-deed, the CD45RO+ memory T cells were the major if not the only contributor to production of both cytokines (Fig. 8 c and d), in agreement with previous studies [24], suggesting the efficient induction by NPs of memory CD4+Th1 cells.
Conclusions
Biodegradable nanoparticles represent a very effective antigen delivery system, providing sufficient co-stimulatory signals able to induce innate as well as ef-fector/memory adaptive immune responses with limited antigen dose. The side-by-side comparison showed that PLGA/PEI NPs, although providing higher cell uptake in imDCs, are comparable to PLGA NPs in delivering the OVA non-self antigen to DCs, inducing differentiation of autologous naïve CD4+T cells into memory cells with a Th1 phenotype. In our experimental setting, modifica-tion with PEI may represent a promising approach in therapeutic cancer vaccine strategy development, but it does not appear to enhance the antigen presentation ac-tivity of PLGA NPs. Indeed, further optimization of the model is required to parallel effects obtained with NPs decorated with ligands of DC receptors.
Methods Materials
Poly (D,L-lactide-co-glycolide) (PLGA) (50:50 Resomer RG 502H inherent viscosity 0.16–0.24 dL/g) was pur-chased from Boehringer Ingelheim (Ingelheim, Germany). Polyethyleneimine (PEI, MW = 10–25 kDa branched), poloxamer 188 (Pluronic® F68), Bradford reagent, potas-sium phosphate dibasic and potaspotas-sium phosphate mono-basic, sodium azide, sodium chloride, copper (II) sulphate and albumin from chicken egg white (OVA), were pur-chased from Sigma-Aldrich. Sodium hydroxide was pro-vided from Delchimica Scientific Glassware. Ethanol (96 %), phosphoric acid (85 %), acetic acid, acetonitrile
and tetrahydrofuran were purchased from Carlo Erba Reagenti (Milan, Italy).
Preparation of NPs
Unloaded and OVA-loaded PLGA and PLGA/PEI NPs were prepared by a modified emulsion-solvent diffusion technique [25]. An aqueous solution containing 1 mg of OVA (50μL) was emulsified by an ultrasound probe for 2 min at 3W (Sonicator 3000, Misonix, USA) with 1.5 mL of PLGA (1.5 % w/v) and poloxamer 188 (1.5 % w/v) dis-solved in methylene chloride. The resulting emulsion was quickly added to 7.5 mL of ethanol, leading to an immedi-ate precipitation of the polymer in the form of NPs. The dispersion was diluted with 7.5 mL of ultrapure water and stirred at RT for 1 h. The organic solvents were evapo-rated under vacuum at 30 °C. NPs were washed twice with ultrapure water under centrifugation at 13220 x g for 15 min. The pellet was re-dispersed in water and freeze-dried for 24 h (addition of threalose 4:1 mass ratio to polymer weight). Recovery yield of production process was evalu-ated on an aliquot of NP dispersion by weighting the solid residue after freeze-drying. Results are expressed as the ra-tio of the actual NPs weight to the theoretical polymer weight x 100. Fluorescent NPs were prepared analogously by incorporating a 20 % w/w of PLGA-Rhod to PLGA NP core [26].
Characterization of NPs
The hydrodynamic diameter (DH) and polydispersity index (PI) of NPs were determined by Photon Correlation Spec-troscopy (PCS) using a N5 Submicron Particle Size Analyzer (Beckman-Coulter). A NP dispersion was diluted in Milli-Q water at intensity in the range 104–106counts/s and measurements were performed at 25 °C on 90° angle. Results are reported as mean DH of three separate mea-surements on three different batches ± SD. Size of NPs stored in the dark at 4 °C for 3 months was monitored too. Zeta potential was determined by analyzing a NP dis-persion in water on a Zetasizer Nano Z (Malvern Instruments Ltd.). Results are reported as mean of three separate measurements of three different batches (n= 9) ± SD.
PEI amount associated to NPs
PEI was quantified by a colorimetric method developed by us. To this purpose, 0.5 mg of freeze-dried PLGA/PEI NPs were treated with 0.5 mL of 1 M NaOH and stirred overnight. The sample (0.5 mL) was diluted with 0.5 mL of 1 M acetic acid. The resulting solution (0.5 mL) was added to 1 mL of acetate buffer 0.1 M at pH 4.5 and complexed with 0.25 mL of a copper (II) sulphate water solution 0.1 % w/v. The absorbance value of each solu-tion was recorded at 281 nm (UV 1800, Shimadzu). A calibration curve was constructed in the same condition
in the PEI concentration range 15–380 μg/mL. Possible interference of PLGA on PEI quantitative analysis was assessed by treating and analyzing a similar amount of unloaded PLGA NPs in the same conditions.
OVA entrapment efficiency
OVA loading inside NPs was assessed by dissolving 1 mg of NPs in 500μL of methylene chloride under stirring for 15 min. Thereafter, 500μL of water were added and after stirring for further 15 min, the sample was centrifuged at 2000 x g for 5 min. The supernatant (0.1 mL) was col-lected and added to 0.9 mL of Bradford reagent. After in-cubation for 15 min, the absorbance of the solutions was measured at 595 nm on an UV spectrophotometer (UV 1800, Shimadzu) and compared to a calibration curve gen-erated in the OVA concentration range 20–1000μg/mL. To verify a possible interference of copolymers on OVA quantitative analysis, an amount of unloaded NPs was treated and analyzed in the same conditions.
NP stability in cell culture media
The stability of NPs under physiologically relevant condi-tions was evaluated by placing a known amount of NPs in DMEM (Dulbecco’s Modified Eagle Medium, Life Tech-nologies) and RPMI 1640 (Life TechTech-nologies) cell culture media supplemented with FBS 10 % (NP concentration was 1.5 mg/mL) at 37 °C. Size measurements of the sam-ples were taken by PCS after 24, 48 and 72 h of incubation.
Nanoparticle uptake
Hepa 1–6 or PBMCs were seeded into each well of a 24-well culture plate in a maximum volume of 1 mL/24-well for induction. PLGA NPs labeled with rhodamine B were added to the culture medium 24 h later. The final NPs concentration was adjusted to 20, 50 and 100 μg/mL. Following different incubation times, the cells were washed with 1X PBS and further treated for FACS and CLSM analysis.
FACS analysis
Hepa 1–6 cells were washed twice with 1X PBS and studied with a FACScalibur flow cytometer (BD FACSCanto II). In parallel, NP-loaded PBMCs were stained with PerCP-Cy5.5-anti-human CD14 antibody for 30 min at 4 °C before analysis.
CLSM analysis
Confocal laser scanning microscopy (CLSM) was applied to image the Hepa 1–6 and PBMCs after incubation with NPs. Cells (2x10⁴/sample) were seeded on sterile glass coverslips and cultured in suitable growth medium. 24 h later, fluorescently labeled NPs were added to the culture medium with a final concentration of 50 μg/mL. Following different incubation times, the culture
medium was removed and the cells were rinsed with 1X PBS. Cover slips were mounted using 20 % (w/v) mowiol (Sigma-Aldrich). Cells were visualized with a 510 META-LSM confocal microscopy (Carl Zeiss) and z-series with 0.1 μm intervals were collected. Alternatively, after nu-clear staining with 4-6-diamidino-2-phenylindole dye (DAPI), cells were visualized by a fluorescence inverted microscope connected to a video-camera (Carl Zeiss).
TEM analysis
50 μl of each NP dispersion was applied to a carbon-coated copper/rhodium grid (400 mesh) (TAAB Labora-tories Equipment Ltd, Aldermaston, Berks, ENGLAND). The coated grid was floated for 2 min on the drop, rinsed with 200μl of double distilled water and negative stained by 200 μl of 2 % w/v uranyl acetate solution (TAAB Laboratories Equipment Ltd). After draining off the excess of staining solution, the specimen was trans-ferred to the electron microscope for examination, using a TEM-Philips Morgagni 282D transmission electron microscope, operating at 60 kV. Cells incubated with NPs at 15 min, 30 min and 24 h were processed accord-ing to embeddaccord-ing standard procedures, i.e., fixation in 2.5 % glutaraldehyde in 1X PBS for 2 h, post-fixation at 4 °C in 1 % osmium tetroxide in the same buffer for 1 h, bulk staining overnight in 0,5 % aqueous uranyl acetate, dehydration in graded ethanol dilutions, and embedding in TAAB Spurr resin (TAAB Laboratories Equipment Ltd, Aldermaston, Berks, ENGLAND). Diamond thin sections were stained with lead citrate before TEM ob-servations at 80 KV accelerating voltage. All the electron micrographs were photographed on Kodak electron microscope film 4489 (Kodak Company, New York, USA).
Human PBMC isolation and DC generation
Fresh human PBMCs were isolated, from EDTA-treated blood collected from healthy donors, by Ficoll-Hypaque density gradient centrifugation and plated in 6-well plates at a concentration of approximately 1 × 10⁶cells/well in a maximum volume of 2 mL/well.
Monocyte-derived dendritic cells (MDDCs) were gener-ated as described previously, with minor modifications [17]. Briefly, isolated PBMCs were allowed to adhere to plastic in 6-well plates for 2 h. Adherent monocytes were washed with RPMI 1640 medium and were then cultured for 6 days in DC culture medium supplemented with 50 ng of recombinant granulocyte-macrophage colony-stimulating factor (rGM-CSF; R&D Systems, Minneapolis, Minn.) per mL and 1000 U of recombinant interleukin-4 (rIL-4; R&D Systems, Minneapolis, Minn.) per mL. Imma-ture DCs (imDCs) were ready for NP treatment.
Isolation of naïve CD4+T cells
Naïve CD4+ T cells were isolated from PBMCs by nega-tive selection with a mixture of mAbs from StemCell Technologies (Vancouver, British Columbia, Canada), according to the manufacturer’s instructions. Anti-human HLA-DR tetrameric mAb (StemCell Technolo-gies) was also included to increase purity of naïve CD4+ T cells.
Antigen-specific stimulation of autologous naïve CD4+T cellsex vivo
Human imDC were pulsed O/N with 1.55 and 7.75 μg OVA, either soluble or encapsulated in NPs. Cell viabil-ity was assessed by MTT assay according to the manu-facturer’s instructions (Sigma). OVA-treated imDCs (OVA-imDCs) were used directly or stimulated for add-itional 48 h with LPS (200 ng/mL) to induce DC matur-ation (OVA-mDCs). OVA-imDCs and OVA-mDCs were co-cultured for 7 days with autologous naïve CD4+ T cells labeled with carboxyfluorescein succinimidyl ester (CellTrace™ CFSE Cell Proliferation Kit; Life Technolo-gies), according to the manufacturer’s instructions. Briefly, 5x10⁴ DCs/per well were used for priming au-tologous naïve CD4+T cells (2x10⁵cells/per well) in 200
μl of total culture volume in 96-well plates. The co-cultures were incubated in a humidified incubator in the presence of 5 % CO2at 37 °C for 7 days. T cell prolifera-tion and differentiaprolifera-tion was estimated by flow cytometry by cell count using antibodies directed against CD4, CD62L, CD45RO and CD45RA, and CFSE dilution. After 7 days, supernatants from the assay wells were re-moved and IFN-γ as well as IL-10 were measured with the Platinum ELISA kit (eBioscience), according to the manufacturer’s instructions.
Statistical analyses
Data were analyzed by descriptive statistics, calculating the mean and standard deviation for continuous variables.
Additional file
Additional file 1: Table S1.Composition and properties of fluorescent unloaded NPs. SD were calculated on three different batches. (DOCX 17 kb)
Abbreviations
APCs:Antigen-presenting cells; DCs: Dendritic cells; NPs: Nanoparticles; PLGA: Poly (D,L-lactide-co-glycolide); PEI: Polyethylenimine; CLSM: Confocal laser scanning microscopy; TEM: Transmission electron microscopy; MVE: Multivesicular endosomes; OVA: Ovalbumin; imDCs: Immature dendritic cells; mDCs: Mature dendritic cells; Th1: T helper 1; CTL: Cytotoxic T lymphocyte; PBMCs: Peripheral blood mononuclear cells; MFI: Mean fluorescence intensity; MDDCs: Monocyte-derived dendritic cells; GM-CSF: Granulocyte-macrophage colony-stimulating factor; 4: Interleukin 4; IL-10: Interleukin 10; IFN-γ: Interferon-gamma; LPS: Lipopolysaccharide; DH: Hydrodynamic diameter; PI: Polydispersity index; PCS: Photon correlation spectroscopy; FACS: Fluorescence activated cell sorting.
Competing interests
The authors declare that they have no competing interests.
Authors’contributions
AP and CC conducted the experiments and wrote the first draft of the manuscript. MT, MN, KB, VC, ADS, MLT and FMB participated in planning the experimental strategy and helped in critical assessment of the data and drafting of the manuscript. FQ and LB provided advice on the theme of the manuscript, supervised the study, participated in data analysis and provided final approval of the manuscript. All authors have approved the final manuscript.
Acknowledgements
The study was funded by EU FP7 Project Cancer Vaccine development for Hepatocellular Carcinoma–HEPAVAC (Grant Nr. 602893) and Italian Ministry of Health through Institutional“Ricerca Corrente”. AP and MT are HEPAVAC fellows. FQ acknowledges Italian Ministry of University and Research (PRIN 2010H834LS) for financial support.
Author details
1
Laboratoy Molecular Biology and Viral Oncology, Department of
Experimental Oncology, Istituto Nazionale per lo Studio e la Cura dei Tumori
“Fondazione Pascale”- IRCCS, Via Mariano Semmola 142, 80131 Naples, Italy.
2Department of Pharmacy, University of Napoli Federico II, Via Domenico
Montesano 49, 80131 Naples, Italy.3Laboratory of Clinical Immunology, Istituto Nazionale per lo Studio e la Cura dei Tumori“Fondazione Pascale” -IRCCS, Via Mariano Semmola 142, 80131 Naples, Italy.4Laboratory of Tumor Progression, Istituto Nazionale per lo Studio e la Cura dei Tumori
“Fondazione Pascale”- IRCCS, Via Mariano Semmola 142, 80131 Naples, Italy.
5National Research Council Institutional Sustainable Plant Protection, Bari,
Italy.
Received: 8 July 2015 Accepted: 29 September 2015
References
1. Buonaguro L, Petrizzo A, Tornesello ML, Buonaguro FM. Translating tumor antigens into cancer vaccines. Clin Vaccine Immunol. 2011;18:23–34. 2. Koido S, Hara E, Homma S, Namiki Y, Ohkusa T, Gong J, et al. Cancer vaccine
by fusions of dendritic and cancer cells. Clin Dev Immunol. 2009;2009:657369. 3. Lesterhuis WJ, de Vries IJ, Adema GJ, Punt CJ. Dendritic cell-based vaccines in cancer immunotherapy: an update on clinical and immunological results. Ann Oncol. 2004;15 Suppl 4:iv145–51.
4. Ungaro F, Conte C, Quaglia F, Tornesello ML, Buonaguro FM, Buonaguro L. VLPs and particle strategies for cancer vaccines. Expert Rev Vaccines. 2013;12:1173–93.
5. Newman KD, Elamanchili P, Kwon GS, Samuel J. Uptake of poly(D, L-lactic-co-glycolic acid) microspheres by antigen-presenting cellsin vivo. J Biomed Mater Res. 2002;60:480–6.
6. Pinilla-Ibarz J, Cathcart K, Korontsvit T, Soignet S, Bocchia M, Caggiano J, et al. Vaccination of patients with chronic myelogenous leukemia with bcr-abl oncogene breakpoint fusion peptides generates specific immune responses. Blood. 2000;95:1781–7.
7. Rosalia RA, Cruz LJ, van Duikeren S, Tromp AT, Silva AL, Jiskoot W, et al. CD40-targeted dendritic cell delivery of PLGA-nanoparticle vaccines induce potent anti-tumor responses.Biomaterials. 2014;40:88-97.
8. Cruz LJ, Rosalia RA, Kleinovink JW, Rueda F, Lowik CW, Ossendorp F. Targeting nanoparticles to CD40, DEC-205 or CD11c molecules on dendritic cells for efficient CD8(+) T cell response: a comparative study. J Control Release. 2014;192:209–18.
9. Hamdy S, Haddadi A, Hung RW, Lavasanifar A. Targeting dendritic cells with nano-particulate PLGA cancer vaccine formulations. Adv Drug Deliv Rev. 2011;63:943–55.
10. Han R, Zhu J, Yang X, Xu H. Surface modification of poly(D, L-lactic-co-glycolic acid) nanoparticles with protamine enhanced cross-presentation of encapsulated ovalbumin by bone marrow-derived dendritic cells. J Biomed Mater Res A. 2011;96:142–9.
11. Ungaro F, d’Angelo I, Miro A, La Rotonda MI, Quaglia F. Engineered PLGA nano- and micro-carriers for pulmonary delivery: challenges and promises. J Pharm Pharmacol. 2012;64:1217–35.
12. Chen H, Li P, Yin Y, Cai X, Huang Z, Chen J, et al. The promotion of type 1 T helper cell responses to cationic polymersin vivovia toll-like receptor-4 mediated IL-12 secretion. Biomaterials. 2010;31:8172–80.
13. Wegmann F, Gartlan KH, Harandi AM, Brinckmann SA, Coccia M, Hillson WR, et al. Polyethyleneimine is a potent mucosal adjuvant for viral glycoprotein antigens. Nat Biotech. 2012;30:883–8.
14. Sneh-Edri H, Likhtenshtein D, Stepensky D. Intracellular targeting of PLGA nanoparticles encapsulating antigenic peptide to the endoplasmic reticulum of dendritic cells and its effect on antigen cross-presentationin vitro. Mol Pharm. 2011;8:1266–75.
15. Rothberg KG, Heuser JE, Donzell WC, Ying YS, Glenney JR, Anderson RG. Caveolin, a protein component of caveolae membrane coats. Cell. 1992;68:673–82.
16. Harding C, Heuser J, Stahl P. Receptor-mediated endocytosis of transferrin and recycling of the transferrin receptor in rat reticulocytes. J Cell Biol. 1983;97:329–39.
17. Buonaguro L, Tornesello ML, Tagliamonte M, Gallo RC, Wang LX, Kamin-Lewis R, et al. Baculovirus-derived human immunodeficiency virus type 1 virus-like particles activate dendritic cells and induceex vivoT-cell responses. J Virol. 2006;80:9134–43.
18. Maiolino S, Russo A, Pagliara V, Conte C, Ungaro F, Russo G, et al. Biodegradable nanoparticles sequentially decorated with Polyethyleneimine and Hyaluronan for the targeted delivery of docetaxel to airway cancer cells. J
Nanobiotechnology. 2015;13:29.
19. Bivas-Benita M, Romeijn S, Junginger HE, Borchard G. PLGA-PEI nanoparticles for gene delivery to pulmonary epithelium. Eur J Pharm Biopharm. 2004;58:1–6. 20. Mayor S, Pagano RE. Pathways of clathrin-independent endocytosis. Nat Rev
Mol Cell Biol. 2007;8:603–12.
21. Rosalia RA, Cruz LJ, van Duikeren S, Tromp AT, Silva AL, Jiskoot W, et al. CD40-targeted dendritic cell delivery of PLGA-nanoparticle vaccines induce potent anti-tumor responses. Biomaterials. 2015;40:88–97.
22. O’Garra A, Vieira P. T(H)1 cells control themselves by producing interleukin-10. Nat Rev Immunol. 2007;7:425–8.
23. Cope A, Le FG, Cardone J, Kemper C. The Th1 life cycle: molecular control of IFN-gamma to IL-10 switching. Trends Immunol. 2011;32:278–86. 24. Abramson O, Qiu S, Erle DJ. Preferential production of interferon-gamma by
CD4+ T cells expressing the homing receptor integrin alpha4/beta7. Immunology. 2001;103:155–63.
25. Coester C, Nayyar P, Samuel J.In vitrouptake of gelatin nanoparticles by murine dendritic cells and their intracellular localisation. Eur J Pharm Biopharm. 2006;62:306–14.
26. Maiolino S, Moret F, Conte C, Fraix A, Tirino P, Ungaro F, et al. Hyaluronan-decorated polymer nanoparticles targeting the CD44 receptor for the combined photo/chemo-therapy of cancer. Nanoscale. 2015;7:5643–53.
Submit your next manuscript to BioMed Central and take full advantage of:
• Convenient online submission • Thorough peer review
• No space constraints or color figure charges • Immediate publication on acceptance
• Inclusion in PubMed, CAS, Scopus and Google Scholar
• Research which is freely available for redistribution
Submit your manuscript at www.biomedcentral.com/submit