www.geosci-model-dev.net/6/1705/2013/ doi:10.5194/gmd-6-1705-2013
© Author(s) 2013. CC Attribution 3.0 License.
Geoscientific
Model Development
Intercomparison of temperature trends in IPCC CMIP5 simulations
with observations, reanalyses and CMIP3 models
J. Xu1, A. M. Powell Jr.2, and L. Zhao1,3
1Environmental Science and Technological Center, College of Science, George Mason University, Fairfax, Virginia, USA 2NOAA/NESDIS/STAR, Camp Springs, Maryland, USA
3Nanjing University of Information Science and Technology, Nanjing, China
Correspondence to: J. Xu ([email protected]) and A. M. Powell Jr. ([email protected])
Received: 4 October 2012 – Published in Geosci. Model Dev. Discuss.: 13 November 2012 Revised: 12 August 2013 – Accepted: 20 August 2013 – Published: 21 October 2013
Abstract. On the basis of the fifth Coupled Model Inter-comparison Project (CMIP5) and the climate model simu-lations covering 1979 through 2005, the temperature trends and their uncertainties have been examined to note the sim-ilarities or differences compared to the radiosonde obser-vations, reanalyses and the third Coupled Model Intercom-parison Project (CMIP3) simulations. The results show no-ticeable discrepancies for the estimated temperature trends in the four data groups (radiosonde, reanalysis, CMIP3 and CMIP5), although similarities can be observed.
Compared to the CMIP3 model simulations, the simula-tions in some of the CMIP5 models were improved. The CMIP5 models displayed a negative temperature trend in the stratosphere closer to the strong negative trend seen in the observations. However, the positive tropospheric trend in the tropics is overestimated by the CMIP5 models relative to CMIP3 models. While some of the models produce tempera-ture trend patterns more highly correlated with the observed patterns in CMIP5, the other models (such as CCSM4 and IPSL_CM5A-LR) exhibit the reverse tendency. The CMIP5 temperature trend uncertainty was significantly reduced in most areas, especially in the Arctic and Antarctic strato-sphere, compared to the CMIP3 simulations.
Similar to the CMIP3, the CMIP5 simulations overesti-mated the tropospheric warming in the tropics and Southern Hemisphere and underestimated the stratospheric cooling. The crossover point where tropospheric warming changes into stratospheric cooling occurred near 100 hPa in the trop-ics, which is higher than in the radiosonde and reanalysis data. The result is likely related to the overestimation of
convective activity over the tropical areas in both the CMIP3 and CMIP5 models.
Generally, for the temperature trend estimates associated with the numerical models including the reanalyses and global climate models, the uncertainty in the stratosphere is much larger than that in the troposphere, and the uncertainty in the Antarctic is the largest. In addition, note that the re-analyses show the largest uncertainty in the lower tropical stratosphere, and the CMIP3 simulations show the largest un-certainty in both the south and north polar regions.
1 Introduction
The fifth phase of the Coupled Model Intercomparison Project (CMIP5) provides quantitative data sets for estimat-ing climate change based on a suite of climate models (Tay-lor et al., 2012). Compared to the third phase of the Cou-pled Model Intercomparison Project (CMIP3), conventional atmosphere–ocean global climate models (AOGCMs) and Earth System Models of Intermediate Complexity (EMICs) are for the first time being joined by more recently developed Earth System Models (ESMs). The reliability of the new cli-mate model products is an important question for the clicli-mate change detection. Evaluating climate model results using ob-servational data sets is necessary to understand the capabili-ties and limitations of climate change simulations.
and understand the way it is represented in the model and how it interacts with the other modeled processes.
Temperature trend is an important component for measur-ing global climate change. It provides evidence of both natu-ral impacts and those from anthropogenic forcing. However, a lot of evidence is found in the literature (Santer et al., 1999; Seidel et al., 2004; Christy and Norris, 2006; Sakamoto and Christy, 2009; Xu and Powell, 2010) that the temperature trend estimation is sensitive to the data source (radiosondes, satellite observations, and reanalysis products). Radiosonde coverage extends back to the late 1950s. However, radioson-des only reach altitude levels below 20 hPa and do not pro-vide data over the ocean, Arctic and Antarctic zones. Also, due to discontinuous observations caused by instrumentation changes, the raw radiosonde record includes remarkable in-homogeneities (Lanzante et al., 2003; Seidel et al., 2004).
The first generation of reanalysis products created by National Centers for Environmental Prediction (NCEP), National Aeronautics and Space Administration (NASA) and European Centre for Medium-Range Weather Forecasts (ECMWF) was successfully used in the study of global at-mospheric and oceanic processes and their dynamics, espe-cially over the data-sparse poles, Southern Hemisphere, and ocean regions. The updated or second-generation reanalyses have been implemented by several weather and climate pre-diction centers. However, the reanalysis products showed a number of uncertainties and deficiencies (Kanamitsu et al., 2002; Trenberth, 2001).
Because of these and other difficulties involved with com-plex data implementation, observation systems, and process-ing algorithms, objectively identifyprocess-ing one or more reliable data sets is a difficult task. This paper compares three types of data sets with the CMIP5 simulations on the basis of the same fundamental analyses. The goal is to (1) compare the tem-perature trends in the CMIP5 simulations with radiosonde observations and reanalyses and (2) evaluate whether there has been an improvement from CMIP3 to CMIP5.
For the two purposes, an ensemble analysis for the tem-perature trends and spread will be implemented. The data sets used here are described in Sect. 2. The analysis includes intercomparisons between the stratosphere and troposphere (Sect. 3), and intercomparisons between the tropics, Arctic and Antarctic (Sect. 4). Section 5 provides a final summary.
2 Data and calculations
Three groups of data sets, including radiosonde observations, reanalysis products and the CMIP3 model simulations, are used to be compared to the CMIP5 climate model simula-tions. All data sets span the period from 1979 through 2005 and the levels between 850 and 30 hPa.
2.1 Reanalysis and radiosonde data sets
The eight reanalysis products used in this study include NCEP-R1, NCEP-R2, NCEP-CFSR, ERA40, ERA-Interim, JRA25, MERRA and 20CR. Detailed information about these reanalyses can be found in our previous publication (Xu and Powell, 2012). The five radiosonde data sets used in this study include HadAT2, RATPAC, IUK, RAOBCORE and RICH. More information about these radiosonde prod-ucts can also be found in our previous publication (Xu and Powell, 2010).
2.2 The CMIP3 simulations
The CMIP3 model simulations were introduced in the study by Meehl et al. (2007). To get a comparable number of cli-mate and reanalysis products, eight clicli-mate models (Table 1) were selected from the larger group and were matched with eight reanalyses using temperature fields from the Climate of the 20th Century experiments (20C3M) (selected from 1979 through 1999) and the committed climate change experiment (COMMIT) (selected from 2000 through 2005).
2.3 The CMIP5 simulations
Similar to the CMIP3 experiments, the CMIP5 simulations provide a framework for coordinated climate change experi-ments aimed at evaluating climate simulations of the recent past, providing projections of climate change, and quanti-fying climate feedbacks (Taylor et al., 2012). Compared to CMIP3, the climate models used in CMIP5 generally are more comprehensive in the processes they include and are of higher spatial resolution. Corresponding to the selected CMIP3 models, eight models from the same group (Table 1) in the “historical” run of CMIP5 are used in this study. The “historical” run (1860–2005) is forced by observed atmo-spheric composition changes (reflecting both anthropogenic and natural sources) including time-evolving land cover. Each of the CMIP3 and CMIP5 models has been run with different ensemble members, but only one of the ensemble members (r1i1p1) from each model is used here.
2.4 Trend calculation
The annually averaged data are first calculated based on the monthly data sets listed above. In order to be consistent with the radiosonde data set locations, zonal means are calcu-lated from the annual data by selecting areas over land only. The zonal means are calculated with a resolution of 10◦
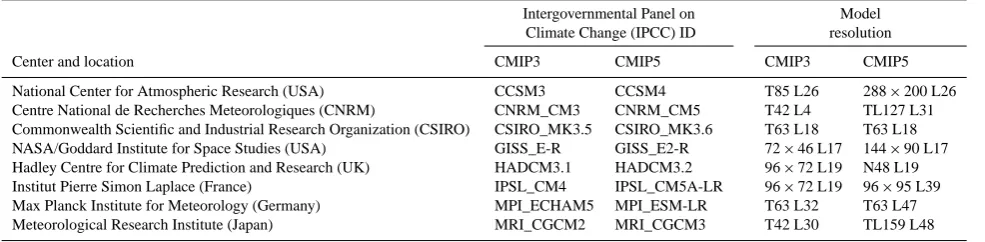
Table 1. Lists of the CMIP3 and CMIP5 model simulations.
Intergovernmental Panel on Model
Climate Change (IPCC) ID resolution
Center and location CMIP3 CMIP5 CMIP3 CMIP5
National Center for Atmospheric Research (USA) CCSM3 CCSM4 T85 L26 288×200 L26
Centre National de Recherches Meteorologiques (CNRM) CNRM_CM3 CNRM_CM5 T42 L4 TL127 L31
Commonwealth Scientific and Industrial Research Organization (CSIRO) CSIRO_MK3.5 CSIRO_MK3.6 T63 L18 T63 L18
NASA/Goddard Institute for Space Studies (USA) GISS_E-R GISS_E2-R 72×46 L17 144×90 L17
Hadley Centre for Climate Prediction and Research (UK) HADCM3.1 HADCM3.2 96×72 L19 N48 L19
Institut Pierre Simon Laplace (France) IPSL_CM4 IPSL_CM5A-LR 96×72 L19 96×95 L39
Max Planck Institute for Meteorology (Germany) MPI_ECHAM5 MPI_ESM-LR T63 L32 T63 L47
Meteorological Research Institute (Japan) MRI_CGCM2 MRI_CGCM3 T42 L30 TL159 L48
3 Intercomparison of temperature trends between the stratosphere and troposphere
3.1 Vertical structure
In terms of the linear least squares fitting of the tempera-ture time series in the period from 1979 through 2005 for the four data groups, Fig. 1 displays the vertical and latitudinal distribution of the temperature trend for the levels between 850 hPa and 30 hPa.
First, the vertical and latitudinal distribution of temper-ature trends in all five radiosonde data sets (left panel in Fig. 1) match quite well. Strong maximum cooling is clearly observed in the tropical and subtropical stratosphere, while strong warming appeared in the lower troposphere in the northern middle and high latitudes and the tropical upper tro-posphere. The temperature trend switched from positive to negative at approximately 150 hPa. The strongest warming in RAOBCORE was on the order of 0.5◦C decade−1, which
occurred in the lower northern high latitudes and was higher than that in the other four radiosonde data sets. The largest cooling trend in the stratosphere reached−1.2◦C decade−1 in the southern tropical stratosphere in IUK. The results con-firmed the high consistency among the five radiosonde data sets revealed in our previous study (Xu and Powell, 2012), although there are some differences in these five data sets. Unfortunately, based on current understanding, we cannot identify which one is closest to the true observational tem-perature.
Second, within the group of reanalysis (left middle panel in Fig. 1), 20CR and JRA25 reanalyses do not display the feature of tropospheric warming and stratospheric cooling that is consistently seen in the other six reanalyses. The max-imum cooling on the order of−1.6◦C decade−1in the
tropi-cal tropopause layer is observed in the R1 and NCEP-R2, which is a much stronger cooling than in the other six reanalyses and all the radiosonde observations. Relatively strong warming appeared in the upper tropical troposphere in the ERA40 and NCEP-CFSR, while the warming at the lower tropospheric northern high latitudes is comparable to the magnitude in the radiosondes. Note that the cooling in the
northern stratosphere in 20CR shows abnormal values com-pared to the other seven reanalyses. It is worth noting that significant discrepancies can be found between the different reanalyses, and it is hard to say which one best reproduces the true atmospheric trends even with the new data sets and algo-rithms used in new data assimilation systems. For example, the NCEP-CFSR is a new generation data assimilation sys-tem from NCEP developed from NCEP-R1 and NCEP-R2. However, according to the radiosonde observation measure-ments, the NCEP-CFSR reanalysis overestimated the tropo-spheric warming compared to the previous system in NCEP-R1 or NCEP-R2.
Third, the CMIP3 simulations (right middle panel in Fig. 1) show a similar transition from tropospheric warm-ing to stratospheric coolwarm-ing in all eight models except for the tropical zone in the CNRM_CM3 and the high lati-tudes in IPSL_CM4 and MRI_CGCM2. However, four of the eight models (CCSM3, CNRM_CM3, CSIRO_MK3.5 and UKMO_HADCM3.1) indicated relatively strong strato-spheric cooling outside the tropical and subtropical areas, in contrast to the radiosonde observations.
Compared to the CMIP3 simulations, the CMIP5 simu-lations (right panel in Fig. 1) display a better vertical and latitudinal structure, and all eight models show a relatively strong cooling in the tropical and subtropical stratosphere, which matches the distribution in the radiosonde observa-tions. Similar to the reanalysis and CMIP3 simulations, the CMIP5 simulations portrayed stronger warming in the upper tropical troposphere than in the radiosonde data sets.
The statistical significance at the 99 % level, according to at test (the line with the value of ±2.5 in Fig. 1), shows that the trends are believable in most of the troposphere and stratosphere. However, the significance cannot be found in the tropopause layer.
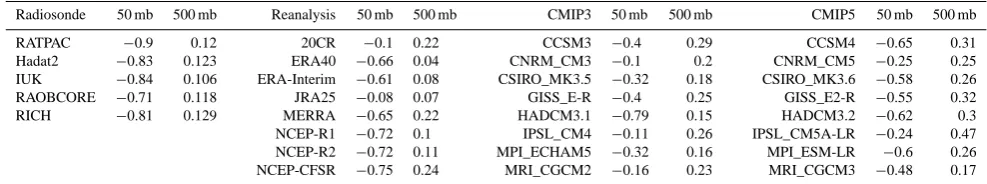
Table 2. Global mean temperature trends in the stratosphere (50 hPa) and the troposphere (500 hPa) in the four data set groups.
Radiosonde 50 mb 500 mb Reanalysis 50 mb 500 mb CMIP3 50 mb 500 mb CMIP5 50 mb 500 mb
RATPAC −0.9 0.12 20CR −0.1 0.22 CCSM3 −0.4 0.29 CCSM4 −0.65 0.31
Hadat2 −0.83 0.123 ERA40 −0.66 0.04 CNRM_CM3 −0.1 0.2 CNRM_CM5 −0.25 0.25
IUK −0.84 0.106 ERA-Interim −0.61 0.08 CSIRO_MK3.5 −0.32 0.18 CSIRO_MK3.6 −0.58 0.26
RAOBCORE −0.71 0.118 JRA25 −0.08 0.07 GISS_E-R −0.4 0.25 GISS_E2-R −0.55 0.32
RICH −0.81 0.129 MERRA −0.65 0.22 HADCM3.1 −0.79 0.15 HADCM3.2 −0.62 0.3
NCEP-R1 −0.72 0.1 IPSL_CM4 −0.11 0.26 IPSL_CM5A-LR −0.24 0.47
NCEP-R2 −0.72 0.11 MPI_ECHAM5 −0.32 0.16 MPI_ESM-LR −0.6 0.26
NCEP-CFSR −0.75 0.24 MRI_CGCM2 −0.16 0.23 MRI_CGCM3 −0.48 0.17
(3) Compared to the CMIP3 simulations, the CMIP5 simu-lations display a relatively strong cooling in the tropical and subtropical stratosphere, which matches the distribution in the radiosonde observations. (4) The height of the crossover point where tropospheric warming changes into stratospheric cooling depends on the individual data set, ranging from
∼100 hPa in the tropics to∼200 hPa in the extratropics.
3.2 Similarities and differences
To quantify similarities and differences between these data sets, the global mean temperature trend and spatial correla-tions between model simulacorrela-tions and observacorrela-tions were cal-culated. The mean of all five radiosonde data sets is used to represent the observations.
In the troposphere (500 hPa), the radiosonde global mean temperature trends range from 0.11◦C decade−1 to 0.13◦C decade−1 (Table 2), which reflects consistency among the radiosonde data sets. The trends in the reanal-ysis group show a significant divergence, with the largest warming reaching 0.24◦C decade−1 in the NCEP-CFSR
while the trend value goes down to 0.04◦C decade−1in the ERA40. However, compared to the radiosondes, the ues in all eight CMIP3 simulations are increased, with val-ues from 0.15◦C decade−1in HADCM3 to 0.29◦C decade−1 in CCSM3. The magnitude of the warming in the CMIP5 simulations is higher than the CMIP3 simulations, except for the MRI model, and the temperature trend ranges from 0.17◦C decade−1 in MRI-CGCM3 to 0.47◦C decade−1 in IPSL_CM5A-LR.
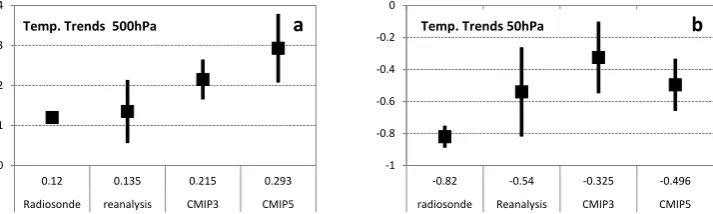
The mean trend and standard error show (Fig. 2a) that the tropospheric mean trend in the CMIP5 (0.293◦C decade−1) is much larger than in the radiosonde observations (0.12◦C decade−1) and the CMIP3 simulations
(0.215◦C decade−1), while the divergence in the eight
CMIP5 models is also larger than the other three data groups. In other words, the CMIP5 simulations show not only the greatest tropospheric warming, but also the largest uncertainty in the temperature trend estimation.
In contrast, in the stratosphere (50 hPa), the cool-ing trends in all the radiosonde data sets are larger than −0.70◦C decade−1 (Table 2), which shows a strong similarity among the five radiosonde data sets. Most
of the reanalyses have a cooling trend larger than
−0.60◦C decade−1, except for the estimations from the 20CR and JRA25. However, the cooling trends in the CMIP3 simulations are significantly reduced, except for the HADCM3 model, and five of the eight CMIP5 models show that their cooling trend exceeds−0.50◦C decade−1, which is closer to the radiosonde observations than the cooling trends of the CMIP3 simulations. It is worth noting that the un-certainty in the stratospheric cooling trend estimates in the CMIP5 models is significantly decreased (Fig. 2b).
Similar to the CMIP3, the CMIP5 simulations overesti-mate the tropospheric warming and underestioveresti-mate the strato-spheric cooling, although the stratostrato-spheric estimates are improved in comparison with the radiosonde observations (Fig. 2a and b). In addition, the large uncertainty in the strato-spheric cooling trend estimates in the reanalysis group is mainly due to the 20CR and JRA25.
Furthermore, the spatial correlations between the model simulations and the radiosonde observations indicate (Fig. 3) that the temperature trend in most of the reanalyses is in very good agreement with the radiosonde observations in both the stratosphere (100–30 hPa) and troposphere (850–300 hPa), but the stratospheric trends in the 20CR, ERA40 and JRA25 significantly differ from the observations (Fig. 3a). The CMIP3 simulations (Fig. 3b) have a worse structure than the analyses, especially in the stratosphere; four of the eight models show negative correlations with the radiosonde ob-servations. The correlations of the CMIP5 simulations with the radiosonde observations (Fig. 3c) in the stratosphere are higher than those in the previous version regarding the CMIP3 simulations, except for CCSM4 and IPSL_CM5A-LR (Fig. 3b). However, three of the eight CMIP5 models in the troposphere have negative correlations with the ra-diosonde observations.
-1 -0.8 -0.6 -0.4 -0.2 0
-0.82 -0.54 -0.325 -0.496 radiosonde Reanalysis CMIP3 CMIP5
Temp. Trends 50hPa
0 0.1 0.2 0.3 0.4
0.12 0.135 0.215 0.293 Radiosonde reanalysis CMIP3 CMIP5
Temp. Trends 500hPa
a
b
Fig. 2. The global mean temperature trends (◦C decade−1) and standard deviations for the four data groups in the period of 1979–2005. (a) 500 hPa; (b) 50 hPa.
-1 -0.8 -0.6 -0.4 -0.2 0 0.2 0.4 0.6 0.8 1
Spatial Correlation of Temperature Trends
stratosphere troposphere
a b c
Fig. 3. The spatial correlation of temperature trends between reanalysis, CMIP3, CMIP5 and the radiosonde mean trends from 1979 to 2005. (a) Reanalysis; (b) CMIP3; (c) CMIP5.
also the largest uncertainty in the temperature trend esti-mates. The large uncertainty is mainly from CNRM_CM5 and IPSL_CM5A-LR. Based on the spatial correlation anal-ysis, most of the CMIP5 simulations have higher correlations in the stratosphere but lower ones in the troposphere com-pared to the CMIP3 simulations.
4 Intercomparison between tropics, Arctic and Antarctic
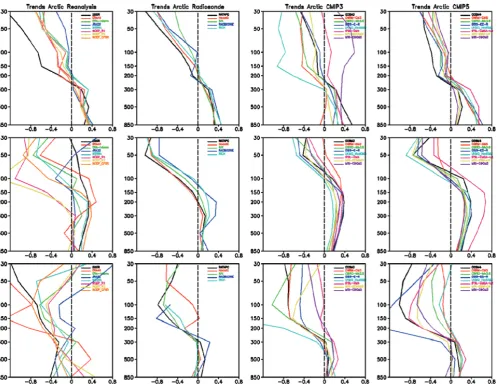
Figure 4 shows the vertical profiles of the temperature trend that represents the three latitudinal bands, including the Arc-tic (60–90◦N), tropics (15◦S–15◦N) and Antarctic (60– 90◦S), in the four data groups. The distribution is zonally averaged, and the period of 1979–2005 is used with altitudes ranging from 850 to 30 hPa. The five radiosonde data sets agree reasonably well with each other in the Arctic and trop-ics (Fig. 4a and e) in both the troposphere and stratosphere. However, a large discrepancy can be found in the Antarctic (Fig. 4i), where the Hadat2 shows a noticeable difference to the other two available data sets in the stratosphere.
For the reanalyses, the trends in the tropics and Antarc-tic (Fig. 4f and j) display a large divergence, and the dis-crepancy among the eight reanalyses is much larger than shown in the radiosondes. In the tropical tropopause layer (∼100 hPa), the trend ranges from∼0.3◦C decade−1in the
ERA40 to∼ −1.4◦C decade−1in the R1 and NCEP-R2 (Fig. 4f). In the tropics, the JRA25 shows a signifi-cant warming in the stratosphere, while the 20CR exhibits a warming in the study domain from the troposphere to strato-sphere. In the Antarctic (Fig. 4j), most of the reanalyses show cooling in the troposphere, except for the ERA40, and the warming trend is observed again in the stratosphere in JRA25. However, the trends are highly consistent in the Arc-tic except for the 20CR reanalysis (Fig. 4b).
For the CMIP3 simulations, the trends are in very good agreement in the tropics (Fig. 4g) but don’t show similar agreement in the stratosphere in both polar areas (Fig. 4c and k). For example, in the Arctic, the CNRM_CM3 and MRI_CGCM2 simulations display a warming in the strato-sphere compared to a cooling in the other six models (Fig. 4c), with the UKMO_HadCM3 simulation having the most extreme stratospheric cooling of−1.4◦C decade−1 in the Antarctic (Fig. 4k). Compared to the CMIP3 simulations, the CMIP5 simulations have very good agreement in the three selected regions (Fig. 4d, h and l), except for a strong cooling (−1.4◦C decade−1) in the Antarctic lower
strato-sphere in the GISS_E2-R simulation (Fig. 4l) and a strong warming (0.7◦C decade−1) in the tropical upper troposphere
Fig. 4. Vertical profiles of the trends (◦C decade−1) for the Arctic, tropic and Antarctic temperature from 1979 through 2005. Arctic: (a) radiosonde, (b) reanalysis, (c) CMIP3 and (d) CMIP5; tropics: (e) radiosonde, (f) reanalysis, (g) CMIP3 and (h) CMIP5; Antarctic: (i) radiosonde, (j) reanalysis, (k) CMIP3 and (l) CMIP5.
uncertainty in the CMIP5 models has improved, especially in the stratosphere.
Furthermore, the vertical profile of the ensemble mean and spread shows (Fig. 5) that there is a clear difference among the three regions in the vertical trend structure (Fig. 5a–d) and the ensemble spreads (Fig. 5e–h). First, in the radioson-des, the strongest positive trends appear in the lower tropo-spheric Arctic zone and the negative trends occur in the trop-ical middle stratosphere (Fig. 5a). In contrast, in the reanal-yses, the whole atmospheric layer in the Antarctic shows a cooling, with the coldest trend occurring in the lower strato-sphere (Fig. 5b). The tropospheric vertical trend profile in the Antarctic looks reasonable in the CMIP3 simulations (Fig. 5c) but the stratospheric cooling is much higher than in the radiosonde and reanalysis data sets. In the CMIP5 simu-lations, the vertical trend structure in the Antarctic is slightly improved, but the upper tropospheric warming exceeds the
other three data groups (Fig. 5d). Second, the crossover point that expresses the transition from tropospheric warming to stratospheric cooling is largely different in the tropics. The crossover point in the CMIP3 and CMIP5 simulations occurs near 100 hPa, which is higher than in the radiosondes and reanalyses. The high crossover point is likely related to an overestimation of convective activity over the tropical areas in both the CMIP3 and CMIP5 models.
a b c d
e f g h
Fig. 5. Vertical profiles of the ensemble mean trends and spreads (◦C decade−1) for the Arctic, tropic and Antarctic temperature from 1979 through 2005. Ensemble mean trends: (a) radiosonde, (b) reanalysis, (c) CMIP3 and (d) CMIP5; ensemble spread trends: (e) radiosonde, (f) reanalysis, (g) CMIP3 and (h) CMIP5.
ERA40, and JRA25. Note that the uncertainty of the trend in the Antarctic is much larger than the Arctic in the strato-sphere. In the CMIP3 simulations, the trends (Fig. 5g) show a substantial spread with 0.8◦C decade−1 in the Antarctic stratosphere. The spread at both poles is significantly reduced in the CMIP5 simulations (Fig. 5h). It is worth noting that the spread in the tropics retains similar values in the CMIP3 and CMIP5 simulations. This result implies that the uncertainty in the CMIP5 simulations over the Arctic and Antarctic has significantly improved compared to the CMIP3 simulations. In summary, the CMIP5 model trend uncertainty in the Arctic and Antarctic zones in the stratosphere is improved compared to the CMIP3 models. The crossover point in the CMIP3 and CMIP5 simulations occurs near 100 hPa, which is higher than in the radiosonde and reanalysis data sets. The result is likely related to overestimated convective activity over the tropical areas in both the CMIP3 and CMIP5 mod-els.
5 Summary and discussion
5.1 Summary
Temperature trends were analyzed for four data groups (ra-diosonde, reanalysis, CMIP3 and CMIP5) over the period 1979 through 2005 and at levels between 850 and 30 hPa, and the results are summarized as follows:
1. The temperature trends show a noticeable discrep-ancy in the four data groups, although similarities can be observed. Most of the data sets exhibit a sharp cooling (∼ −1.0◦C decade−1) in the tropical and subtropical stratosphere and a strong warming (∼0.6◦C decade−1) in the lower troposphere in the
northern middle and high latitudes and the tropical upper troposphere. The CMIP5 simulations display a relatively strong cooling in the tropical and subtropi-cal stratosphere, which matches the distribution in the radiosonde observations.
2. Similar to the CMIP3, CMIP5 models overestimate the tropospheric warming and underestimate the strato-spheric cooling. The eight CMIP5 simulations show not only the largest tropospheric warming, but also the largest uncertainty in the estimated temperature trend. The uncertainty in the CMIP5 simulations has improved in the stratosphere but is worse in the tropo-sphere compared to the CMIP3 simulations.
4. The trend uncertainty in the stratospheric Arctic and Antarctic zones among CMIP5 models has improved compared to the CMIP3 models. The crossover point in the CMIP3 and CMIP5 simulations occurs near 100 hPa in the tropics, which is higher than in the ra-diosonde and reanalysis data sets. The result is likely related to overestimation of the convective activity over the tropical areas in both CMIP3 and CMIP5 models.
5.2 Discussion
The results of this study appear to have achieved the two goals presented in Sect. 1, including (1) evaluation of the temperature trends in the CMIP5 simulations in comparison with radiosonde observations and reanalyses and (2) evalua-tion of the improvement of CMIP5 simulaevalua-tions compared to CMIP3.
1. Compared to the radiosondes, CMIP5 overestimates tropospheric warming, and the tropospheric warm-ing shows significant differences in the different re-gions; for example, the CMIP5 simulation shows an extreme warming in the tropical upper troposphere in the IPSL_CM5A-LR compared to the other mod-els. Meanwhile, it is worth noting that the trend range in the stratospheric Arctic and Antarctic zone among the CMIP5 models is significantly reduced. When the CMIP5 simulations are compared to reanalysis, we should note that although reanalysis is recognized as one of the best data sets for understanding atmo-spheric dynamic processes by previous studies, un-certainties exist in the reanalysis data sets, for exam-ple, the large discrepancy of the stratospheric cool-ing trend estimates in the 20CR and JRA25 reanal-yses. In addition, the CMIP5 models have their own tropospheric variability that is not expected to exactly match past reanalysis in any detail. Some internal cli-mate variabilities in the reanalysis data sets, such as El Niño/Southern Oscillation (ENSO) and Madden– Julian Oscillation (MJO), are not completely repre-sented in the CMIP5 simulations, which might obscure the intercomparison. So we should consider how we can best use reanalysis products to help us to enable better evaluation of climate model simulations. 2. Compared to CMIP3, CMIP5 models are more
prehensive and are of higher spatial resolution com-pared to CMIP3. Five of the eight CMIP5 models show that their cooling trends exceed −0.50◦C decade−1 in the stratosphere, which is closer to the radiosonde observations than the cooling trends of the CMIP3 simulations. However, the CMIP5 simulations over-estimate the tropospheric warming and underesti-mate the stratospheric cooling, although the strato-spheric estimates have improved in comparison with
the radiosonde observations. Note that all the selected CMIP5 models are coupled with land and ocean mod-els including many kinds of physical processes fo-cusing on the lower atmosphere, which is theoreti-cally beneficial for describing the tropospheric atmo-sphere. Unfortunately, the above comparison shows that these CMIP5 model simulations provide a worse result in the troposphere for the global mean tem-perature trend. The results warn us to develop more comprehensive processes to reduce the uncertainty in model simulation in the troposphere. Meanwhile, it is necessary to improve representation of the stratosphere with higher vertical resolution and higher model tops, and/or with improved stratospheric chemical processes for improvement of simulation of stratospheric tem-perature trends. Given the differences noted, it remains an open question what the key factor(s) are that affect the performance of a climate model.
Acknowledgements. The NCAR, DOE and NCEP-CFSR reanalysis data were obtained from NCDC. The 20CR reanal-ysis data were obtained from NCAR. The ERA-40 and ERA-interim reanalysis data were obtained from the ECMWF; JRA-25 reanaly-sis was obtained from Japan Meteorological Agency: MERRA re-analysis was obtained from NASA. The HADAT2, RAOBCORE and RICH radiosonde data sets were obtained from the Met Office Hadley Centre website and RATPAC was obtained from NOAA. The Program for Climate Model Diagnosis and Intercomparison (PCMDI) collected and archived the model data. The authors would like to thank these agencies for providing the data.
This work was supported by the National Oceanic and Atmo-spheric Administration (NOAA), National Environmental Satellite, Data, and Information Service (NESDIS), Center for Satellite Applications and Research (STAR). The views, opinions, and findings contained in this publication are those of the authors and should not be considered an official NOAA or US Government position, policy, or decision.
Edited by: H. Garny
References
Christy, J. R. and Norris, W. B.: Satellite and VIZ–radiosonde inter-comparisons for diagnosis of nonclimatic influences, J. Atmos. Oceanic Technol., 23, 1181–1194, 2006.
Kanamitsu, M., Ebisuzaki, W., Woollen, J., Yang, S. K., Hnilo, J. J., Fiorino, M., and Potter, G. L.: NCEP–DOE AMIP-II Reanalysis (R-2), Bull. Amer. Meteor. Soc., 83, 1631–1643, 2002.
Lanzante, J. R., Klein, S. A., and Seidel, D. J.: Temporal homoge-nization of monthly radiosonde temperature data, Part I: Method-ology, J. Climate, 16, 224–240, 2003.
Sakmoto, M. and Christy, J.: The influences of TOVS radiance assimilation on temperature and moisture tendencies in JRA-25 and ERA-40, J. Atmos. Oceanic Technol., 26, 1435–1455, doi:10.1175/2009JTECHA1193.1, 2009.
Santer, B. D., Hnilo, J. J., Wigley, T. M. L., Boyle, J. S., Doutriaux, C., Fiorino, M., Parker, D. E., and Taylor, K. E.: Uncertainties in observationally based estimates of temperature change in the free atmosphere, J. Geophys. Res., 104, 6305–6333, 1999. Seidel, D. J., Angell, J. K., Christy, J., Free, M., Klein, S. A.,
Lanzante, J. R., Mears, C., Parker, D., Schabel, M., Spencer, R., Sterin, A., Thorne, P., and Wentz, F.: Uncertainty in sig-nals of large scale climate variations in radiosonde and satel-lite upper air temperature data sets, J. Climate, 17, 2225–2240, doi:10.1175/1520-0442, 2004.
Taylor, K. E., Stouffer, R. J., and Meehl, G. A.: An Overview of CMIP5 and the Experiment Design, Bull. Amer. Meteor. Soc., 93, 4850–498, doi:10.1175/BAMS-D-11-00094.1, 2012. Trenberth, K. E., Stepaniak, D. P., Hurrell, J. W., and Fiorino, M.:
Quality of Reanalyses in the tropics, J. Climate, 14, 1499–1510, 2001.
Xu, J. and Powell, A.: Ensemble Spread and Its Implication for the Evaluation of Temperature Trends from Multiple Radioson-des and Reanalyses Products, Geophy. Res. Lett., 37, L17704, doi:10.1029/2010GL044300, 2010.