R E S E A R C H
Open Access
Classifying and characterizing the
development of adaptive behavior in a
naturalistic longitudinal study of young
children with autism
Cristan Farmer
1, Lauren Swineford
1,2, Susan E. Swedo
1and Audrey Thurm
1*Abstract
Background:Adaptive behavior, or the ability to function independently in ones’environment, is a key phenotypic construct in autism spectrum disorder (ASD). Few studies of the development of adaptive behavior during preschool to school-age are available, though existing data demonstrate that the degree of ability and impairment associated with ASD, and how it manifests over time, is heterogeneous. Growth mixture models are a statistical technique that can help parse this heterogeneity in trajectories.
Methods:Data from an accelerated longitudinal natural history study (n= 105 children with ASD) were subjected to growth mixture model analysis. Children were assessed up to four times between the ages of 3 to 7.99 years. Results:The best fitting model comprised two classes of trajectory on the Adaptive Behavior Composite score of the Vineland Adaptive Behavior Scale, Second Edition—a low and decreasing trajectory (73% of the sample) and a moderate and stable class (27%).
Conclusions:These results partially replicate the classes observed in a previous study of a similarly characterized sample, suggesting that developmental trajectory may indeed serve as a phenotype. Further, the ability to predict which trajectory a child is likely to follow will be useful in planning for clinical trials.
Keywords:Autism spectrum disorders, Adaptive behavior, Longitudinal studies
Background
Autism spectrum disorder (ASD) is typically life-long, with impairments stemming from core symptoms that present early in development [1, 2]. ASD is frequently associated with intellectual disability [3], a diagnosis which requires deficits in adaptive behavior. However, regardless of cognitive function, individuals with ASD display deficits in adaptive functioning, both in the do-mains most directly affected by the core symptoms of ASD (e.g., socialization and communication) [4] and also more generally [5]. As such, adaptive functioning deficits have long been used to quantify the impairments in func-tioning required for the ASD diagnosis [6, 7] and to track
changes in functioning [8], including in the early years [9] (see [10] for a historical review in individuals with ASD and intellectual disability).
Adaptive function has been discussed as a promising outcome measure for a variety of neurodevelopmental and neuropsychiatric conditions [11–14] because it has clinical significance for both families and researchers [15]. Adaptive behavior has been used rarely as a pri-mary outcome in treatment research (e.g., [16]), though it appears listed amongst secondary outcomes in a num-ber of trials. These include double-blind, placebo-controlled drug studies [17, 18] as well as studies that include behavioral interventions [19]. Some of these studies used independent evaluators, blind to treatment group, to conduct the interviews with parents or care-givers [20, 21], while others use the parent rating form in an unblinded fashion (e.g., [22]). In fact, there has * Correspondence:[email protected]
1Pediatrics and Developmental Neuroscience Branch, National Institute of
Mental Health, National Institutes of Health, Bethesda, MD 20892, USA Full list of author information is available at the end of the article
been enough interest that researchers are investigating the best statistical methods for detecting change in adaptive functioning for future trials [23].
Most of our knowledge about adaptive behavior in in-dividuals with ASD comes from cross-sectional studies, which suggest ASD-specific profiles that vary with fac-tors such as age and IQ [15]. However, recently pub-lished data are making increasingly apparent that some phenotypic characteristics may be less stable over time than previously assumed [24]. This is based on the slower-than-expected, but not negligible, growth in skills as children age. Thus, it may not be the snapshot-in-time that best describes an individual, but rather his or her change over time; in other words, developmental trajectories themselves could serve as phenotypes [25].
We know less about the development of adaptive behav-ior in ASD than we do about its snapshot-in-time presen-tation, especially across longer periods during early to middle childhood. This dearth exists because there have been very few longitudinal studies of ASD beginning in the preschool period, and even fewer that report on longi-tudinal measurement of adaptive functioning. Available data indicate that on average, adaptive behavior deficits seem to persist into adulthood (for a review see [8]), and adaptive behavior in ASD is heterogeneous and variable, even within an individual. While adaptive behavior impair-ment has a generally predictable relationship with cogni-tive ability in samples of individuals with intellectual disability, the relationship appears to be more complicated
in individuals with ASD. Children with ASD who do not have intellectual disability may still have impaired adaptive function [5], while individuals with both ASD and intellec-tual disability may have relatively less impairment in adap-tive function compared to their level of cogniadap-tive impairment [26].
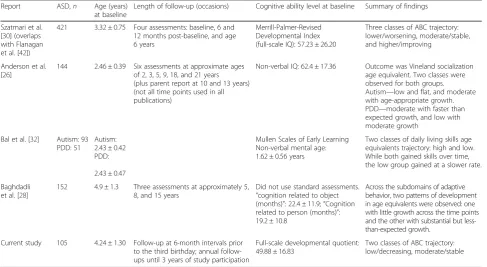
Some longitudinal studies have attempted to parse samples based on this heterogeneity, though for the most part, their sample sizes were small, they used few assessment points or limited age ranges, and/or they were focused on very specific domains of adaptive be-havior (see Table 1). One useful statistical method for the empirical description of heterogeneous data is growth mixture models (GMM), which provide a richer understanding of the data than do standard growth curve models [27]. The most basic form of these models, latent class growth curve analysis (LCGA, known by
other names, such as a “semi-parametric and
group-based approach” and by the name of the program often used to implement it, Proc Traj), has been used in a handful of investigations of within-subject adaptive be-havior development in ASD. In one study, investigators analyzed three assessments (5, 8, and 15 years of age) from 152 individuals with ASD, finding evidence for two patterns of development in age equivalents of adaptive behavior domains: one with little growth across the time points, and the other with substantial but less-than-expected growth [28]. Another study of approximately 85 individuals, assessed between the ages of 2 and
Table 1Vineland trajectory study summaries
Report ASD,n Age (years)
at baseline
Length of follow-up (occasions) Cognitive ability level at baseline Summary of findings
Szatmari et al. [30] (overlaps with Flanagan et al. [42])
421 3.32 ± 0.75 Four assessments: baseline, 6 and 12 months post-baseline, and age 6 years
Merrill-Palmer-Revised Developmental Index (full-scale IQ): 57.23 ± 26.20
Three classes of ABC trajectory: lower/worsening, moderate/stable, and higher/improving
Anderson et al. [26]
144 2.46 ± 0.39 Six assessments at approximate ages of 2, 3, 5, 9, 18, and 21 years (plus parent report at 10 and 13 years) (not all time points used in all publications)
Non-verbal IQ: 62.4 ± 17.36 Outcome was Vineland socialization age equivalent. Two classes were observed for both groups. Autism—low and flat, and moderate with age-appropriate growth. PDD—moderate with faster than expected growth, and low with moderate growth
Bal et al. [32] Autism: 93 PDD: 51
Autism: 2.43 ± 0.42 PDD:
2.43 ± 0.47
Mullen Scales of Early Learning Non-verbal mental age: 1.62 ± 0.56 years
Two classes of daily living skills age equivalents trajectory: high and low. While both gained skills over time, the low group gained at a slower rate.
Baghdadli et al. [28]
152 4.9 ± 1.3 Three assessments at approximately 5, 8, and 15 years
Did not use standard assessments.
“cognition related to object (months)”: 22.4 ± 11.9;“Cognition related to person (months)”: 19.2 ± 10.8
Across the subdomains of adaptive behavior, two patterns of development in age equivalents were observed: one with little growth across the time points and the other with substantial but less-than-expected growth.
Current study 105 4.24 ± 1.30 Follow-up at 6-month intervals prior to the third birthday; annual follow-ups until 3 years of study participation
Full-scale developmental quotient: 49.88 ± 16.83
Two classes of ABC trajectory: low/decreasing, moderate/stable
19 years, revealed the same two patterns of develop-ment, this time in the daily living skills domain [29]. Using an overall standard score measure of adaptive be-havior, findings from four assessments of an inception sample of 406 children with ASD suggested low/worsen-ing, moderate/stable, and average/improving trajectories over the period of 3 to 6 years of age [30].
Current study
The goal of this longitudinal study (NCT00298246) was to identify subtypes of ASD based on medical and behavioral phenotypes. Adaptive behavior was a key construct which we expected to differentiate the partici-pants, but this specific analysis was not proposed a priori. Rather, we set out to replicate and extend previ-ous research on the heterogeneity of adaptive behavior in individuals with ASD, using more advanced statistical models and a study population unique in its age at as-sessment, density of assessments, and length of follow-up. In the current analysis, we use GMM to explain the heterogeneity in development of adaptive behavior in children with ASD. We hypothesized that this mixture model would better fit the data than a standard latent curve model, suggesting that variability in trajectories is better explained by two or more subpopulations, rather than one.
Methods
Participants and procedures
Informed consent for participation was obtained from the parents or legal guardians of participants, who were enrolled in a longitudinal natural history study of autism approved by an NIH Institutional Review Board (06-M-0102). Participants were recruited from the community based on diagnosed or suspected ASD. Recruitment sources included medical, educational, and other service providers, as well as general announcements. The study period was between 2006 and 2014. The primary inclu-sionary criterion was a DSM-IV-TR [1] diagnosis of aut-istic disorder, based on the gold standard diagnostic battery described below. Exclusionary criteria for this study were a primary language other than English, cere-bral palsy, or unmanageable behavior problems that pre-vented participation in standardized testing procedures. A total of 106 participants with ASD were enrolled. Smaller groups with non-ASD developmental delay and typical development were enrolled but are not reported here.
The design of the study was accelerated longitudinal; at enrollment, participants were between the ages of 18 months and 7 years, exclusive (mean ± SD = 4.05 ± 1.28 years). Visits prior to the third birthday were spaced at 6-month intervals, and later visits were annual until the child completed at least 3 years of participation or
until the child’s fifth birthday. For this analysis, data were restructured into a“wide”format (i.e., 1-year bands starting at 24 months). If an individual had more than one visit per age band, the earlier visit was retained.
Measures
Participants were evaluated by expert doctoral-level clini-cians who met research reliability standards on the Aut-ism Diagnostic Interview-Revised (ADI-R; [31]) and the Autism Diagnostic Observation Schedule (ADOS; [32]). The diagnosis of autistic disorder was made using the in-formation from these instruments, as well as the DSM-IV-TR.
At each visit, participants were administered a test to assess cognitive ability, either the Mullen Scales of Early Learning [33] or the Differential Abilities Scales, Second Edition [34]. To facilitate comparison between the tests and to account for the inability of participants to achieve standard scores, we use developmental quotients (DQ; the ratio of mental age to chronological age) in place of conventional IQ.
Parents responded to several interviews and
question-naires, including the Child Behavior Checklist
(CBCL; [35]) and the interview version of the Vineland Adaptive Behavior Scales, Second Edition (VABS; [36]). The VABS is a semi-structured interview that assesses adaptive behavior in several domains, summarized by the Adaptive Behavior Composite (ABC) standard score. ABC standard scores may range from 20 to 160, with a population mean of 100 and a standard deviation of 15. To facilitate comparison with existing studies, we used the ABC as our outcome measure.
This battery was repeated at all visits, excepting the ADI-R, which was conducted only at the first and last visits. Because the age band at study entry differed across participants, we could not evaluate baseline pre-dictors of class membership. Instead, we plot observed contemporaneous data across several domains of interest (non-verbal and verbal DQ, ADOS Calibrated Severity Score (CSS), and CBCL Externalizing and Internalizing scores) by most likely class assignment.
Statistical analysis
technical introductions, see [37, 38]) and we provide the necessary Mplus syntax in Additional file 1.
GMM is an extension of conventional latent growth modeling, a class of statistical procedures used in longitu-dinal investigations to characterize both intra- and inter-individual variability in change. GMM may be particularly helpful in testing the assumption that the parameters from a standard growth model adequately describe data from two subpopulations (e.g., in physical growth curves, sex would be a known marker of subpopulation), especially when the explanation for heterogeneity is unknown. GMM treats this unknown as a latent variable problem, explained by an unobserved class variable. GMM provides information about whether the observed data are best ex-plained by a single distribution of trajectory parameters (i.e., a latent class variable with only one class) or by a mixture of component distributions (i.e., a latent variable with two or more classes) [38].
Because the goal of GMM is to determine whether the data are best explained by one or more distributions, the first step is to establish the latent growth model (i.e., the best fitting model, assuming that there are no subpopu-lations reflected in the data). Subsequent GMM models will be compared to this “baseline” model to determine whether assuming a mixture of distributions, rather than a single distribution, improves fit.
GMMs of increasing complexity are then fit to the data. These models are distinguished by which parame-ters (i.e., mean, variance, and covariance of the intercept, slope, and/or quadratic terms) are allowed to vary, both within and between the classes. The simplest GMM is the latent class growth analysis (LCGA), which estimates only the mean values of the intercept, slope, and quad-ratic terms. These parameters are allowed to vary
between classes, but not within (i.e., the variances, and therefore covariances, are constrained to zero). This means that all members of class 1 are constrained to have the same intercept, for example, but that intercept differs from those of the members of class 2. While it is possible that this preliminary model is appropriate, whether the variances and covariances should be con-strained to zero is an empirical question. Thus, the remaining procedures entail the evaluation of at least four more models in the following sequence: (a) relax the within-class constraint on the variance of the inter-cept and slope factors (GMM1), (b) relax the within-class constraint on the covariance of the intercept and slope factors (GMM2), (c) relax the between-class con-straint on the variance of the intercept and slope factors (GMM3), and (d) relax the between-class constraint on the covariance of the intercept and slope factors (GMM4). Each model specification is then evaluated for one, two, three, four or more classes, or until the model is no longer able to converge.
The best model is selected in an iterative process. First, the relative fit indices of all models are compared. In the current analyses, we used the following fit indices: the loglikelihood, the Bayesian information criterion, the adjusted Bayesian information criterion, Aikake’s infor-mation criterion, and the consistent Aikake’s informa-tion criterion. Bayes’factor and the approximate weight of evidence criterion were used to assist in the interpret-ation of informinterpret-ation criteria. Finally, the Vuong-Lo-Mendell-Rubin likelihood ratio test (and an adjusted value) and the parametric bootstrap likelihood ratio test were used to assess the degree of improvement in model fit with additional classes. Each of these fit indices is de-scribed in Additional file 1.
Next, a handful of candidate models with the best pro-file of relative fit indices are further evaluated based on their classification quality and the degree of distinction between classes. In this study, we calculated entropy, the average posterior probability, the odds of correct classifi-cation, and the modal class assignment proportion for each class. The homogeneity and separation were calcu-lated for each parameter that was allowed to vary and therefore characterize each class. The models were also evaluated for robustness to slight changes in the model specification; for example, does class assignment in the two-class solutions change significantly between the GMM1 and GMM2 specifications?
All GMM analyses were completed in Mplus version 7.4; other analyses and data management were per-formed in SAS/STAT version 9.3. We note that the max-imum likelihood estimation with robust standard errors accommodates the missing data imposed by the age-cohort structure of the data. Because the results and fit indices for all 21 models are voluminous, they are re-ported in Additional file 1.
Results
Consistent with visual inspection, the best-fitting latent growth model was of quadratic form, where the variance in both the intercept and slope was estimated but was constrained to zero for the quadratic term. We used this baseline model for the remaining GMM analyses.
The full complement of fit indices for the GMM speci-fications is shown in Additional file 1: Table S1. Based on these results, the candidate models were the LCGA two-class, LCGA three-class, and the two-class solutions in the GMM1, GMM2, and GMM3 parameterizations. First, we reviewed the parameter estimates from each candidate model (Additional file 1: Table S2). The GMM parameterizations differ from LCGA in that they allow variation within the group on the intercept and slope factors. The within-class variance of the intercept, but not the slope, was large and significantly different from zero, suggesting that the GMM parameterizations might
be more reflective of the data than the LCGA. However, the covariance between the intercept and slope, which
was allowed to be non-zero in the GMM2
parameterization, was not significant. Further, when the between-class variance was allowed in intercept and slope (GMM3), these parameters were non-significant. Considering that the mean estimates for the intercept and slope were similar for each class across the GMM parameterizations, the GMM1 appeared to be the best representation of the data.
Next, classification quality, as well as the homogeneity and separation of the resulting classes, was evaluated for
the LCGA and GMM1 parameterizations
(Additional file 1: Table S3). All models had acceptable classification quality, homogeneity, and separation. Thus, the selection of the GMM1 two-class solution, rather than the LCGA solution, was driven by the large and significant within-class variance of the intercept.
In the final model (Fig. 1), the low/decreasing class (class 1) was characterized by an ABC score of approxi-mately 66 at age 3 years and a significant quadratic trajectory. The moderate/stable class (class 2) was char-acterized by a slightly higher age 3 score (about 72), with no change over the study period (i.e., slope and quad-ratic terms were non-significant) (see Additional file 1: Table S2). The model-estimated proportion of the sam-ple in each class was 73 and 27%, respectively. To facilitate the comparison to published data, the observed means from the Szatmari et al. study were superimposed on the current study estimated class trajectories in Fig. 1.
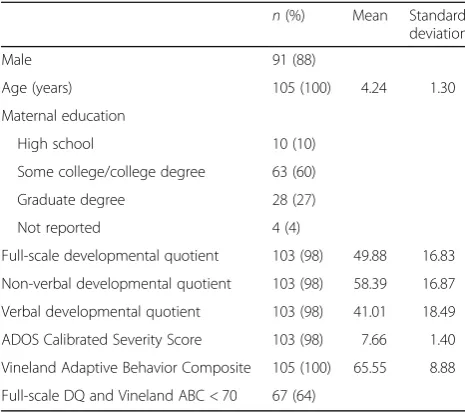
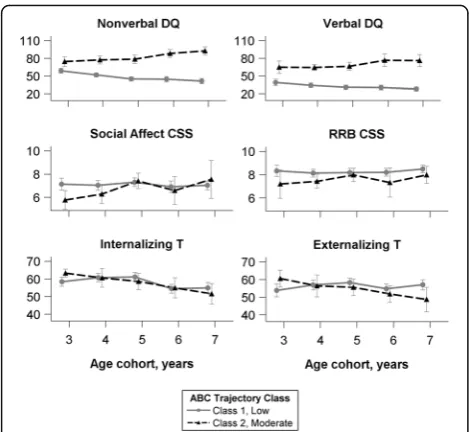
The classes are descriptively characterized using other phenotypic data in Fig. 2. Modal class assignment was used to calculate the mean cognitive, ADOS CSS, and CBCL scores. Stronger non-verbal DQ relative to verbal DQ was characteristic of both classes, and in both classes, more change was observed over time in non-verbal DQ than in verbal DQ. However, for the moderate/stable class, average DQ scores increased over time, while average DQ Table 2Participant demographics at baseline (n= 105)
n(%) Mean Standard
deviation
Male 91 (88)
Age (years) 105 (100) 4.24 1.30
Maternal education
High school 10 (10)
Some college/college degree 63 (60)
Graduate degree 28 (27)
Not reported 4 (4)
Full-scale developmental quotient 103 (98) 49.88 16.83
Non-verbal developmental quotient 103 (98) 58.39 16.87
Verbal developmental quotient 103 (98) 41.01 18.49
ADOS Calibrated Severity Score 103 (98) 7.66 1.40
Vineland Adaptive Behavior Composite 105 (100) 65.55 8.88
Full-scale DQ and Vineland ABC < 70 67 (64)
The age cohorts 2, 8, and 9 were excluded from analysis and are therefore not reflected in this table. Thus, baseline in these analyses was not the first visit for all participants
scores decreased over time for the low/decreasing class. No characteristic patterns were observed in ADOS CSS scores, which remained relatively stable over time, nor were the classes distinguished by CBCL Internalizing or Externalizing scores, though a general trend of decreasing over time was observed in both classes for the former.
Discussion
We used longitudinal data from children with ASD aged 3 to 7.99 years to explore heterogeneity in the develop-ment of adaptive behavior. About three quarters of the sample were assigned to a low/decreasing trajectory. The remainder of the sample were best classified in a trajectory exemplified by stable scores around 70 (moderate/stable). Thus, even within a sample likely to exhibit a high rate of intellectual disability later in child-hood, we observed variability in the progression of adaptive function over time. Still, these data confirm previous findings that on average, young children with ASD are likely to exhibit significantly impaired adaptive function (based on age-referenced standard scores) dur-ing the preschool to school-age period, with only a minority exhibiting an improving trajectory [23, 30].
These two trajectories are reminiscent of patterns observed in studies of the development of cognitive abil-ity; on average, children with more moderate scores tend to improve somewhat over time, while children with lower scores appear to fall further behind. The latter is to be expected with the use of standard scores; anything
less than on-pace gains in skills will result in decreasing standard scores over time. Decreasing standard scores over time are certainly not unique to ASD; similar tra-jectories have recently been described in various genetic disorders associated with intellectual disability, including fragile X syndrome, Williams syndrome, and tuberous sclerosis. This suggests that the presence of intellectual disability, rather than ASD specifically, may be the predominate explanatory factor for these declines. It is also possible that this pattern is reflective of psychomet-ric properties of the VABS; with relatively fewer items at the lower extremes, stability in standard scores is difficult to achieve.
Adaptive behavior development does not exist in a vacuum, so it is essential to characterize subpopulations in terms of other phenotypic characteristics. Other stud-ies have documented consistently that lower cognitive and language ability predicts less optimal trajectories of adaptive behavior [28–30]. This finding is echoed by data from cross-sectional or pre-post analytic designs (e.g., [9, 39, 40]). Given the strong correlations between measures of IQ and measures of adaptive behavior, it is unsurprising that changes in non-verbal and verbal DQ paralleled the adaptive behavior trajectory in our study. While IQ is not the only determinant of adaptive behav-ior, and studies have shown discrepancies between adaptive behavior scores and IQ scores may depend on IQ range [26, 41], it is well-established that cognitive im-pairment negatively affects the ability to carry out func-tions of daily life, above and beyond the effects of symptoms of ASD. However, while there was little differ-ence in adaptive behavior and cognitive scores in the moderate/stable class, the average cognitive score in the low/decreasing class was much lower than the adaptive behavior score. This profile of relatively stronger adap-tive behavior, compared to IQ, has been observed in other samples of individuals with low IQ [15, 42]. However, when IQ is not in the range of intellectual disability, adap-tive behavior is often found to be lower than IQ in ASD [5], leading to the suggestion that the pattern is driven by deficits in social abilities [43]. The high proportion of chil-dren with low IQ and/or language impairment in our sample necessitated the use of ratio IQ scores, and this may have influenced our results by overemphasizing the effect of age (ratio IQs are divided by an ever-increasing denominator of chronological age). This may artificially delate IQ, resulting in lower ratio IQs than adaptive behavior scores in those with the lowest IQs.
The finding that the development of VABS composite scores over the preschool and early school-age years in our sample was best described by low/decreasing and moderate/stable classes was remarkably consistent with findings reported by Szatmari et al. and may be consid-ered a partial replication, enhancing our confidence that Fig. 2Phenotypic data over time, by most likely class assignment.
these subpopulations exist. The wider age range in our study extends the Szatmari et al. findings, although a longer follow-up with denser sampling is necessary to confirm the short-term stabilizing trend observed after the age of 6 years in these data. In our sample, we did not find evidence for the “high functioning and improv-ing”class described by Szatmari et al., which may reflect several factors, including ascertainment (they included participants referred to the longitudinal study directly from community referral centers, whereas our partici-pants were mostly self-referral from the community) and diagnosis (they included DSM-IV-TR pervasive develop-mental disorder, not otherwise specified, while we re-quired autistic disorder). Given that our sample had few participants with cognitive scores in the average range, we surmise that we simply did not sample the popula-tion represented by the “high functioning and improv-ing” class in Szatmari et al. [30]. However, we do note that while the average IQ score in our sample was lower than that of Szatmari et al., mean IQs in both studies in-dicate similar levels of intellectual disability. Our slightly lower IQ likely reflects the more severely impaired cog-nitive profile of children already diagnosed with DSM-IV-TR autistic disorder (as opposed to an inception sam-ple including pervasive developmental disorder, not otherwise specified). Thus, because our sample did not include many children with average IQs, these results are only generalizable to the subset of the ASD popula-tion with low IQ scores.
These data help to address the dearth of longitudinal natural history data on adaptive behavior in children with ASD and generally low cognitive ability. The most serious weaknesses of this study are its relatively small size, especially at the more extreme ages, and our inabil-ity to evaluate early predictors of class membership due to varying ages of study entry. Although we used the semi-structured survey interview form of the VABS, the necessary reliance on parent report may have biased re-sults. However, a significant strength of this study is the analytic approach. While not novel in the broader child development literature, GMM has been implemented in few ASD studies, and when they have been used, researchers were likely to stop at the LCGA specification (e.g., [28–30]), limiting insights into data patterns that may not be obvious with traditional growth models.
Finally, we underscore the importance of these find-ings in relation to the ongoing search for appropriate outcome measures in intervention trials. Due to an em-phasis on function as the most important outcome, adaptive behavior may become a more common primary and secondary target in clinical trials [44, 45]. We con-firmed the presence of at least two subpopulations of adaptive behavior trajectories within ASD—children who are moderately impaired, but exhibit stable adaptive
behavior standard scores over the early childhood and school-age years, and those who have more impaired scores that worsen over time. The reliable identification of the latter class would be advantageous for any clinical trial that uses adaptive behavior as an outcome. Specific-ally, researchers are investigating novel statistical methods to identify a “minimal clinically important dif-ference” [23] in order to ease reliance on classical null hypothesis testing wherein significance is defined only by the difference from zero. Importantly, in some cases, this may actually be manifested as stability, or just min-imal improvements in adaptive behavior standard scores (but growth in raw scores). The degree of meaningful-ness may depend upon ability level [23] and may be fur-ther adjusted based on membership in an adaptive behavior trajectory subpopulation like those described herein. Szatmari et al. found that language and cognitive scores predicted class membership; it will be important to also explore whether the initial level of adaptive behavior had similarly predictive power. Future research, focused on the identification of predictors of member-ship, will help to translate descriptive findings into clinically and empirically useful information.
Conclusions
In this analysis, we reported data from one of the few longitudinal studies of ASD to include the transition from preschool to school-age, replicating with sophisti-cated statistical modeling the general findings of previ-ous studies examining the development of adaptive behavior. These findings illustrate that early delays in adaptive behavior are stable or worsen from the preschool to school-age periods for the majority of children enrolled in these research cohorts, character-ized by growth in adaptive behavior skills that lags be-hind the change in chronological age. For some children with lower adaptive abilities, this slower-than-expected growth results in a decline in composite standard scores during childhood. These findings provide critical context for the interpretation of changes in adaptive behavior scores in clinical trials.
Additional file
Additional file 1:Figure S1.Data coverage.Figure S2.Raw ABC scores.Table S1.Model fit indices.Table S2.Model information.Table S3.Classification quality.Table S4.Correlates of class membership.Table S5.Mplus syntax for growth mixture models. (PDF 778 kb)
Abbreviations
Acknowledgements
We thank the participants and their families, as well as the study staff and Jill Leon, B.S., who contributed to the literature review and Asma Idriss and the Clinical Trials Database staff who provided data management support.
Funding
This work was supported by the Intramural Research Program of the National Institute of Mental Health (ZIAMH002868).
Availability of data and materials
The datasets analyzed in the current study are available in the NIMH Data Archive repository: https://ndar.nih.gov:443/edit_collection.html?id=2368
Authors’contributions
AT and SS conceived and designed the study. CF analyzed the data. AT, LS, and CF interpreted the data. All authors were involved in drafting or revising the manuscript, gave final approval for publication, and agreed to be accountable for all aspects of the work.
Ethics approval and consent to participate
Informed consent was obtained for participants, who were enrolled in a longitudinal natural history study of autism approved by an NIH Institutional Review Board (06-M-0102).
Consent for publication Not applicable.
Competing interests
The authors declare that they have no competing interests.
Publisher’s Note
Springer Nature remains neutral with regard to jurisdictional claims in published maps and institutional affiliations.
Author details
1
Pediatrics and Developmental Neuroscience Branch, National Institute of Mental Health, National Institutes of Health, Bethesda, MD 20892, USA.
2Department of Speech and Hearing Sciences, Washington State University,
Spokane, WA 99202, USA.
Received: 3 August 2017 Accepted: 19 December 2017
References
1. American Psychiatric Association. Diagnostic and statistical manual of mental disorders (4th ed., text rev.). Washington, DC: Author; 2000. 2. American Psychiatric Association. Diagnostic and statistical manual of mental
disorders (5th ed.). Arlington: American Psychiatric Publishing; 2013. 3. Dykens E, Lense M. Intellectual disabilities and autism spectrum disorder: a
cautionary note. In: Amaral D, Geschwind D, Dawson G, editors. Autism spectrum disorders. Oxford: Oxford University Press; 2011. p. 261–9. 4. Volkmar F, Sparrow S, Goudreau D, Cicchetti DV, Paul R, Cohen D. Social
deficits in autism: an operational approach using the Vineland Adaptive Behavior Scales. J Am Acad Child Adolesc Psychiatry. 1987;26:156–61. 5. Kenworthy L, Case L, Harms MB, Martin A, Wallace GL. Adaptive behavior
ratings correlate with symptomatology and IQ among individuals with high-functioning autism spectrum disorders. J Autism Dev Disord. 2010;40:416–23. 6. Zander E, Bolte S. The new DSM-5 impairment criterion: a challenge to early
autism spectrum disorder diagnosis? J Autism Dev Disord. 2015;45:3634–43. 7. Scahill L. Diagnosis and evaluation of pervasive developmental disorders. J
Clin Psychiatry. 2005;66(Suppl 10):19–25.
8. Magiati I, Tay XW, Howlin P. Cognitive, language, social and behavioural outcomes in adults with autism spectrum disorders: a systematic review of longitudinal follow-up studies in adulthood. Clin Psychol Rev. 2014;34:73–86. 9. Hedvall A, Westerlund J, Fernell E, Norrelgen F, Kjellmer L, Olsson MB,
Carlsson LH, Eriksson MA, Billstedt E, Gillberg C. Preschoolers with autism spectrum disorder followed for 2 years: those who gained and those who lost the most in terms of adaptive functioning outcome. J Autism Dev Disord. 2015;45:3624–33.
10. Kraijer D. Review of adaptive behavior studies in mentally retarded persons with autism/pervasive developmental disorder. J Autism Dev Disord. 2000;30:39–47.
11. Green MF, Schooler NR, Kern RS, Frese FJ, Granberry W, Harvey PD, Karson CN, Peters N, Stewart M, Seidman LJ, et al. Evaluation of functionally meaningful measures for clinical trials of cognition enhancement in schizophrenia. Am J Psychiatry. 2011;168:400–7.
12. van der Lee JH, Morton J, Adams HR, Clarke L, Ebbink BJ, Escolar ML, Giugliani R, Harmatz P, Hogan M, Jones S, et al. Cognitive endpoints for therapy development for neuronopathic mucopolysaccharidoses: results of a consensus procedure. Mol Genet Metab. 2017;121:70–9.
13. Bal VH, Farmer C, Thurm A. Describing function in ASD: using the DSM-5 and other methods to improve precision. J Autism Dev Disord. 2017;47: 2938–41.
14. Anagnostou E, Jones N, Huerta M, Halladay AK, Wang P, Scahill L, Horrigan JP, Kasari C, Lord C, Choi D. Measuring social communication behaviors as a treatment endpoint in individuals with autism spectrum disorder. Autism. 2015;19:622–36.
15. Kanne SM, Gerber AJ, Quirmbach LM, Sparrow SS, Cicchetti DV, Saulnier CA. The role of adaptive behavior in autism spectrum disorders: implications for functional outcome. J Autism Dev Disord. 2011;41:1007–18.
16. Scahill L, Bearss K, Lecavalier L, Smith T, Swiezy N, Aman MG, Sukhodolsky DG, McCracken C, Minshawi N, Turner K, et al. Effect of parent training on adaptive behavior in children with autism spectrum disorder and disruptive behavior: results of a randomized trial. J Am Acad Child Adolesc Psychiatry. 2016;55:602–9. e603 17. Berry-Kravis E, Hagerman R, Visootsak J, Budimirovic D, Kaufmann WE,
Cherubini M, Zarevics P, Walton-Bowen K, Wang P, Bear MF, Carpenter RL. Arbaclofen in fragile X syndrome: results of phase 3 trials. J Neurodev Disord. 2017;9:3.
18. Veenstra-VanderWeele J, Cook EH, King BH, Zarevics P, Cherubini M, Walton-Bowen K, Bear MF, Wang PP, Carpenter RL. Arbaclofen in children and adolescents with autism spectrum disorder: a randomized, controlled, phase 2 trial. Neuropsychopharmacology. 2017;42:1390–8.
19. Scahill L, McDougle CJ, Aman MG, Johnson C, Handen B, Bearss K, Dziura J, Butter E, Swiezy NG, Arnold LE, et al. Effects of risperidone and parent training on adaptive functioning in children with pervasive developmental disorders and serious behavioral problems. J Am Acad Child Adolesc Psychiatry. 2012;51:136–46.
20. Dawson G, Rogers S, Munson J, Smith M, Winter J, Greenson J, Donaldson A, Varley J. Randomized, controlled trial of an intervention for toddlers with autism: the Early Start Denver Model. Pediatrics. 2010;125:e17–23. 21. Hardan AY, Gengoux GW, Berquist KL, Libove RA, Ardel CM, Phillips J, Frazier
TW, Minjarez MB. A randomized controlled trial of Pivotal Response Treatment Group for parents of children with autism. J Child Psychol Psychiatry. 2015;56:884–92.
22. Green J, Pickles A, Pasco G, Bedford R, Wan MW, Elsabbagh M, Slonims V, Gliga T, Jones EJ, Cheung CH, et al. Randomised trial of a parent-mediated intervention for infants at high risk for autism: longitudinal outcomes to age 3 years. J Child Psychol Psychiatry. 2017;58:1330–40.
23. Chatham CH, Taylor KI, Charman T, Liogier D’ardhuy X, Eule E, Fedele A, Hardan AY, Loth E, Murtagh L, Del Valle Rubido M, et al. Adaptive behavior in autism: minimal clinically important differences on the Vineland-II. Autism Res. 2017. https://doi.org/10.1002/aur.1874.
24. Bishop SL, Farmer C, Thurm A. Measurement of nonverbal IQ in autism spectrum disorder: scores in young adulthood compared to early childhood. J Autism Dev Disord. 2015;45:966–74.
25. Lord C, Bishop S, Anderson D. Developmental trajectories as autism phenotypes. Am J Med Genet C Semin Med Genet. 2015;169:198–208. 26. Bolte S, Poustka F. The relation between general cognitive level and
adaptive behavior domains in individuals with autism with and without co-morbid mental retardation. Child Psychiatry Hum Dev. 2002; 33:165–72.
27. Jung T, Wickrama K. An introduction to latent class growth analysis and growth mixture modeling. Soc Personal Psychol Compass. 2008;2:302–17. 28. Baghdadli A, Assouline B, Sonié S, Pernon E, Darrou C, Michelon C, Picot
M-C, Aussilloux M-C, Pry R. Developmental trajectories of adaptive behaviors from early childhood to adolescence in a cohort of 152 children with autism spectrum disorders. J Autism Dev Disord. 2012;42:1314–25.
29. Bal VH, Kim SH, Cheong D, Lord C. Daily living skills in individuals with autism spectrum disorder from 2 to 21 years of age. Autism. 2015;19:774–84. 30. Szatmari P, Georgiades S, Duku E, Bennett TA, Bryson S, Fombonne E, Mirenda P,
31. Rutter M, Le Couteur A, Lord C. Autism diagnostic interview-revised. Los Angeles: Western Psychological Services; 2003.
32. Lord C, Rutter M, DiLavore PC, Risi S. Autism Diagnostic Observation Schedule (ADOS). Los Angeles, California: Western Psychological Services; 1999. 33. Mullen EM. Mullen scales of early learning. Circle Pines: American Guidance
Service; 1995.
34. Elliott CD, editor. Manual for the differential ability scales, second edition. San Antonio, TX: Harcourt Assessment; 2007.
35. Achenbach TM, Rescorla LA. Manual for the ASEBA School-Age Forms and Profiles. Burlington: University of Vermont, Research Center for Children, Youth and Families; 2001.
36. Sparrow SS, Cicchetti DV, Balla DA. Vineland Adaptive Behavior Scales, Second Edition. Circle Pines, MN: AGS Publishing; 2005.
37. Ram N, Grimm KJ. Methods and measures: growth mixture modeling: a method for identifying differences in longitudinal change among unobserved groups. Int J Behav Dev. 2009;33:565–76.
38. Masyn KE. Latent class analysis and finite mixture modeling. In: The Oxford handbook of quantitative methods in psychology: Vol 2; 2013.
39. Pugliese CE, Anthony LG, Strang JF, Dudley K, Wallace GL, Naiman DQ, Kenworthy L. Longitudinal examination of adaptive behavior in autism spectrum disorders: influence of executive function. J Autism Dev Disord. 2016;46:467–77. 40. Hill TL, Gray SA, Kamps JL, Enrique Varela R. Age and adaptive functioning in children and adolescents with ASD: the effects of intellectual functioning and ASD symptom severity. J Autism Dev Disord. 2015;45:4074–83. 41. Perry A, Flanagan HE, Dunn Geier J, Freeman NL. Brief report: the Vineland
Adaptive Behavior Scales in young children with autism spectrum disorders at different cognitive levels. J Autism Dev Disord. 2009;39:1066–78. 42. Flanagan HE, Smith IM, Vaillancourt T, Duku E, Szatmari P, Bryson S,
Fombonne E, Mirenda P, Roberts W, Volden J, et al. Stability and change in the cognitive and adaptive behaviour scores of preschoolers with autism spectrum disorder. J Autism Dev Disord. 2015;45:2691–703.
43. Klin A, Saulnier CA, Sparrow SS, Cicchetti DV, Volkmar FR, Lord C. Social and communication abilities and disabilities in higher functioning individuals with autism spectrum disorders: the Vineland and the ADOS. J Autism Dev Disord. 2007;37:748–59.
44. Budimirovic DB, Berry-Kravis E, Erickson CA, Hall SS, Hessl D, Reiss AL, King MK, Abbeduto L, Kaufmann WE. Updated report on tools to measure outcomes of clinical trials in fragile X syndrome. J Neurodev Disord. 2017;9:14.
45. McConachie H, Parr JR, Glod M, Hanratty J, Livingstone N, Oono IP, Robalino S, Baird G, Beresford B, Charman T, et al. Systematic review of tools to measure outcomes for young children with autism spectrum disorder. Health Technol Assess. 2015;19:1–506.
• We accept pre-submission inquiries
• Our selector tool helps you to find the most relevant journal • We provide round the clock customer support
• Convenient online submission • Thorough peer review
• Inclusion in PubMed and all major indexing services • Maximum visibility for your research
Submit your manuscript at www.biomedcentral.com/submit