What is a healthy ecosystem?
Robert Costanza and Michael Mageau
University of Maryland Institute for Ecological Economics, Center for Environmental Science and College of Life Sciences, Box 38, Solomons, MD 20688, USA
Accepted 27 January 1999
Key words: estuaries, network analysis, resilience, vigor
Abstract
Rapid deterioration of the world’s major ecosystems has intensified the need for effective environmental monitoring and the development of operational indicators of ecosystem health. Ecosystem health represents a desired endpoint of environmental management, but it requires adaptive, ongoing definition and assessment. We propose that a healthy ecosystem is one that is sustainable – that is, it has the ability to maintain its structure (organization) and function (vigor) over time in the face of external stress (resilience). Various methods to quantify these three ecosystem attributes (vigor, organization, and resilience) are discussed. These attributes are then folded into a com-prehensive assessment of ecosystem health. A network analysis based ecosystem health assessment is developed and tested using trophic exchange networks representing several different aquatic ecosystems. Results indicate the potential of such an ecosystem health assessment for evaluating the relative health of similar ecosystems, and quantifying the effects of natural or anthropogenic stress on the health of a particular ecosystem over time.
Introduction
To understand and manage complex systems (like eco-logical and economic systems), we need some way of assessing the system’s overall performance – its relative ‘health’. The US EPA has begun to shift the stated goals of its monitoring and enforcement activi-ties from protecting only ‘human health’ to protecting overall ‘ecological health’. Indeed, EPA’s Science Ad-visory Board (SAB, 1990) stated: EPA should attach as much importance to reducing ecological risk as it does to reducing human health risk. These very close linkages between human health and ecological health should be reflected in national environmental policy. When EPA compares the risks posed by different en-vironmental problems in order to set priorities for Agency action, the risks posed to ecological systems must be an important part of the equation.
Although this statement gives the concept of eco-logical health importance as a primary EPA goal, it begs the question of what ecosystem health is, while tacitly defining it as analogous to human health. The dictionary definitions of health are: ‘1. the condition
of being sound in mind, body, and spirit; and 2. flour-ishing condition or well-being’. These definitions are obviously rather vague. In order to meet the man-date for effectively managing the environment a more rigorous and operational definition of health must be constructed – one that is applicable to all complex systems at all levels of scale, including organisms, ecosystems, and economic systems.
Defining ecosystem health and sustainability
simple relationships with little or no uncertainty. An organism, however, is composed of complex cells and organ systems. The state of an organism cannot be sur-mised simply by adding up the states of the individual components, since these components are themselves complex and have different, noncommensurable func-tions within the overall system. Indicators that might be useful for understanding heart function – pumping rate and blood pressure, for instance – are meaningless for skin or teeth.
Past explicit or implicit definitions of ecosystem health have included:
• Health as homeostasis.
• Health as the absence of disease.
• Health as diversity or complexity.
• Health as stability or resilience.
• Health as vigor or scope for growth.
• Health as balance between system components. All of these concepts represent pieces of the puz-zle, but none is comprehensive enough to serve our purposes here. In this paper, we develop the concept of ecosystem health as a comprehensive, multiscale, dynamic, hierarchical measure of system resilience, organization, and vigor. These concepts are embodied in the term ‘sustainability’ which implies the sys-tem’s ability to maintain its structure (organization) and function (vigor) over time in the face of exter-nal stress (resilience). A healthy system must also be defined in light of both its context (the larger system of which it is part) and its components (the smaller systems that make it up).
In its simplest terms, then, health is a measure of the overall performance of a complex system that is built up from the behavior of its parts. Such mea-sures of system health imply a weighted summation or a more complex operation over the component parts, where the weighting factors incorporate an assessment of the relative importance of each component to the functioning of the whole. This assessment of rela-tive importance incorporates ‘values’, which can range from subjective and qualitative to objective and quan-titative as we gain more knowledge about the system under study. In the practice of human medicine, these weighting factors or values are contained in the body of knowledge and experience embodied in the medical practitioner.
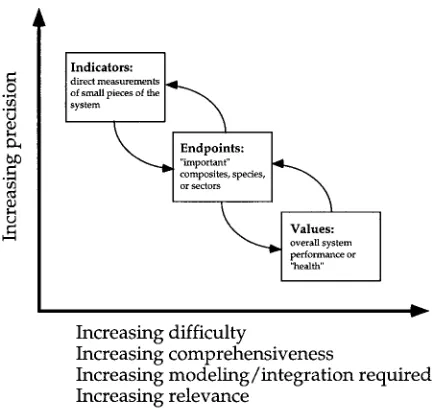
Figure 1 shows the progression from directly mea-sured ‘indicators’ of a component’s status, through ‘endpoints’ that are composites of these indicators, to health with the help of ‘values’. Measures of health are inherently more difficult, more comprehensive,
re-Figure 1. Relationship between indicators, endpoints and values (after Costanza, 1992).
quire more modeling and synthesis, and involve less precision, but are more relevant than the endpoints and indicators from which they are built. It remains to de-termine which general approaches to developing these measures of health for ecosystems are most effective.
Health is also a scale-dependent characteristic. Figure 2 indicates this relationship by plotting a hy-pothetical curve of system life expectancy on the y axis vs. time and space scale on the x axis (Costanza & Patten, 1995). We expect a cell in an organism to have a relatively short life span, the organism to have a longer life span, the species to have an even longer life span, and the planet to have a longer life span. But no system (even the universe itself in the extreme case) is expected to have an infinite life span. A healthy and sustainable system in this context is one that attains its full expected life span. For individual humans, this is also an often used cumulative indicator of health (at least in retrospect).
Figure 2. Health and sustainability as scale (time and space) depen-dent concepts (after Costanza & Patten, 1995).
the more oligotrophic system while beginning the life span of a more eutrophic system). We would have to call this process ‘unhealthy’ using the above definition since the life span of the first system was cut ‘unnatu-rally’ short. It may have gone eutrophic eventually, but the anthropogenic stress caused this transition to occur ‘too soon’.
How can we create a practical definition of system health that is applicable with equal facility to complex systems at all scales? Let us first lay out the minimum characteristics of such a definition. First, an adequate definition of ecosystem health should integrate the concepts of health mentioned above. Specifically it should be a combined measure of system resilience, life expectancy, balance, organization (diversity), and vigor (metabolism). Second, the definition should be a comprehensive description of the system. Looking at only one part of the system implicitly gives the re-maining parts zero weight. Third, the definition will require the use of weighting factors to compare and ag-gregate different components in the system. It should use weights for components that are linked to the func-tional dependence of the system’s sustainability on the components, and the weights should be able to vary as the system changes to account for ‘balance’. And fourth, the definition should be hierarchical to account for the interdependence of various time and space scales.
Costanza et al. (1992) develop the following de-finition of ecosystem health: An ecological system is healthy and free from ‘distress syndrome’ if it is stable and sustainable – that is, if it is active and maintains its organization and autonomy over time and is resilient to stress.
Ecosystem health is thus closely linked to the idea of sustainability which is seen to be a comprehensive, multiscale, dynamic measure of system resilience, organization, and vigor. This definition is applica-ble to all complex systems from cells to ecosystems to economic systems (hence it is comprehensive and multiscale) and allows for the fact that systems may be growing and developing as a result of both natural and cultural influences. According to this definition, a dis-eased or unhealthy system is one that is not sustainable and will not achieve its maximum life span. The time and space frame are obviously important in this defin-ition. Distress syndrome (Rapport et al., 1985, 1992) refers to the irreversible processes of system break-down leading to the termination of the system before its normal life span. To be healthy and sustainable, a system must maintain its metabolic activity level as well as its internal structure and organization (a diver-sity of processes effectively linked to one another) and must be resilient to outside stresses over a time and space frame relevant to that system.
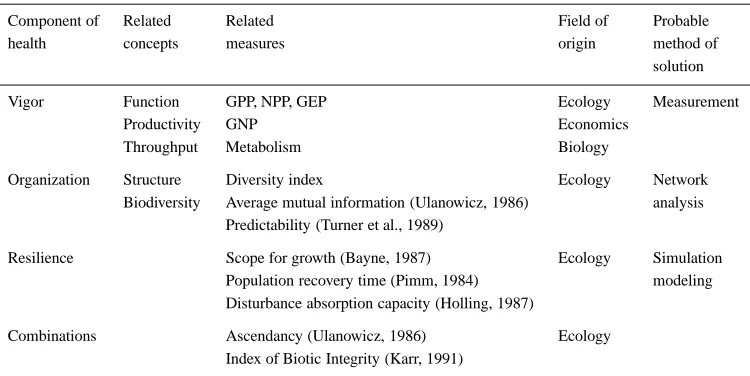
What does this mean in practice? Table 1 lays out the three main components of this proposed con-cept of system health (resilience, organization, and vigor) along with related concepts and measurements in various fields.
What we are looking for is an assessment that com-bines these three basic aspects of system performance and health – vigor, organization, and resilience. To operationalize these concepts (especially organization and resilience) will require a heavy dose of systems analysis, synthesis, and modeling, combined with broad-based input from the full range of stakeholders involved in the management of ecosystems.
In this paper we propose a systems level assess-ment of ecosystem health that is reasonably easy to measure, and incorporates values in a general manner allowing for the possibility of reaching a consensus. More specifically, we identify three components of ecosystem health that encompass many of the concepts discussed above, describe the quantification of these components, illustrate how they can be incorporated into a quantitative assessment of ecosystem health, examine some initial testing of the assessment, and discuss opportunities for future testing.
Three components of ecosystem health
Table 1. Indices of vigor, organization, and resilience in various fields
Component of Related Related Field of Probable
health concepts measures origin method of
solution
Vigor Function GPP, NPP, GEP Ecology Measurement
Productivity GNP Economics
Throughput Metabolism Biology
Organization Structure Diversity index Ecology Network
Biodiversity Average mutual information (Ulanowicz, 1986) analysis Predictability (Turner et al., 1989)
Resilience Scope for growth (Bayne, 1987) Ecology Simulation Population recovery time (Pimm, 1984) modeling Disturbance absorption capacity (Holling, 1987)
Combinations Ascendancy (Ulanowicz, 1986) Ecology Index of Biotic Integrity (Karr, 1991)
include gross primary productivity in ecological sys-tems, and gross national product in economic systems. It has been hypothesized that a system’s ability to recover from stress, or to utilize it, is related to its overall metabolism, energy flow (Odum, 1971), or to its ‘scope for growth’ (Bayne et al., 1987) which is the difference between the energy required for system maintenance and the energy available to the system for all purposes. Each of these measures is aimed at the system’s capability to respond to generalized stress.
The organization of a system refers to the number and diversity of interactions between the components of the system. Measures of organization are affected by the diversity of species, and also by the number of pathways of material exchange between each com-ponent. For example, a highly organized system is characterized by a high diversity of specialized com-ponents, and their corresponding specialized exchange pathways. Organization decreases as the diversity of species and the specialization of exchange pathways decrease. It is important to realize that for any given level of species diversity organization can vary with the pattern of exchange pathways between them. A system containing species that feed on only one or two specific prey items, and are in turn prey for only one or two other species, will have higher values of orga-nization than a system containing the same number of generalist feeders with multiple pathways of exchange between them. Organization, therefore, extends tradi-tional measures of diversity by also considering the patterns of exchange between system components.
The resilience of a system refers to its ability to maintain its structure and pattern of behavior in the presence of stress (Holling, 1986). In the context of this paper, it may refer to the system’s ability to main-tain its vigor and organization in the presence of stress. A healthy system is one that possesses adequate re-silience to survive various small-scale perturbations. The concept of system resilience has two main com-ponents. The most commonly used aspect refers to the length of time it takes a system to recover from stress. A second aspect refers to the magnitude of stress from which the system can recover, or the system’s specific thresholds for absorbing various stresses. A related point involves the alternative system states once thresholds are crossed; these may vary from total system collapse to a stable state that may actually be more beneficial. The limits of ecosystem stability or resilience are currently being debated. Holling (1986) argues that the limits range from the assumption of complete global stability, implicit in many of human-ity’s past efforts to manage, to the idea of ecosystems being extremely fragile.
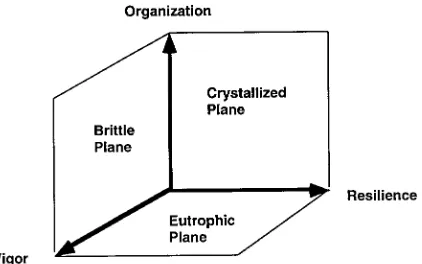
Figure 3. A three-dimensional plot of system vigor, organization, and resilience. Each of the planes formed when one component is zero are also labeled.
combinations of resilience and vigor, but with no or-ganization. Systems with little or no organization, such as nutrient enriched lakes, streams and ponds, or early successional ecosystems dominated exclu-sively by ‘r’ selected species, are ‘eutrophic’. The third plane indicates systems that are characterized by various combinations of vigor and organization, but no resilience. Natural variation in external environ-ments preserves resilience preventing systems from reaching the extreme of this plane, but certain highly managed systems, such as agriculture, aquaculture, and plantations, approach this plane and are ‘brit-tle’. Crystallized, eutrophic, and brittle systems are not healthy. Instead, a healthy system is characterized by some balance between vigor, organization, and re-silience. We propose that a ‘healthy’ system is one that can develop an efficient diversity of components and exchange pathways (high organization) while main-taining some redundancy or resilience as insurance against stress, and substantial vigor to quickly recover or utilize stress in a positive manner.
Quantifying system vigor, organization, and resilience
We have begun to develop and test quantitative mea-sures of systems vigor, organization, and resilience us-ing a combination of data from field experimentation, simulation modeling, and network analysis studies. This data will allow various indices of vigor, organi-zation, and resilience to be calculated and compared over a range of scales. If these tests are encourag-ing, then the indices most capable of measuring vigor, organization, and resilience can be formulated into an integrated assessment of ecosystem health
applica-ble to large scale ecosystems, economic systems, and ecological economic systems.
Measuring vigor
Vigor is the most straightforward of the three compo-nents to measure. Vigor can be measured directly and relatively easily by existing methods in most systems. Examples include Gross Primary Production (GPP) and organism metabolism in ecological systems and Gross Domestic Product (GDP) in economic systems. These empirical measures quantify the magnitude of input (material or energy) available to an ecosystem (GPP), or the overall activity (measured in dollars per unit time) of an economic system. But, as investigators in several fields have long recognized, vigor alone is not an adequate measure of health.
Measuring organization
only the number of different species in a system, but, more importantly, how they are organized.
Ulanowicz (1986) described the quantification of AMI along with several other systems-level, network analysis indices in detail, so we provide only a brief summary. The first step in quantifying these indices is to estimate a matrix of material and energy exchanges between system components. Each cell in the matrix carries the label Tij designating a specific transfer
from a particular component in row i to a particular component in column j. Estimating matrices of this type for ecosystems is difficult, but with field exper-iments directed at estimating trophic transfers (such as various tracer experiments and feeding patterns), improvements in simulation modelling, and the de-velopment of modelling software such as ECOPATH (Christensen & Pualy, 1992) our abilities are increas-ing. The systems-level information indices can then be quantified using the conditional probabilities cal-culated from these matrices. One can gain valuable insight into ecosystem structure and function by study-ing the changes in these indices which accompany ecosystem perturbations.
Ulanowicz (1986) identified mutualism or auto-catalysis between system components, connected by cyclic flow, as a nonmechanistic, ecosystem phenom-enon which provides evolution and ecological succes-sion with a sense of direction. This natural process dictates the behavior of the system-level information indices. In autocatalysis an increase in the activity of any component increases the activity of all other members in the cycle and ultimately itself, resulting in configurations that are growth enhancing via posi-tive feedback. These autocatalytic configurations also exert selection pressure on their members. If a more efficient species enters the cycle, its influence on the cycle will be positively reinforced, or if the species is less efficient, negative reinforcement will decrease its role. In addition, as the autocatalytic cycle increases its activity it adsorbs resources from its surroundings. Therefore, as ecosystems undergo the process of suc-cession in the absence of stress autocatalysis increases the amount of material being transported throughout the system and the efficiency by which its members transfer material and energy. Finally, different mem-bers may come and go, but the fundamental structure of the autocatalytic cycle remains, making the loop independent of its constituents.
Ulanowicz (1986) argued that autocatalysis stream-lines the topology of interconnections in a manner that favors those transfers that more effectively engage in
autocatalysis at the expense of those that do not, re-sulting in networks that tend to become dominated by a few intense flows. For example, as specialists replace generalists in the process of ecological succession each species or system component exchanges mate-rial along fewer pathways. Ulanowicz (1995) then described how these effects can be quantified using a modified average mutual information equation. The statementp(ai, bj)refers to the probability that a unit
of medium leaves componentiand enters component
j (Tij). Because T is the aggregate of all such system transfers, we can estimate p(ai, bj)byTij/T. Sim-ilarly, p(bj), the probability that a quantum enters elementj, will be estimated byPTj/T. Finally, the conditional probabilityp(bjI ai), that a quantum
en-tersj after leavingiis approximated byTij/(PTi.).
Substituting these estimators into the equation for av-erage mutual information yields an equation which quantifies the degree to which autocatalysis has orga-nized or streamlined the system’s flow structure.
AMI = XTij/T log(TijT /T.jTi.)
Ulanowicz (1986) also developed two related con-cepts. First, he scales the average mutual information equation by the total system throughput (since au-tocatalysis tends to increase T) to yield a network property called system ascendancy (A).
A = T I =XTij log(TijT /T.jTi.)
positive relationship between ascendency and ecosys-tem development using a general model of ecological succession.
Ulanowicz (1986) identified a third information in-dex: ‘system uncertainty’ (H). This is the upper bound on the total uncertainty if we had no information re-garding material exchange. Uncertainty also reflects the total complexity of the system,
H = X(Tij/T ) log(Tij/T )
or the total number of potential pathways of ma-terial exchange between system components. As a natural system develops, and autocatalysis streamlines the exchange network, AMI increases approachingH
as information replaces uncertainty. Ulanowicz mul-tiplies H by total system throughput (T) to yield ‘de-velopment capacity’ (C). Therefore, with ecosystem development in the absence of perturbation, as AMI approaches H; A approaches C.
Measuring resilience
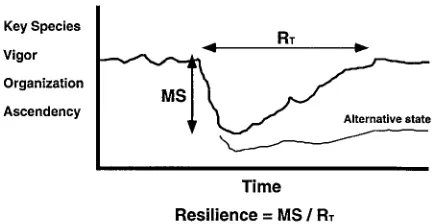
Measuring the resilience of a system is difficult be-cause it implies the ability to predict the dynamics of that system under stress. Predicting ecosystem impacts over time generally requires dynamic simulation mod-els (Costanza et al., 1990). There are two different definitions on resilience in the literature. Pimm (1984) defines resilience as the time it takes for a system to re-cover from stress. Holling (1986) defines resilience as the magnitude of stress beyond which the system never recovers its former state. Figure 4 illustrates these two components of resilience (Mageau et al., in press).
We combine these two ideas into a single mea-sure of resilience. The Recovery Time (RT) can be
estimated simply by measuring the time it takes for a system to recover from a wide variety of stresses to some previous steady state. Mageau et al. (in press) demonstrated how the maximum magnitude of stress (MS) from which a system can recover can be measured by progressively increasing simulated stress until the system reverts to some new steady state, and documenting the magnitude of the stress that caused the shift. We then propose that an overall measure of resilience can be obtained from the ratio ofMS/RT.
When calculating this measure of system resilience the choice of indicators to be tracked over time is very important. The ordinate axis in Figure 4 indicates the candidates for this function. The population of a single species would be easiest to track, but would tell us
Figure 4. The two components of resilience, and how they are in-tegrated into a single quantitative measure. Candidates for tracking sytem performance through time are listed on the vertical axis. The lower line indicates the alternative state of a system which was unable to completely recover from stress.
the least about the entire system’s response to stress. As discussed earlier, increasingly complicated mea-sures such as those suggested for vigor, organization and their combination (ascendency) will tell us more about the systems response, but at the expense of ease of measure and reliability. Mageau et al. (in press) concluded that AMI may serve as the most sensitive indicator for this purpose.
This comprehensive empirical measure of re-silience can be used to test the ability of other indi-cators to serve as proxies or quantitative measures of resilience. The first potential proxy is the ratio of gross primary production per unit respiration (GPP/R). This ratio is a measure of the excess vigor or energy avail-able to the system. Our hypothesis is that as this ratio increases a system has more energy in reserve which will allow it to recover from stress more easily and quickly. To test this hypothesis we plan to study the correlation between the empirically measured value of resilience and the GPP/R ratio.
between weighted systems overhead and our empirical measure of resilience will be determined.
In conclusion, field experiments, network analy-sis, and simulation modelling studies can be used to generate trophic exchange networks. These networks can then be used to calculate Ulanowicz’s (1986) sys-tem level information indices (TST, AMI, H), the field measures (GPP, Biodiversity, and GPP/R) and the empirical measure of resilience (MS/Rt) to test their ability to serve as proxies for measuring our three main components (vigor, organization, and resilience) of system health.
A network analysis-based quantitative assessment of ecosystem health
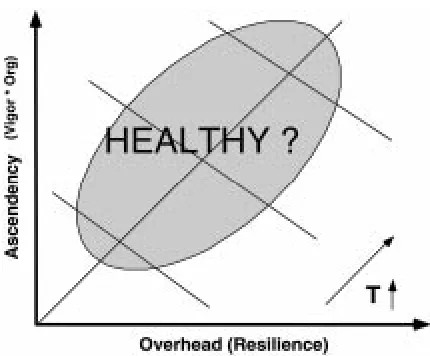
In this section we demonstrate how vigor, organiza-tion, and resilience can be folded into a single hensive assessment of ecosystem health. This compre-hensive health assessment could be constructed using any of the various measures of Costanza’s (1992) three components of health. For example, Mageau et al. (1995) illustrated an ecosystem health plot based entirely on the network analysis measures of vigor, organization, and resilience. If vigor, organization, and resilience are approximated by TST, AMI and H-AMI, respectively, then the fundamental components of ecosystem health suggested by Costanza (1992) could be quantified given only a system’s network of material exchanges. Taken a step further, ascendancy can be calculated by (TST∗AMI), and overhead can be calculated by (TST∗(H-AMI)). Therefore, a quan-titative assessment of ecosystem health which depicts a system’s ascendancy versus its overhead can easily be constructed (Figure 5). As the vigor of a system in-creases the system is driven out away from the origin. The position of the system in regard to the diagonal depends on the relative ratio of ascendency to over-head. A highly ascendent or organized system will plot above the diagonal, and a system with high overhead or resilience will plot below the diagonal. As a general hypothesis, we believe that systems with a balance be-tween organization and resilience within a given range of system vigor can be characterized as ‘healthy’. In other words, an ecosystem must be free to develop in the absence of serious perturbation to realize its full potential while maintaining adequate resilience to in-sure against stress, and vigor to quickly recover from small-scale perturbations.
Figure 5. A conceptual diagram of the network analysis-based quantitative index of ecosystem health. The ‘healthy’ region is indi-cated by the shaded area, and represents a balance between system vigor, organization, and resilience.
Ulanowicz’s (1980) increasing ascendency hy-pothesis provides the criteria by which a system’s trajectory through development is analyzed. ‘Healthy’ ecosystems are those characterized by unimpeded nat-ural development trajectories. In general, as ecosys-tems develop following some large-scale perturbation, their characteristic trajectories move along the plot from an area of low ascendency and high resilience to an area of higher ascendency and lower resilience. However, these trajectories differ depending on the predictability of the system’s external environment. All natural environments have some degree of unpre-dictability, and this natural uncertainty will ultimately impede the development trajectory of the system, pro-tecting it from excessive loss of resilience. Due to wide fluctuations in the relative predictability of natural en-vironments the ‘healthy’ region is system specific. For example, estuaries are very dynamic environments rel-ative to the open ocean. Therefore, the healthy region for estuaries will shift towards the resilient portion of the plot, and that of the open ocean will shift towards the ascendent portion. With a general knowledge of this background natural perturbation, we can quantify the effects of more dramatic anthropogenic pertur-bations on the development trajectories or ‘health’ of ecosystems. Thresholds which signal the point at which a system can no longer recover from a pertur-bation may be determined and used as the outline for a system’s ‘healthy’ region.
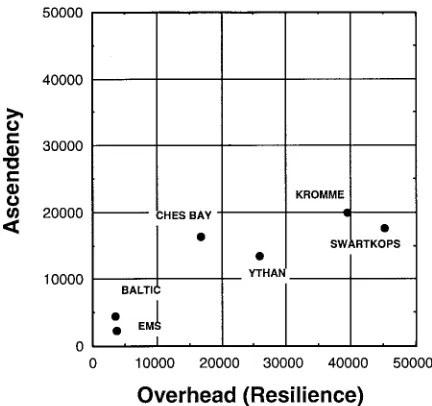
Figure 6. A comparison of the relative positions of six different estuaries using the network analysis-based assessment of ecosystem health.
et al., 1989). We initially tested our ecosystem health assessment using exchange networks representing six different estuaries (Baird & Ulanowicz, 1993). The resulting plot indicates the position of each estuary in regards to its characteristic ascendency, overhead, and total system throughput (Figure 6). The com-bined effects of natural and anthropogenic stress on the degree of system development are illustrated by the ecosystem health plot. For example, the Swartkops and Kromme estuaries have the highest values of total system throughput. The Swartkops is a warm, pro-ductive, well-mixed estuary subject to high levels of agricultural and industrial pollution, and is, therefore, subject to high levels of both natural and anthro-pogenic stress which have hindered its development. The Kromme estuary is also subject to high levels of natural perturbation due to its extremely unpredictable environment, but it is a relatively pristine estuary, and this may explain its more ‘healthy’ position on the ecosystem health plot. Similar arguments can be made for the other estuaries. Given data sufficient to construct reasonable estimates of exchange networks, comparative plots are an excellent way to quantify the relative health of various similar ecosystems (Baird & Ulanowicz, 1993).
Several flow networks have also been generated us-ing simulation model output (Wulff et al., 1989). Esti-mating flow networks using simulation models allows one to study the time series of a system’s response to a perturbation, and also to study the effects of many
dif-Figure 7. A comparison of the relative position of an open-ocean plankton community various days after an upwelling event using the network analysis-based assessment of ecosystem health.
ferent perturbations. The position of successive days following the simulated effects of an upwelling event using data from the southern Benguela region (Field et al., 1989) is shown in Figure 7. Essentially, this plot illustrates the successional development trajectory of an open ocean plankton community recovering from a natural perturbation. According to Field et al. (1989), the upwelling event provides a pulse of nitrogen, and flushes most members of the plankton community out of the system. In the initial days of the simulation the pulse of phytoplankton growth and associated in-crease in total system throughput both begin to decline along with an increase in system overhead. But, as time progresses, and nitrogen limitation increases, the relative ascendency begins to increase at the expense of overhead as competition for limiting nitrogen in-creases system efficiency. By the 18th day following the upwelling event the simulated system has returned to a condition characterized by high ascendency, low overhead, and low total system throughput – exactly what you might expect for a highly efficient, nutrient limited, open ocean, plankton community.
Conclusions
vigor, organization, and resilience can be folded into a comprehensive assessment of ecosystem health, and provide an example using the network analysis in-dices. Finally, the potential of such an assessment was demonstrated using a variety of flow networks obtained from (Wulff et al., 1989). In general, we feel the proposed health assessment has the potential to allow comparison of the relative health of similar ecosystems, and the response of particular systems to natural or anthropogenic stress.
The various indices described in this paper need to be compared, and their potential for serving as useful measures of vigor, organization, and resilience needs to be tested. Trophic exchange networks from a wide variety of aquatic ecosystems (Christensen, 1995) will be required for such an analysis. The various measures of vigor, organization, and resilience can then be com-bined to form overall ecosystem health plots, and these plots can be compared to hypothetical plots based on existing theory (Ulanowicz, 1986; Odum, 1969) and the results of theoretical modelling studies (Mageau et al., in press).
References
Baird D and Ulanowicz RE (1993) Comparative study on the trophic structure, cycling and ecosystem properties of four tidal estuaries. Mar Ecol Prog Ser 99: 221–237
Barber M, Patten B and Finn J (1979) Review and evaluation of I-O flow analysis for ecological applications. In: Matis J, Patten B and White G (eds.), Compartmental Analysis of Ecosys-tem Models. Vol. 10 of Statistical Ecology. Bertonsville, Md.: International Cooperative Publishing House
Bayne BL (1987) The Effects of Stress and Pollution on Marine Animals. Praeger, New York
Christensen V (1995) Ecosystem maturity - Towards quantification. Ecol Model 77: 3–32
Christensen V and Pualy D (1992) ECOPATH II – a software for balancing steady-state ecosystem models, and calculating netwok characteristics. Ecol Model 61: 169–185
Costanza R (1992) Toward an operational definition of health. In: Costanza R, Norton B and Haskell B (eds.) Ecosystem Health: New Goals for Environmental Management. Island Press, Wash-ington DC
Costanza R and Neill C (1984) Energy intensities, interdepen-dence, and value in ecological systems: A linear programming approach. J Theor Biol 106: 41–57
Costanza R, Norton B and Haskell BJ (1992) Ecosystem Health: New Goals for Environmental Management. Island Press, Wash-ington DC
Costanza R and Maxwell T (1993) Resolution and predictability: an approach to the scaling problem. Landscape Ecol 9: 47–57 Costanza R and Patten BC (1995) Defining and predicting
sustain-ability. Ecol Econ 15: 193–196
Costanza R and Sklar FH (1985) Articulation, accuracy, and effec-tiveness of mathematical models: A review of freshwater wetland applications. Ecol Model 27: 45–68
Costanza R, Sklar FH and White ML (1990) Modeling coastal landscape dynamics. BioScience 40: 91–107
Cumberland JH (1987) Need economic development be hazardous to the health of the Chesapeake Bay? Mar Resour Econ 4: 81–93 Daly H (1968) On economics as a life science. J Political Econ 76:
392–406
Field JG, Moloney CL and Attwood CG (1989) Network analysis of simulated succession after an upwelling event. In: Wulff F, Field JG and Mann KH (eds) Network analysis of marine ecosystems: methods and applications. Coastal and Estuarine Studies Series (Chapter 7) Springer-Verlag, Heidelberg
Finn J (1976) The cycling index. J Theor Biol 56: 363–373 Funderlic R and Heath M (1971) Linear Compartmental Analysis
of Ecosystems. ORNL-IBP-71-4. Oak Ridge, Tenn.: Oak Ridge National Laboratory
Hannon B (1973) The structure of ecosystems. J Theor Biol 41: 535–546
Hannon B (1976) Marginal product pricing in the ecosystem. J Theor Biol 56: 256–267
Hannon B (1979) Total energy costs in ecosystems. J Theor Biol 80: 271–293
Hannon B (1985a) Ecosystem flow analysis. Can Bull Fish Aquat Sci 213: 97–118
Hannon B (1985b) Conditioning the ecosystem. Math Biol 75: 23– 42
Hannon B (1985c) Linear dynamic ecosystems. J Theor Biol 116: 89–98
Hannon B and Ruth M (1994) Dynamic Modeling. Springer-Verlag, New York
Holling CS (1978) Adaptive Environmental Assessment and Man-agement. Wiley, London
Holling CS (1986) The resilience of terrestrial ecosystems: Lo-cal surprise and global change. In: Clark WC and Munn RE (eds) Sustainable Development of the Biosphere. Cambridge University Press, Cambridge
Holling CS (1987) Simplifying the complex: The paradigms of ecological function and structure. Eur J Operat Res 30: 139–146 Isard W (1972) Ecologic-Economic Analysis for Regional
Develop-ment. Free Press, New York
Karr JR (1991) Biological integrity: A long neglected aspect of water resource management. Ecol Appl 1: 66–84
Leontief W (1941) The Structure of the American Economy, 1919– 1939. Oxford University Press, New York
Mageau MT, Costanza R and RE Ulanowicz (1995) The develop-ment and initial testing of a quantitative assessdevelop-ment of ecosystem health. Ecosyst Health 1: 201–213
Mageau MT, Costanza R and Ulanowicz RE (In press) Quantifying the trends associated with developing ecosystems. Ecol Model Odum EP (1969) The strategy of ecosystem development. Science
164: 262–270
Odum HT (1971) Environment, Power and Society. Wiley, New York
Pimm SL (1984) The complexity and stability of ecosystems. Nature 307: 321–326
Rapport DJ (1992) Evaluating ecosystem health. J. Aquat Ecosyst Health 1: 15–24
Rapport DJ, Regier HA and Hutchinson TC (1985) Ecosystem behavior under stress. Am Nat 125: 617–640
Science Advisory Board (1990) Reducing Risk: Setting Priorities and Strategies for Environmental Protection. SAB-EC-90-021. EPA, Washington
Ulanowicz RE (1980) A hypothesis on the development of natural communities. J Theor Biol 85: 223–245
Ulanowicz RE (1986) Growth and Development: Ecosystems Phe-nomenology. Springer-Verlag, New York
Ulanowicz RE (1995) The propensities of evolving systems. In: Khalil EL and Boulding KE (eds) Social and Natural Complexity Wulff F and Ulanowicz RE (1989) A comparative anatomy of the Baltic Sea and Chesapeake Bay ecosystems. In: Wulff F,
Field JG and Mann KH (eds.) Network analysis of marine ecol-ogy: methods and applications. Coastal and Estuarine Studies Series (Chapter 11) Springer-Verlag, Heidelberg