R E S E A R C H
Open Access
The association between serum
25-hydroxyvitamin D3 concentration and
serum lipids in the rural population of
China
Huina Ge, Hualei Sun, Teng Wang, Xinxin Liu, Xing Li, Fei Yu, Han Han, Jun Wang and Wenjie Li
*Abstract
Background:Vitamin D deficiency is implicated in some diseases, including cardiovascular. Few studies have assessed the correlation between 25-hydroxyvitamin D3 [25(OH) D3] and serum lipids. In this study, we explored the correlation between serum 25(OH) D3 concentrations and serum lipids with a typical sample of the rural population in China.
Methods:Face-to-face research was used to gather some basic information. Fasting serum concentrations of 25-(OH) D3, total cholesterol (TC), triglyceride (TG), HDL cholesterol (HDL-C) and, LDL cholesterol (LDL-C) tested in the laboratory.
Results: The mean of serum 25(OH) D3 level was 28.71 ± 29.29 ng/mL. The results showed that the dyslipidemia was strongly associated with gender (P= 0.031), drinking (P= 0.043), high-fat diet intake (P= 0.017), HDL-C (P<0), TG (P<0), body mass index (BMI) (P<0) and serum 25(OH)D3 levels (P= 0.002). There was a positive correlation between serum 25(OH)D3 and HDL-C (P<0) in all groups. The relationship between 25(OH) D3 and LDL-C (P= 0.024) was discovered only in normal lipid group. The multivariable adjusted odds ratio (95%CI) of hypoalphalipoproteinemia/HDL and dyslipidemia by comparing the sufficiency vs. the deficiency serum 25-(OH) D3 level were 0.31 (0.192, 0. 499) (P = 0.001) and 0.52 (0.36, 0.73) (P = 0.005), respectively.
Conclusions: Serum 25(OH) D3 concentrations were associated with the serum lipids level and the association was different in normal serum lipid group and dyslipidemia group. With the increase of serum 25(OH) D3 levels, the incidence of dyslipidemia decreased.
Keywords:25(oh)D3, Dyslipidemia, Serum lipid
Background
Vitamin D is advised to have many functions such as regulating calcium homeostasis and bone metabolism, adjusting immune function, decreasing insulin resistance and anti-inflammatory effect [1–4]. Vitamin D could be obtained from diet including some types of fish, cereals, dairy products and vitamin D supplements [5]. The main way of obtaining vitamin D is getting enough sun expos-ure. When the skin is exposed to solar UV radiation, 7-dehydrocholesterol can be transformed to previtamin D3. Previtamin D3 could be hydroxylated into
25-hydroxyvitamin D3 [25(OH) D] in the liver and then hydroxylated into 1, 25-dihydroxyvitamin D [1, 25(OH)2 D] in the kidney [6, 7]. Vitamin D deficiency has become a pandemic, furthermore it is an under-diagnosed and under-treated vitamin deficiency [8, 9]. Vitamin D defi-ciency is also indiscriminate in individuals without re-spect to their age, race and geography. The serum concentration of 25-hydroxyvitamin D >30 ng/mL is suf-ficiency and can realize the vitamin D’s beneficial effects maximization for health. When the sun exposure is in-sufficiency, the children and adults need to intake at least 800–1000 IU vitamin D3/day [10].
Dyslipidemia including hypercholesterolemia and hypertriglyceridemia causes a serious danger to people’s * Correspondence:[email protected]
Department of Nutrition and Food Hygiene, College of Public Health, Zhengzhou University, Henan 450001, China
health in universal population. It is also an important risk factor for the occurrence of cerebral ischemic and coronary heart disease [11, 12]. A recent study has shown that vitamin D insufficiency evidently causes the mechanism of esophageal, renal, lung, gastric, endomet-rial cancer and non-Hodgkin’s lymphoma [13]. Vitamin D deficiency is associated with elevated levels of some biomarker of cardiovascular risk in a United States population [14]. There was a correlation between vita-min D deficiency and the increasing serum levels of TC and LDL-C, as well as the decreasing serum levels of HDL-C [15–20]. However, the conclusions are inconsist-ent and relationships often disappeared after adjusting for confounding factors [17, 18, 20, 21].
The purpose of this study was to analyze the relation-ships of 25-hydroxyvitamin D3 [25(OH) D3] concentra-tions and serum lipid including serum level of TC, TG, HDL-C, LDL-C and with the incidence of dyslipidemia in rural population of China.
Methods
Study design and population
Participants were collected from a cross-sectional study in three different arears, including Wuzhi, Xin’an and Houzhai county of Henan Province in China from July 2013 to August 2015. The acceptance
criteria to participate included recruitment between aged of 18–79 years, lack of liver disease, stroke, kid-ney disease, and infectious disease. A total of 1191 participants completed the physical examination and questionnaire, but only 1084 participants conform to the acceptance criteria (Fig.1).
Data collection and laboratory measurements
Anthropometric measurements were performed accord-ing to normative procedures. Height and weight (with-out (with-outdoor wear and shoes) were measured to the nearest 0.1 cm and 0.1 kg using an electronic scale. Body mass index (BMI) was acquired by the formula: BMI = weight (kg)/height (m2). All demographic data were obtained by face to face investigation. The ques-tionnaire was accomplished by well-trained interviewers, containing information on demographic characteristics (gender, age, name, education level, occupation,et,al),life styles (smoking, alcohol drinking, drinking tea, intakes of vegetable, fruit and fat,et,al), the individual history of disease (stroke, liver disease, kidney disease, infectious disease,et,al).
Blood samples
Fasting venous blood samples collection (10 mL) were accomplished between 6:00 am and 9:00 am by
trained nurse after at least 8 h of fasting. Blood samples were collected with a vacuum blood tube and centri-fuged with 3000 rpm for 15 min, aliquoted and stored at −80 °C until further using.
Laboratory measurements
Serum 25(OH) D3 was a better indicator of vitamin D status than 1,25(OH)2D3 [22]. Serum concentration of 25(OH) D3 was measured by an enzyme-linked im-munosorbent assay (ELISA) according to the product specifications [Sangon Biotech (Shanghai) Co., Ltd., China]. The microplate reader (BIO-RAD680, USA) was used to measure the absorbance (450 nm). The stronger of the color, the lower concentrations of the 25(OH) D3. The inter-assay CV of the total process was ≤9.9% for 25(OH) D3. The serum status of TC, TG, HDL-Ctested by biochemistry analyzer (KHB360, Shanghai, China). The detection method of TC, TG, HDL-C and LDL-C were GPO-PAP, GHOD-PAP, direct method of catalase clearance and direct method of surfactant removal, respectively.
Diagnostic criteria
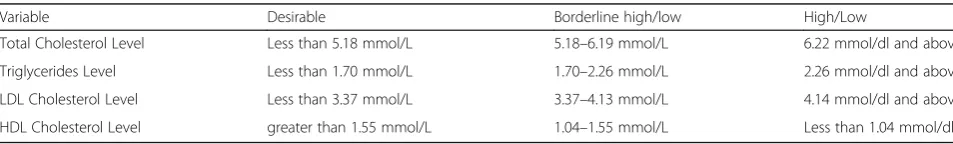
In this study the serum 25(OH) D3 levels<20 ng/mL were confirmed as vitamin D deficiency. 25(OH) D3 levels were insufficient between 20 ng/mL to 30 ng/mL and 25(OH) D3 status>30 ng/mL was sufficiency [23, 24]. The category of TC, TG, HDL-C and LDL-C were showed in Table 1 [25]. The diagnostic criteria of dyslip-idemia are defined according to serum lipids status. The cut-off values for higher triglyceride, higher cholesterol, lower high density lipoprotein and higher low density
lipoprotein were 2.26 mmol/L, 6.22 mmol/L,
1.04 mmol/L and 4.14 mmol/L [12].
Statistical analysis
Participants were divided into two groups according to serum lipid levels, including normal lipid group and dys-lipidemia group. The participant in the case group and the control group were divided into three groups ac-cording to the serum 25(OH) D3 level, including vitamin D deficiency group [25(OH) D3<20 ng/mL], vitamin D insufficiency group [20 ng/mL ≤25(OH) D3<30 ng/mL] and vitamin D sufficiency group [25(OH) D3 ≥ 30 ng/ mL]. The characteristics of participants were presented as relative frequency (%) for categorical variables. The
characterization of continuous variables was presented as means and standard deviation (SD). The chi square test was used to compare the differences of categorical variables and continuous variables using One-way ana-lysis of variance (ANOVA) and t test (normally continu-ous variables).
Adjusted odds ratios for dyslipidemia status and serum lipid levels (TG, TC, HDL-C and LDL-C) comparing each groups of serum 25(OH) D3 to the lowest serum 25(OH) D3 levels group were analyzed using logistic re-gression. We used 2 models to adjust the confounding factors. Sex, age and education (high school and above, below high school) were adjusted in model 1. Smoking (never, former, current), drinking (yes, no), high-fat diet (a litter or no, greater than or equal to 25 g/day), tea (yes, no) and vegetables and fruits (a little or no, greater than or equal to 500 g/day) were adjusted in model 2.
We also estimated the interactions between serum 25(OH) D3 levels and gender, education, smoking status, alcohol drinking, vegetables and fruits, tea and high-fat diet. The statistical analyses were carried out by SPSS 17.0 software package (SPSS Inc., Chicago, IL, USA) and STATA version 11.0 (STATA Corp, College Station, Texas, USA). All p values were two-sided and <0.05 were considered to be statistically significant.
Ethics statement
The protocol this research was consented by the Ethics Committee of the Zhengzhou University. All participants were asked to sign the protocol.
Results
General characteristics of study participants
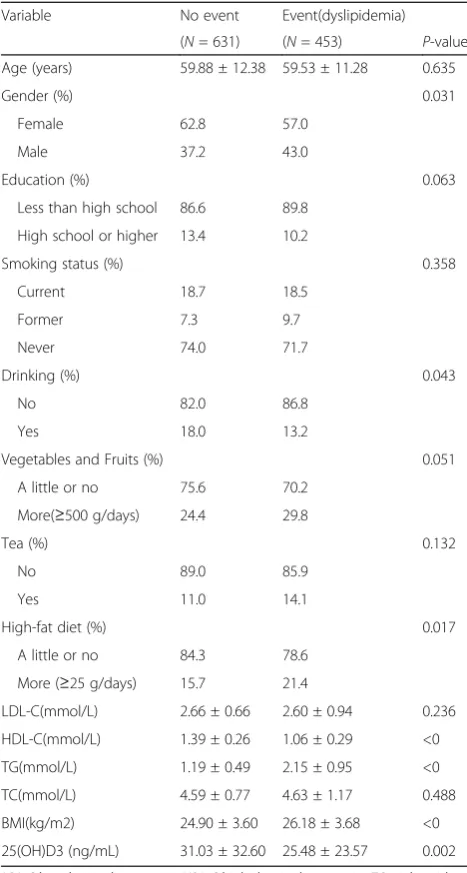
The mean of serum 25(OH) D3 levels in the study popu-lation was 28.71 ng/mL. The overall prevalence of dys-lipidemia was 41.79%. Participants with dysdys-lipidemia were more likely to be male (P = 0.031), and to have a higher body mass index (P<0), lower serum 25(OH) D3 concentrations (P<0), higher fat intake (P = 0.017), higher triglycerides levels (P<0) and lower HDL choles-terol levels (P<0) (Table 2).
The correlation between serum 25(OH) D3 concentrations and serum lipids
Anthropometric characteristics and clinical outcome of all participants were presented in Table 2. Among the
Table 1The category of Total Cholesterol, Triglycerides Level, HDL Cholesterol and LDL Cholesterol level
Variable Desirable Borderline high/low High/Low
Total Cholesterol Level Less than 5.18 mmol/L 5.18–6.19 mmol/L 6.22 mmol/dl and above
Triglycerides Level Less than 1.70 mmol/L 1.70–2.26 mmol/L 2.26 mmol/dl and above
LDL Cholesterol Level Less than 3.37 mmol/L 3.37–4.13 mmol/L 4.14 mmol/dl and above
1084 participants (430 men and 654 women) and the mean age was 59.7 years old. The overall percentage of vitamin D deficiency, vitamin D insufficiency and vita-min D sufficiency were 53.1%, 29.5% and 19.4%, respect-ively. Serum 25(OH) D3 levels were positively related to HDL-C (P<0) in normal serum lipid group and dyslipid-emia group. The negative relationship founded between the serum 25(OH) D3 level and LDL-C (P = 0.024) in normal serum lipid group (Table 3). The unadjusted odds ratio (95% CI) and multivariable adjusted odds ra-tio (95% CI) for higher triglyceride, higher cholesterol, higher low density lipoprotein and lower high density
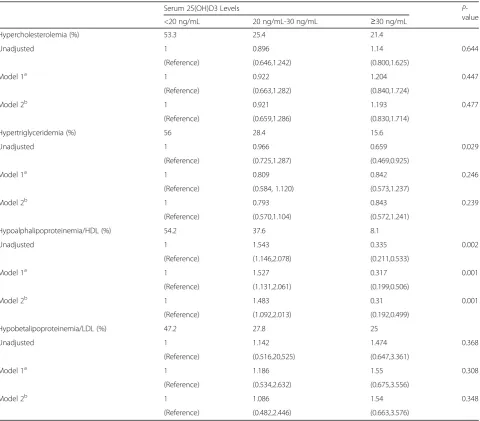
lipoprotein comparing the vitamin D sufficient to the vitamin D deficiency were presented in Table 3. After adjusting for sex, age and education, the odds ratio (95%) for hypobetalipoproteinemia/HDL decreased obvi-ously in vitamin D sufficient compare to vitamin D
defi-cient. The multivariable adjusted OR (95%) for
hypoalphalipoproteinemia/HDL comparing the vitamin D sufficient to the vitamin D deficiency was 0.31(0.192, 0.499) (P = 0.001) (Table 4). Figures 2, 3, 4 and 5 pre-sented the proportion of serum TC, TG, HDL-C and LDL-C levels according to the 25(OH) D3 level. We could observe from the Figs. 3 and 4 that the proportion of desiable triglycerides level and HDL cholesterol level increased with the increasing of serum 25(OH) D3 levels. Obviously, the information suggested that serume 25(OH) D3 concentrations were associated with blood lipid.
The relationships between the occurrences of dyslipidemias and serum 25(OH) D3 concentrations The unadjusted odds ratio (95% CI) and multivariable adjusted for dyslipidemia comparing the vitamin D suffi-cient to the vitamin D deficiency were presented in Table 5. After adjusting for sex, age and education, the odds ratio (95%) for dyslipidemias decreased obviously in vitamin D sufficient compare to vitamin D deficient. The multivariable adjusted OR (95%) for dyslipidemia comparing the vitamin D sufficient to the vitamin D de-ficiency was 0.52 (0.36, 0.73). Figure 6 showed adjusted odds ratios (95% CI) for dyslipidemia comparing the serum vitamin D sufficient vs serum vitamin D deficient, summarizing the association between serum lipid and 25(OH) D3 concentrations. In addition, with the de-creasing concentration of 25(OH) D3, the increase in the prevalence of dyslipidemia was linear (F-value = 4.65; p= 0.031 for trend), indicating a significant relationship.
Discussion
Vitamin D deficiency and insufficiency has become a popular public health problem in the word [26]. Our study was actualized in China, a countryside with mean serum vitamin D levels (28.71 ng/mL). In our cross-sectional study, low serum 25(OH) D3 levels were asso-ciated with higher prevalence of dyslipidemia. Compared to the dyslipidemia, participants in the normal serum lipids group had a higher level of serum 25(OH) D3 by 5.55 ng/mL. These discovery is clinically and epidemio-logically important. Previous studies had proved that vitamin D deficiency was a risk factor for cardiovascular disease [27], type 2 diabetes [28–30], blood pressure [31] and obesity [32]. The serum lipids status is the major risk factors for dyslipidemias. Our results showed that serum 25(OH) D3 levels had a positive association with HDL-C in the whole crowd and negative correlation
Table 2Characteristics of the study population by dyslipidemia status
Variable No event Event(dyslipidemia)
(N= 631) (N= 453) P-value
Age (years) 59.88 ± 12.38 59.53 ± 11.28 0.635
Gender (%) 0.031
Female 62.8 57.0
Male 37.2 43.0
Education (%) 0.063
Less than high school 86.6 89.8
High school or higher 13.4 10.2
Smoking status (%) 0.358
Current 18.7 18.5
Former 7.3 9.7
Never 74.0 71.7
Drinking (%) 0.043
No 82.0 86.8
Yes 18.0 13.2
Vegetables and Fruits (%) 0.051
A little or no 75.6 70.2
More(≥500 g/days) 24.4 29.8
Tea (%) 0.132
No 89.0 85.9
Yes 11.0 14.1
High-fat diet (%) 0.017
A little or no 84.3 78.6
More (≥25 g/days) 15.7 21.4
LDL-C(mmol/L) 2.66 ± 0.66 2.60 ± 0.94 0.236
HDL-C(mmol/L) 1.39 ± 0.26 1.06 ± 0.29 <0
TG(mmol/L) 1.19 ± 0.49 2.15 ± 0.95 <0
TC(mmol/L) 4.59 ± 0.77 4.63 ± 1.17 0.488
BMI(kg/m2) 24.90 ± 3.60 26.18 ± 3.68 <0
25(OH)D3 (ng/mL) 31.03 ± 32.60 25.48 ± 23.57 0.002
LDL-Clow-density lipoprotein,HDL-Chigh-density lipoprotein,TGtriglycerides,
Table 3The correlation between serum 25(OH) D3 concentrations and serum lipids
Variable Serum 25(OH)D3 Levels
<20 ng/mL 20 ng/mL-30 ng/mL ≥30 ng/mL P -value
<20 ng/mL 20 ng/mL-30 ng/mL ≥30 ng/mL P -value
No event Event(dyslipidemia)
(N= 331) (N= 150) (N = 150) (N= 245) (N= 148) (N= 60)
LDL-C (mmol/L) 2.68 ± 0.67 2.78 ± 0.69 2.56 ± 0.67 0.024 2.58 ± 0.91 2.62 ± 0.84 2.62 ± 1.22 0.920
HDL-C (mmol/L) 1.39 ± 0.25 1.34 ± 0.24 1.47 ± 0.28 <0 1.06 ± 0.30 0.98 ± 0.21 1.24 ± 0.34 <0
TG (mmol/L) 1.21 ± 0.50 1.23 ± 0.46 1.11 ± 0.48 0.084 2.14 ± 0.95 2.11 ± 0.91 2.29 ± 1.01 0.457
TC (mmol/L) 4.60 ± 0.76 4.65 ± 0.76 4.52 ± 0.82 0.358 4.61 ± 1.16 4.56 ± 1.01 4.89 ± 1.55 0.171
BMI (kg/m2) 24.96 ± 3.73 24.80 ± 3.42 24.81 ± 3.48 0.891 26.14 ± 3.84 25.84 ± 3.45 27.19 ± 3.47 0.055
25(OH)D3 (ng/mL) 14.98 ± 2.87 23.96 ± 2.79 73.31 ± 44.97 15.39 ± 3.06 23.65 ± 2.59 71.22 ± 40.53
Table 4Adjusted odds ratios (95%CI) for the presence of hypercholesterolemia, hypertriglyceridemia, hypoalphalipoproteinemia/ HDL and hypobetalipoproteinemia/LDL comparing the two highest 25(OH) D3 levels to the deficiency of serum 25(OH) D3 levels, respectively
Serum 25(OH)D3 Levels P
-value
<20 ng/mL 20 ng/mL-30 ng/mL ≥30 ng/mL
Hypercholesterolemia (%) 53.3 25.4 21.4
Unadjusted 1 0.896 1.14 0.644
(Reference) (0.646,1.242) (0.800,1.625)
Model 1a 1 0.922 1.204 0.447
(Reference) (0.663,1.282) (0.840,1.724)
Model 2b 1 0.921 1.193 0.477
(Reference) (0.659,1.286) (0.830,1.714)
Hypertriglyceridemia (%) 56 28.4 15.6
Unadjusted 1 0.966 0.659 0.029
(Reference) (0.725,1.287) (0.469,0.925)
Model 1a 1 0.809 0.842 0.246
(Reference) (0.584, 1.120) (0.573,1.237)
Model 2b 1 0.793 0.843 0.239
(Reference) (0.570,1.104) (0.572,1.241)
Hypoalphalipoproteinemia/HDL (%) 54.2 37.6 8.1
Unadjusted 1 1.543 0.335 0.002
(Reference) (1.146,2.078) (0.211,0.533)
Model 1a 1 1.527 0.317 0.001
(Reference) (1.131,2.061) (0.199,0.506)
Model 2b 1 1.483 0.31 0.001
(Reference) (1.092,2.013) (0.192,0.499)
Hypobetalipoproteinemia/LDL (%) 47.2 27.8 25
Unadjusted 1 1.142 1.474 0.368
(Reference) (0.516,20,525) (0.647,3.361)
Model 1a 1 1.186 1.55 0.308
(Reference) (0.534,2.632) (0.675,3.556)
Model 2b 1 1.086 1.54 0.348
(Reference) (0.482,2.446) (0.663,3.576)
a
Model 1. Adjusted for sex, age and education (high school or higher vs. less than high school)
b
Fig. 2The proportion of serum TC levels according to the 25(OH) D3 level
Fig. 3The proportion of serum TG levels according to the 25(OH) D3 level
Fig. 4The proportion of serum HDL-C levels according to the 25(OH) D3 level,Ptrend< 0.000
with LDL-C was discovered only in normal serum lipid group. These outcome confirmed that serum vitamin D levels correlate with serum lipids in previous studies [33]. These studies suggest that there is a correlation be-tween vitamin D deficiency and the increasing serum levels of TC and LDL-C, as well as the decreasing serum levels of HDL-C [15–20]. However, the conclusions are inconsistent and relationships often disappeared after adjusting for confounding factors [17, 18, 20]. With in-creasing serum 25(OH)D3 levels, a significant increase was observed in a cross-sectional study [34], but a
significant decrease was found in a 13,331 subjects [35]. Furthermore, these study both made a similar adjust-ments for confounders and have a similar male/female ratio. In our study, no correlation between serum 25(OH) D3 levels and TC were observed and the rela-tionship between LDL-C and serum 25(OH)D3 levels was different in normal serum lipid group and dyslipid-emia group. The reason for this is not clear, and further research is needed.
In our study we found that the prevalence of dyslipid-emia was different in females and males. The reason
Table 5Adjusted odds ratios (95%CI) for the presence of dyslipidemia comparing the two highest 25(OH) D3 levels to the deficiency of serum 25(OH) D3 levels
Serum 25(OH)D3 Levels
<20 ng/mL 20 ng/mL-30 ng/mL ≥30 ng/mL P-value
Dyslipidemia (%) 54.08 32.67 13.24
Unadjusted 1.00 1.33 0.54 0.012
(Reference) (1.01,1.77) (0.38,0.76)
Model 1a 1.00 1.32 0.52 0.006
(Reference) (0.99,1.75) (0.37,0.73)
Model 2b 1.00 1.26 0.52 0.005
(Reference) (0.95,1.69) (0.36,0.73)
a
Model 1. Adjusted for sex, age and education (high school or higher vs. less than high school)
b
Model 2. Further adjusted for smoking (current, former, never), drinking (yes, no), high-fat diet (a little or no, greater than or equal to 25 g/day), vegetables and fruits (a little or no, greater than or equal to 500 g/day), tea (yes, no)
why the prevalence of dyslipidemia was different in fe-males and fe-males is unknown. Possibly, the sex differ-ences in life style such as physical activity, smoking, drinking, fat intake and sun exposure act as con-founders. In addition, the hormone and the sensitivity of hormone receptor were different in males and females. This may affect the metabolism of lipids. We also found that participants with dyslipidemia were more likely to be higher fat intake. This result is consistent with previ-ous finding that a large amount of fatty acid intake af-fected the metabolism of blood lipids, causing higher cholesterol, higher triglyceride, higher low density lipo-protein and lower high density lipolipo-protein [36]. At present, the mechanisms of the correlation between vita-min D and serum lipids are unknown. Vitavita-min D could affect serum lipids through affecting calcium absorption. Previous study has suggested an increased calcium level may reduce formation and secretion of hepatic TG [37] and intestinal absorption of fatty acid. In addition, cal-cium could reduce the status of cholesterol through pro-mote the secretion of bile acids [38]. Other studies have provided that vitamin D levels may have an effect on β -cell function and insulin sensitivity which could affect lipid metabolism [39]. The vitamin D levels of personal may be a marker of cardiovascular health [40], but whether vitamin D supplementation can distinct ameli-orate cardiovascular status is still unknown. Previous meta-analysis assessed the relationships of vitamin D supplements on serum lipids and demonstrated that vitamin D supplementation could affect LDL-C status, but no significant contact with TC and HDL-C were founded [41]. Results from the research of Alexandra et al. showed that vitamin D supplementation were signifi-cantly correlated with serum lipids after adjusting for confounding factors [33]. However, another study showed that the supplementation and treatment with vitamin D were not significantly correlated with plasma adipokine concentrations [21].
The strengths of our study contained the strict sam-pling design and the rigorous research protocols in demographic data collection and laboratory assays. Few research have study the rural population, which accounts for the majority of the Chinese population. Our results can provide a scientific basis for the prevention of dys-lipidemia. Therefore, the samples and results of the study were representative. However, several limitations need to be considered in our study: Firstly, the cross-sectional design assessed a temporal relationship be-tween vitamin D and serum lipids. Secondly, patho-physiological changes of dyslipidemia may affect serum 25(OH) D3 levels or participants with dyslipidemia may modify their life behaviors, containing vitamin D intake. Thirdly, statistical analyses can only adjust for known confounding factors, and can’t adjust for unknown and
unmeasured confounding factors. Fourthly, these partici-pants were only come from one province, which may not well represent the Chinese rural population. Fifth, the number of patients are small and the novelty needs to be further improved. Also, dietary information in our study was collected through 24-h recall, these may be in-exactitude to assess the eating habits of individuals.
Conclusions
In summary, low serum 25(OH) D3 levels were corre-lated with higher prevalence of dyslipidemia in a sample of the rural population in China aged 18–79 years. Serum 25(OH) D3 concentrations were associated with the serum lipids and the associated was different in nor-mal serum lipid group and dyslipidemia group. With the increase of serum 25(OH) D3 levels, the prevalence of dyslipidemia decreased. All of which provide some evi-dence for vitamin D levels as marker in dyslipidemia prediction. These discovery call for a thorough estimate of the benefits and risks associated with vitamin D levels in the China.
Abbreviations
25(OH)D3:25-hydroxyvitamin D3; BMI: Body mass index; CVD.: Cardiovascular disease; HDL-C: HDL cholesterol; LDL-C: LDL cholesterol; TC: Total cholesterol; TG: Triglyceride
Acknowledgements
None.
Funding
This research was supported by the National Nature Science Foundation of China [grants number 8157315, U1204823, and 81,573,243], Science and Technology Foundation for Innovation Talent of Henan Province [grants number 154200510010], and Dietary Nutrition Research and Education Foundation of Danone [grants number DIC2013–06].
Availability of data and materials
The datasets analysed during the current study are not publicly available due the research project has not been completed, but are available from the corresponding author on reasonable request.
Authors’contributions
All of the authors contributed to the design and analysis of this article. SHL designed the research; GHN, WT analyzed the data; GHN wrote the manuscript; all authors read and approved the final manuscript.
Ethics approval and consent to participate
Ethics approval was obtained from the“Zhengzhou University Life Science Ethics Committee”, and written informed consent was obtained for all participants. Ethic approval code: [2015]MEC(S128).
Consent for publication
Not applicable.
Competing interests
The authors declare that they have no competing interests.
Publisher’s Note
Received: 2 October 2017 Accepted: 30 October 2017
References
1. Holick MF. Vitamin d deficiency. N Engl J Med. 2007;357:266–81. 2. Holick MF. Vitamin d: evolutionary, physiological and health perspectives.
Curr Drug Targets. 2011;12:4–18.
3. Delvin E, Souberbielle JC, Viard JP, Salle B. Role of vitamin d in acquired immune and autoimmune diseases. Crit Rev Cl Lab Sci. 2014;51:232–47. 4. Maghbooli Z, Hossein-Nezhad A, Karimi F, Shafaei AR, Larijani B. Correlation
between vitamin d-3 deficiency and insulin resistance in pregnancy. Diabetes-Metab Res. 2008;24:27–32.
5. Salamone LM, Dallal GE, Zantos D, Makrauer F, Dawson-Hughes B. Contributions of vitamin d intake and seasonal sunlight exposure to plasma 25-hydroxyvitamin d concentration in elderly women. Am J Clin Nutr. 1994; 59:80–6.
6. Friedrich M, Rafi L, Mitschele T, Tilgen W, Schmidt W, Reichrath J. Analysis of the vitamin d system in cervical carcinomas, breast cancer and ovarian cancer. Recent results in cancer research Fortschritte der Krebsforschung Progres dans les recherches sur le cancer. 2003;164:239–46.
7. Welsh JE, Wietzke JA, Zinser GM, Byrne B, Smith K, Narvaez CJ. Vitamin d-3 receptor as a target for breast cancer prevention. J Nutr. 2003;133: 2425s–33s.
8. van Schoor NM, Lips P. Worldwide vitamin d status. Best Pract Res Clin Endocrinol Metab. 2011;25:671–80.
9. Mithal A, Wahl DA, Bonjour JP, Burckhardt P, Dawson-Hughes B, Eisman JA, El-Hajj Fuleihan G, Josse RG, Lips P, Morales-Torres J, et al. Global vitamin d status and determinants of hypovitaminosis d. Osteoporosis Int. 2009;20: 1807–20.
10. Holick MF, Chen TC. Vitamin d deficiency: a worldwide problem with health consequences. Am J Clin Nutr. 2008;87:1080s–6s.
11. Pisciotta L, Bertolini S, Pende A. Lipoproteins, stroke and statins. Curr Vasc Pharmacol. 2015;13:202–8.
12. Joint Committee for Developing Chinese guidelines on, P.; Treatment of Dyslipidemia in. A. [chinese guidelines on prevention and treatment of dyslipidemia in adults]. Zhonghua xin xue guan bing za zhi. 2007;35: 390–419.
13. Grant WB, Garland CF. The association of solar ultraviolet b (uvb) with reducing risk of cancer: multifactorial ecologic analysis of geographic variation in age-adjusted cancer mortality rates. Anticancer Res. 2006;26: 2687–99.
14. Faridi KF, Lupton JR, Martin SS, Banach M, Quispe R, Kulkarni K, Jones SR, Michos ED. Vitamin d deficiency and non-lipid biomarkers of cardiovascular risk. Archives of medical science: AMS. 2017;13:732–7.
15. Martins D, Wolf M, Pan D, Zadshir A, Tareen N, Thadhani R, Felsenfeld A, Levine B, Mehrotra R, Norris K. Prevalence of cardiovascular risk factors and the serum levels of 25-hydroxyvitamin d in the united states: data from the third national health and nutrition examination survey. Arch Intern Med. 2007;167:1159–65.
16. Forrest KY, Stuhldreher WL. Prevalence and correlates of vitamin d deficiency in us adults. Nutrition research (New York, NY). 2011;31:48–54. 17. Fraser A, Williams D, Lawlor DA. Associations of serum 25-hydroxyvitamin d,
parathyroid hormone and calcium with cardiovascular risk factors: analysis of 3 nhanes cycles (2001-2006). PLoS One. 2010;5:e13882.
18. Gannage-Yared MH, Chedid R, Khalife S, Azzi E, Zoghbi F, Halaby G. Vitamin d in relation to metabolic risk factors, insulin sensitivity and adiponectin in a young middle-eastern population. Eur J Endocrinol. 2009;160:965–71. 19. Karhapaa P, Pihlajamaki J, Porsti I, Kastarinen M, Mustonen J, Niemela O,
Kuusisto J. Diverse associations of 25-hydroxyvitamin d and 1,25-dihydroxy-vitamin d with dyslipidaemias. J Intern Med. 2010;268:604–10.
20. Liu E, Meigs JB, Pittas AG, McKeown NM, Economos CD, Booth SL, Jacques PF. Plasma 25-hydroxyvitamin d is associated with markers of the insulin resistant phenotype in nondiabetic adults. J Nutr. 2009;139:329–34. 21. Dinca M, Serban MC, Sahebkar A, Mikhailidis DP, Toth PP, Martin SS, Blaha
MJ, Bluher M, Gurban C, Penson P, et al. Does vitamin d supplementation alter plasma adipokines concentrations? A systematic review and meta-analysis of randomized controlled trials. Pharmacol Res. 2016;107:360–71. 22. Heaney RP. Functional indices of vitamin d status and ramifications of
vitamin d deficiency. Am J Clin Nutr. 2004;80:1706S–9S.
23. Holick MF, Binkley NC, Bischoff-Ferrari HA, Gordon CM, Hanley DA, Heaney RP, Murad MH, Weaver CM. Evaluation, treatment, and prevention of
vitamin d deficiency: an endocrine society clinical practice guideline. Journal of Clinical Endocrinology & Metabolism. 2011;96:1911–30. 24. Hossein-nezhad A, Holick MF. Vitamin d for health: a global perspective.
Mayo Clin Proc. 2013;88:720–55.
25. Grundy SM, Becker D, Clark LT, Cooper RS, Denke MA, Howard WJ, Hunninghake DB, Illingworth R, Luepker RV, McBride P, et al. Third report of the national cholesterol education program (ncep) expert panel on detection, evaluation, and treatment of high blood cholesterol in adults (adult treatment panel iii) final report. Circulation. 2002;106:3143–421. 26. Alkerwi A, Sauvageot N, Gilson G, Stranges S. Prevalence and correlates of
vitamin d deficiency and insufficiency in luxembourg adults: evidence from the observation of cardiovascular risk factors (oriscav-lux) study. Nutrients. 2015;7:6780–96.
27. Kienreich K, Tomaschitz A, Verheyen N, Pieber T, Gaksch M, Grubler MR, Pilz S. Vitamin d and cardiovascular disease. Nutrients. 2013;5:3005–21. 28. Liu E, Meigs JB, Pittas AG, Economos CD, McKeown NM, Booth SL, Jacques
PF. Predicted 25-hydroxyvitamin d score and incident type 2 diabetes in the framingham offspring study. Am J Clin Nutr. 2010;91:1627–33.
29. Grimnes G, Emaus N, Joakimsen RM, Figenschau Y, Jenssen T, Njolstad I, Schirmer H, Jorde R. Baseline serum 25-hydroxyvitamin d concentrations in the tromso study 1994-95 and risk of developing type 2 diabetes mellitus during 11 years of follow-up. Diabetic Med. 2010;27:1107–15.
30. Pittas AG, Sun Q, Manson JE, Dawson-Hughes B, Hu FB. Plasma 25-hydroxyvitamin d concentration and risk of incident type 2 diabetes in women. Diabetes Care. 2010;33:2021–3.
31. Jorde R, Figenschau Y, Emaus N, Hutchinson M, Grimnes G. Serum 25-hydroxyvitamin d levels are strongly related to systolic blood pressure but do not predict future hypertension. Hypertension (Dallas, Tex : 1979). 2010;55:792–8.
32. Jorde R, Sneve M, Emaus N, Figenschau Y, Grimnes G. Cross-sectional and longitudinal relation between serum 25-hydroxyvitamin d and body mass index: the tromso study. Eur J Nutr. 2010;49:401–7.
33. Jungert A, Roth HJ, Neuhauser-Berthold M. Associations of serum 25-hydroxycholecalciferol and parathyroid hormone with serum lipids differ by sex and vitamin d status. Public Health Nutr. 2015;18:1684–91.
34. Jorde R, Figenschau Y, Hutchinson M, Emaus N, Grimnes G. High serum 25-hydroxyvitamin d concentrations are associated with a favorable serum lipid profile. Eur J Clin Nutr. 2010;64:1457–64.
35. Melamed ML, Michos ED, Post W, Astor B. 25-hydroxyvitamin d levels and the risk of mortality in the general population. Arch Intern Med. 2008;168:1629–37.
36. Jurgonski A, Juskiewicz J, Zdunczyk ZA. High-fat diet differentially affects the gut metabolism and blood lipids of rats depending on the type of dietary fat and carbohydrate. Nutrients. 2014;6:616–26.
37. Cho HJ, Kang HC, Choi SA, Ju YC, Lee HS, Park HJ. The possible role of ca2+ on the activation of microsomal triglyceride transfer protein in rat hepatocytes. Biol Pharm Bull. 2005;28:1418–23.
38. Vaskonen T, Mervaala E, Sumuvuori V, Seppanen-Laakso T, Karppanen H. Effects of calcium and plant sterols on serum lipids in obese zucker rats on a low-fat diet. Br J Nutr. 2002;87:239–45.
39. Kamycheva E, Jorde R, Figenschau Y, Haug E. Insulin sensitivity in subjects with secondary hyperparathyroidism and the effect of a low serum 25-hydroxyvitamin d level on insulin sensitivity. J Endocrinol Investig. 2007;30:126–32.
40. Ponda MP, Huang X, Odeh MA, Breslow JL, Kaufman HW. Vitamin d may not improve lipid levels: a serial clinical laboratory data study. Circulation. 2012;126:270–7.