32
COMBINED FORECASTS OF INFLATION RATE IN ROMANIA
USING AFTER ALGORITHM
8Mihaela Simionescu, PhD Senior Researcher Romanian Academy
Abstract. The main goal of this paper is to construct some combined predictions for the inflation rate in Romania, by using only the individual forecasts of two experts. The predictions provided during 2004-2014 were used in constructing the new forecasts. Several schemes of combination were employed: equally weighted scheme, a scheme with weights that weights depend on the inverse of averages square forecast errors and the Aggregated Forecast Through Exponential Re-weighting (AFTER) algorithm. The combined predictions based on these schemes improved the degree of accuracy of the forecasts made by the second expert during 2010-2013, but only an empirical combination based on the weights from 2009 improved also the first expert predictions for inflation rate in Romania.
Key-words: forecasts, Aggregated Forecast Through Exponential Re-weighting, inflation rate
JEL Classification: C60, E31
1. Introduction
The importance of combining predictions in order to get more accurate forecasts is well-established in literature, many researches demonstrating the utility of this approach in the last 50 years, especially the works of Granger and his colleagues (Bates and Granger(1969)).
In this paper combined predictions were proposed for the inflation rate in Romania. The individual predictions are the forecasts made by two experts. Several schemes of combination were employed: equally weighted scheme, a scheme with weights that are inversely correlated with mean square error and the Aggregated Forecast Through Exponential Re-weighting algorithm.
After a short literature review, the combination schemes are presented and the new forecasts are provided for inflation rate in Romania during 2010-2014. The ex-post evaluation was made for predictions during 2010-2013. The last section concludes.
2. Literature review
Many articles have shown that the forecasts combination performs better compared to individual predictions, among them being the papers of Timmermann(2006), Altavilla and De Grauwe (2010), Chen and Yang(2007), Clark and McCracken(2009) and Taylor(2010). However, we have to be careful in stating the conclusions, because the ex-post evaluation of
8 This paper has been financially supported within the project entitled “Routes of academic excellence in
33 combined forecasts is not enough. The unstable character of individual forecasts makes us to consider the aspects regarding the selection of the model in a simulated ex-ante approach.
Individual prediction methods based on various approaches bring essential information by including different characteristics of the data and they allow the combination technique to benefit from these important characteristics, as Armstrong (2001) showed. The methods proposed by Bates and Granger(1969) supposed a linear combination of two forecasts, but Granger(1989) considered n predictions using a regression model in constructing the combined prediction. Walz and Walz(1989) proposed a Bayesian approach of combining forecasts by using a multiple regression. Goodwin(2000) made a comparison of combined predictions with two integration techniques.
De Menezes et al.(2000) employed the arithmetic mean, which is still frequently used in literature. The authors studied 3 characteristics of the prediction errors: correlation, variance and skewness. Marques(2006) also used the arithmetic mean and the weighted average based on the inverse of mean square error. Martins(2011) showed that combined forecasts perform better than the least variance. Werner and Ribeiro(2006) and Jorgensen(2007) recommended the use of subjective technique of combination based on intuition and knowledge. Werner(2005) analyzed subjective combined predictions, showing that these predictions depend on forecasting context and particular characteristics of the predictors. The combined techniques used by Shen et al.(2008) are: minimum variance method, simple average and discounted mean square forecast error method.
Romer and Romer(2008) verified if policymakers have useful information in predicting domain by using a regression model:
= + + +
- actual value of the variable - staff prediction
- policymaker prediction
If is statistically different from zero and positive, conditional on staff prediction, the inflation rate is higher when the policymaker prediction is higher. This shows that policymakers add value to the staff anticipations.
Poncella et al. (2011) made a comparison of 4 techniques of combination: dynamic factor models, the most important elements, sliced inverse regression and partial least squares. Hsiao and Wan(2011) made two corrections of the combination based on simple mean, making comparison of models in scenarios. Martins and Werner(2012) identified differences in the predictions accuracy when the errors correlation was considered or not. They compared the individual predictions with the combined ones based on simple mean and minimum variance without and with correlation.
Bjørnland et al. (2012) proposed a system for proving inflation rate predictions in Norway. The weights used in making the forecasts combination are determined from the models’ performance. By using a trimmed weight mean the performance of inflation rate forecasts provided by the Norges Bank was improved.
34
3. Combining experts predictions of inflation rate in Romania
A forecast combination that starts from K alternative predictors ((), ( ), … , ()) of the variable and it is based on the information that is available till (t-1) period is written as:
= ∑ ∙ ()
(1)
The vector denoted by optimizes a certain criterion, the weights being time-varying or constant.
Several researches, like those of Stock and Watson(2004) or Smith and Wallis(2009), concluded that the best solution is the use of an equally weighted average for determining the combining weights. This solution is recommended because of the effect of small sample error. The number of predictors decreases in this case (K’) and the weight is computed as =
. In the traditional approach of Bates and Granger(1969) the weights depend on the inverse of averages square forecast errors. This implies that the models associated with lower forecast errors receive higher weights:
, =
(∑ !, ) ∑" (∑ !, ) (2)
where # − %&'(),(*, = *− * ()
, ,=
, 0 ≤ , ≤ 1 and ∑ , = 1
.
A recent adaptive method (Aggregated Forecast Through Exponential Re-weighting- AFTER) was employed by Yang(2004), where the weights are computed recursively:
, =
./,01.3∙456 (89,0
:;,0)<,0
∑"= ,=./1.3∙456 (89,=
:;,=)<,=
(3)
where (8, = 8− 8(), , =
, 0 ≤ , ≤ 1, ∑ , = 1
and >/8, =
8∑ (*,
8
* which is the estimator of forecast variance.
This algorithm has a modified variant called AFTER-S, that was proposed by Sanchez(2008). He adapted the combination faster to various situations by including a forgetting factor.
The dataset used in this study is represented by the forecasts of inflation rate on the horizon 2004-2014. Taking into account the historical predictions from 2004-2009, new forecasts are made by applying the combining technique for a period that covers the crisis years 2010-2014.
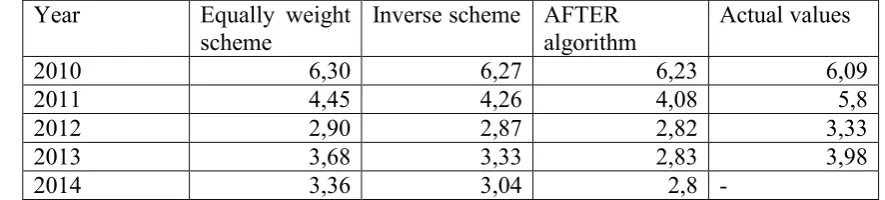
Table 1: Combined forecasts for inflation rate (%) in Romania based on experts anticipations (2010-2014)
Year Equally weight scheme
Inverse scheme AFTER algorithm
Actual values
2010 6,30 6,27 6,23 6,09
2011 4,45 4,26 4,08 5,8
2012 2,90 2,87 2,82 3,33
2013 3,68 3,33 2,83 3,98
2014 3,36 3,04 2,8 -
35 For assessing the ex-post accuracy of the predictions several measures are used: mean error, mean absolute error, root mean square error, U1 and U2 Theil’s coefficients.
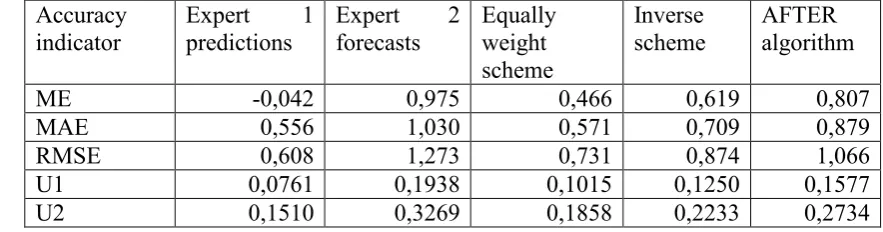
Table 2: Accuracy of individual and combined forecasts for inflation rate (%) in Romania (2010-2013)
Accuracy indicator
Expert 1 predictions
Expert 2 forecasts
Equally weight scheme
Inverse scheme
AFTER algorithm
ME -0,042 0,975 0,466 0,619 0,807
MAE 0,556 1,030 0,571 0,709 0,879
RMSE 0,608 1,273 0,731 0,874 1,066
U1 0,0761 0,1938 0,1015 0,1250 0,1577
U2 0,1510 0,3269 0,1858 0,2233 0,2734
Source: own computations
All the proposed combined forecasts outperformed the second expert forecasts on the horizon 2010-2013, according to the values of ME, MAE and RMSE. The combined predictions and of the second forecaster ones are underestimated, while those proposed by the first expert are overestimated. Equally weighted scheme performed better than all the other forecasting methods. However, all the combined predictions outperformed the naïve ones, according to the values of U2 that are less than 1. U1 values are under 0.25 indicating a reasonable degree of accuracy.
As we can see the first expert predicted better the inflation rate in Romania. Therefore, a higher weight is given to these predictions. Therefore, new weights are computed by taking into consideration the linear combination from 2009, the previous year before the forecasts origin.
??@ = , ??@+ (1 − ) , ??@ (4) X1- prediction of the first expert
X2- prediction of the second expert
Table 3: Combined predictions based on the weights from 2009
Year Weights from 2009
Actual values
2010 6,40 6,09
2011 5,09 5,8
2012 3,00 3,33
2013 4,85 3,98
2014 6,40 -
Source: own computations
Table 4: Accuracy of combined forecasts for inflation rate (%) in Romania based on weights from 2009 (2010-2013)
Accuracy indicator
Expert 1 predictions
Expert 2 forecasts
Scheme based on weights from 2009
ME -0,042 0,975 -0,033
36
RMSE 0,608 1,273 0,603
Source: own computations
According to accuracy indicators, a small improvement was brought to predictions based on first expert by keeping the weights from 2009, the year when the economic crisis started in Romania. The prognoses remain overestimated, due to the high weight given to forecasts based first expert in the combination.
4. Conclusions
In this paper some combined forecasts were proposed for the inflation rate in Romania. Several schemes of combination were employed: equally weighted scheme, a scheme with weights that are inversely correlated with mean square error and the Aggregated Forecast Through Exponential Re-weighting algorithm.
The combined predictions based on these schemes improved the degree of accuracy of the anticipations of second expert during 2010-2013, but only our empirical combination based on the weights from 2009 improved also the first expert predictions. A future research could include other combination techniques.
5. References
[1]Altavilla, C., & De Grauwe, P. (2010). Forecasting and combining competing models of exchange rate determination. Applied Economics, 42(27), 3455-3480.
[2]Armstrong, J. S. (Ed.). (2001). Principles of forecasting: a handbook for researchers and practitioners (Vol. 30). Springer.
[3]Bates, J. M., & Granger, C. W. (1969). The combination of forecasts. Or, 451-468.
[4]Bjørnland, H. C., Gerdrup, K., Jore, A. S., Smith, C., & Thorsrud, L. A. (2012). Does Forecast Combination Improve Norges Bank Inflation Forecasts?*. Oxford Bulletin of Economics and Statistics, 74(2), 163-179.
[5]Bordignon, S., Bunn, D. W., Lisi, F., & Nan, F. (2013). Combining day-ahead forecasts for British electricity prices. Energy Economics, 35, 88-103.
[6]Chen, Z. and Yang, Y.(2007), Time series models for forecasting: testing or combining? Stud. Nonlinear Dyn. E. 11(1), article 3.
[7]Clark, T. E., & McCracken, M. W. (2009). IMPROVING FORECAST ACCURACY BY COMBINING RECURSIVE AND ROLLING FORECASTS*. International Economic Review, 50(2), 363-395.
[8]De Menezes, L. M., W Bunn, D., & Taylor, J. W. (2000). Review of guidelines for the use of combined forecasts. European Journal of Operational Research, 120(1), 190-204.
[9]Goodwin, P. (2000). Correct or combine? Mechanically integrating judgmental forecasts with statistical methods. International Journal of Forecasting, 16(2), 261-275.
[10]Granger, C. W. (1989). Invited review combining forecasts—twenty years later. Journal of Forecasting, 8(3), 167-173.
[11]Hsiao, C., Wan, S.K. (2011), Comparison of forecasting methods with an application to predicting excess equity premium, Mathematics and Computers Simulation, n.81, 1235-1246. [12]Jørgensen, M. (2007). Forecasting of software development work effort: Evidence on expert judgement and formal models. International Journal of Forecasting, 23(3), 449-462. [13]Martins, V.L.M. (2011), Comparacao de combinacao de previsoes correlacionadas e nao correlacionadas com as suas previsoes individuais: um estudo com series industriais. Dissertation (Master in Prodution Engineering). Porto Alegre: PPGEP/UFRGS.
37 [15]Poncela, P., Rodríguez, J., Sánchez-Mangas, R., & Senra, E. (2011). Forecast combination through dimension reduction techniques. International Journal of Forecasting, 27(2), 224-237.
[16]Romer, C. D., & Romer, D. H. (2008). The FOMC versus the staff: where can monetary policymakers add value? (No. w13751). National Bureau of Economic Research.
[17]Sánchez, I. (2008). Adaptive combination of forecasts with application to wind energy. International Journal of Forecasting, 24(4), 679-693.
[18]Smith, J., & Wallis, K. F. (2009). A simple explanation of the forecast combination puzzle*. Oxford Bulletin of Economics and Statistics, 71(3), 331-355.
[19]Stock, J. H., & Watson, M. W. (2004). Combination forecasts of output growth in a seven‐country data set. Journal of Forecasting, 23(6), 405-430.
[20]Taylor, J.W. (2010), Triple seasonal methods for short-term electricity demand forecasting, European Journal of Operational Research, 204, 139-152.
[21]Walz, D.B., Walz, D.P. (1989), Combining forecasts: multiple regression versus a Bayesian approach, Decision Sciences, 20, 77-89.
[22]Werner, L. (2005), Um modelo composto para realizar previsao de demanda atraves de integracao da combinacao de previsoes e do ajuste baseado na opiniao, PhD thesis, Porto Alegre, UFRGS.
[23]Werner, L., Ribeiro, J.L.D. (2006), Modelo compost para prever demanda atraves da integracao de previsoes, Producao, Sao Paula, no. 16, 493-509.