Identifying Key Features of Student Performance
in Educational Video Games and Simulations
through Cluster Analysis
DEIRDRE KERR AND GREGORY K.W.K. CHUNG
National Center for Research on Evaluation, Standards, and Student Testing University of California, Los Angeles
_______________________________________________________________________
The assessment cycle of evidence-centered design (ECD) provides a framework for
treating an educational video game or simulation as an assessment. One of the main steps in the assessment cycle of ECD is the identification of the key features of student performance. While this process is relatively simple for multiple choice tests, when applied to log data from educational video games or simulations it becomes one of the most serious bottlenecks facing researchers interested in implementing ECD. In this paper we examine the utility of cluster analysis as a method of identifying key features of student performance in log data stemming from educational video games or simulations. In our study, cluster analysis was able to consistently identify key features of student performance in the form of solution strategies and error patterns across levels, which contained few extraneous actions and explained a sufficient amount of the data.
Keywords: Evidence-centered design, cluster analysis, fuzzy cluster analysis, feature cluster analysis, log data, educational video games, key features of student performance, student strategies.
_______________________________________________________________________ Authors’ addresses: National Center for Research on Evaluation, Standards, and Student Testing, University of California, Los Angeles, Los Angeles, CA, 90095, [email protected] and [email protected].
1. INTRODUCTION
The assessment cycle of evidence-centered design (ECD) [Mislevy et al. this issue; Mislevy et al. 2006] provides a framework for treating an educational video game or simulation as an assessment. It is particularly suitable for the development of performance-based assessments, including educational video games and simulations, where it is difficult to determine the exact test specifications of the assessment [Rupp et al. 2010]. One of the main components of the assessment cycle of ECD is the identification, extraction, and accumulation of the key features of student performance that can be used as evidence to indicate different levels of proficiency.
In educational video games and simulations, the key features of student performance must be extracted from log data consisting of individual actions taken by the student while playing the game. However, log files contain prohibitively large quantities of data [Romero et al. 2009], making interpretation of the complex data that result one of the most serious bottlenecks facing researchers interested in implementing ECD in educational video games and simulations [Mislevy et al. 2004].
In this study we seek to determine the usability of cluster analysis as a method of identifying key features of student performance as captured in log data from an educational video game.
1.1 The Assessment Cycle of ECD
The ECD framework can be viewed as a two-tiered structure that has a conceptual tier and an implementation tier. The conceptual tier consists of specifications for assessment design, implementation, and delivery as represented through the processes of domain modeling, domain analysis, and the conceptual assessment framework (CAF), as w ell as the assembly model and presentation
model. The second tier consists of the actual computational processes involved in putting these conceptual models into practice, which is known as the four-process cycle [Mislevy et al. this issue].
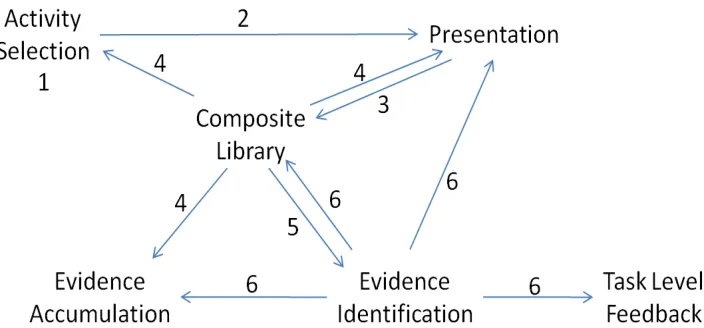
of the CAF and four-process cycle for ECD as described in Mislevy et al. [this issue]. We have abstractly represented the flow of activities through this cycle diagrammatically in Figure 1, which shows this cycle consisting of six principal steps.
Fig. 1. The principal processes in the assessment cycle for ECD, with relevant steps labeled (adapted from Fig. 3 in Mislevy et al. [this issue]).
Step 1 is activity selection where we select and specify the activities students will be engaged in during our game by generating a l ist of knowledge specifications related to the content we wish to address. Step 2 is presentation where we use the knowledge specifications generated during activity selection to drive the selection of relevant game mechanics, visuals, and/or storyline so that game behavior addresses the identified concepts or constructs [Chung et al. 2010]. In Step 3, we generate a comprehensive logging system to capture the game mechanics and other relevant presentation components so that an accurate log of each student’s in-game actions can be stored in the composite library [Chung and Kerr 2012].
Step 5 is evidence identification for evidence not identified a priori. Evidence identification is critical in log data stemming from educational video games and simulations to make the problem computationally tractable [Masip et al. 2011]. If evidence identification is successful and key features of student performance can be extracted from log files created during game play, in Step 6 the results of the evidence identification process can be stored in the composite library and combined across multiple subjects and trials to modify the presentation of the game [Kerr and Chung 2012] and/or provide task-level feedback targeted to a particular student’s game play and knowledge state.
1.2 Challenges in Identifying Key Features of Student Performance
While the evidence identification process is relatively simple for tests in a multiple choice format, this process becomes incredibly complex in an educational video game or simulation due to the sheer number of observable variables and the variety of potential relationships each observable variable has on student performance [Frezzo et al. 2009]. Since the observable variables in this instance are specific actions (e.g., “[the student] toggled a fraction from 1/2 to 2/4,” rather than complete student answers, the relationship between each observed variable and overall student performance is not immediately clear. The interpretation of “[the student] toggled a fraction from 1/2 to 2/4” often depends on what else the student does while attempting to solve the problem, whereas that is not the case with a standard test wherein student data consist of the answers given rather than the steps taken in determining the answer.
Most notably, log files represent prohibitively large quantities of data [Romero at al. 2009], making their interpretation one of the most serious bottlenecks facing researchers interested in implementing ECD in educational video games and simulations [Mislevy et al. 2004]. For instance, approximately 135 subjects playing a simple puzzle game for about half an hour can easily generate over 400,000 rows of log data [Chung et al. 2010].
On top of the amount of data provided, the specific information gained from these log files is not always easy to interpret [Romero and Ventura 2007] as the responses of individual students are highly context dependent in educational games and simulations [Rupp et al. 2010] and it can be very difficult to picture how student knowledge, learning, or misconceptions manifest themselves at the level of a specific action taken by the student in the course of the game. Additionally, it can be very difficult to determine which actions represent key features of student performance given that log files are generally designed to capture all student actions relevant to game play, and it is not until after analysis that one would know which of those actions were relevant to learning.
1.3 Objectives of the Paper
In this study we sought to determine the utility of using cluster analysis on log data stored in the composite library to identify key features of student performance in the evidence identification and evidence accumulation processes in Steps 4-6 of Figure 1. The utility of cluster analysis as a method of extracting key features of student performance from log data will be examined through four guiding questions:
1. Can cluster analysis identify key features of student performance?
2. Does cluster analysis identify similar key features of student performance in similar situations?
3. Do the actions identified by cluster analysis as belonging to a given key feature actually belong to that feature?
In the remainder of this paper we first present an overview of the design of this study. We then discuss our methodology for activity selection, presentation design, composite library structure, evidence identification, and evidence accumulation. In the results section, we first discuss the identification of key features of student performance using fuzzy feature cluster analysis, including a level example and a comparison of results from fuzzy clustering and hard clustering. We t hen discuss the identification of similar strategies in similar situations, the accuracy of the identified actions, and the amount of explained data. We conclude with a discussion of the contributions of the combination of the ECD framework and cluster analysis to the evidence identification process as well as the limitations of these findings and potential of this pairing.
2. STUDY DESIGN
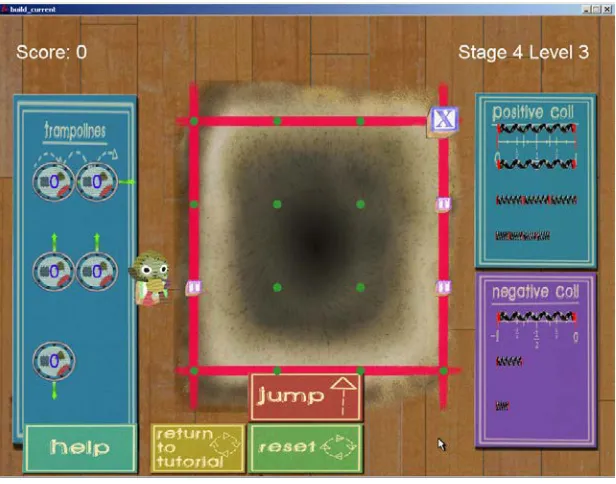
This study examines the log files generated by an educational video game called Save Patch [Chung et al. 2010] designed by the Center for Research on
Evaluation, Standards, and Student Testing (CRESST) at the University of California, Los Angeles, and the Game Innovation Lab at the University of Southern California. In this game, students are required to apply concepts underlying rational number addition to help the game character Patch bounce over obstacles to reach his home.
Fig. 2. Screen shot of Save Patch.
The sample of students who played Save Patch in this study included 155 students (76 males and 79 females) from an urban school district in southern California. These students ranged from sixth to eighth grade and were in sixth grade math, Algebra Readiness, or Algebra 1 courses. The game was designed to address concepts in sixth grade math, but initial studies such as this one drew from a wider range of student populations. All students played the game for approximately 40 m inutes, and each action the students took in the game was logged automatically.
3. METHODS
logged in the composite library and how it is logged. Finally, we discuss how cluster analysis, as a particular data mining technique, is applied to the data stored in the composite library for the purposes of evidence identification and evidence accumulation.
3.1 Activity Selection
The task models that served as a basis for the development of game activities that we used during activity selection for Save Patch were guided by current theories regarding the central importance of Algebra in STEM (Science, Technology, Engineering, and Math) courses and careers [Malcom at al. 2004] and the findings by the National Mathematics Advisory Panel that fluency with fractions is one of the critical foundations of Algebra [NMAP 2008].
Due to the central importance of fluency with fractions, we chose to design a game that addressed what we considered to be the most important concepts underlying the addition of fractions. The concepts identified by our content experts as being key to fluency with fractions were:
1. that all fractions are defined in relation to a whole unit,
2. fractions can be summed only if their denominators are identical,
3. the denominator of a fraction represents the number of identical parts in one whole unit, and
4. the numerator of a fraction represents the number of identical parts that have been combined.
Table I. Knowledge Specifications for Save Patch
1.0 Does the student understand the meaning and importance of the whole unit? 1.1 The size of a rational number is relative to how the whole unit is defined. 1.2 In mathematics, a whole unit is understood to be of some quantity. 1.3 The whole unit can be represented as an interval on the number line. 2.0 Does the student understand the meaning of addition as applied to fractions?
2.1 To add quantities, the units or parts of units must be identical. 2.2 Identical units can be added to create a single numerical sum. 2.3 Dissimilar quantities cannot be represented as a single sum.
3.0 Does the student understand the meaning of the denominator in a fraction? 3.1 The denominator of a fraction represents the number of identical parts in one
whole unit.
3.2 As the denominator gets larger, the size of each fractional part gets smaller. 3.3 As the size of each fractional part gets smaller, the number of pieces in the
whole gets larger.
4.0 Does the student understand the meaning of the numerator in a fraction?
4.1 The numerator of a fraction represents the number of identical parts that have been combined.
4.2 If the numerator is smaller than the denominator, the fraction represents a number less than one whole unit.
4.3 If the numerator is equal to the denominator, the fraction represents one whole unit.
4.4 If the numerator is smaller than the denominator, the fraction represents more than one whole unit.
3.2 Presentation
The knowledge specifications developed during the task model specification and activity selection were the driving force behind later game design decisions. For instance, we chose to represent the game area as a grid to reinforce the idea that a unit can be represented as one whole interval on a number line (knowledge specification 1.3) as exemplified by the red lines in Figure 2 or, perhaps more clearly, in Figure 7.
the students to make the addition and having the game calculate the resulting distance. This means that the game does not allow students to add 1/2 to 1/3, and instead forces them to scroll the 1/2 coil to 3/6 and the 1/3 coil to 2/6 if they are to be added together. For the same reason, the game does not allow the creation of mixed numbers (e.g., 1 1/2), but instead forces players to convert the whole number portion of the mixed number to the appropriate fractional representation (e.g., 2/2) before adding the fractional portion of the mixed number, resulting in a value of 3/2.
Successful game play was intended to require students to determine the size of the whole unit for a given grid as well as the size of the fractional pieces making up the unit. The distance the character moved was a function of how many coils were added to each trampoline, where one whole coil represented one whole unit on the grid and each whole coil could be easily broken into fractional pieces of the desired size by clicking on the coil and scrolling with the mouse wheel. Therefore, a successful solution to a given level should indicate a solid understanding of the knowledge specifications underlying the game Presentation.
Table II. Stage Design for Save Patch
Stage Description Knowledge Specifications
1 tutorial none: teaches basic game mechanics
2 determine numerator 4.0 Does the student understand the meaning of the numerator in a fraction
3 determine denominator 3.0 Does the student understand the meaning of the denominator in a fraction
4 introduce 2D grid none: teaches advanced game mechanics
5 create equivalent fractions 3.2 As the denominator gets larger, the size of each fractional part gets smaller
6 add unlike denominators 2.0 Does the student understand the meaning of addition as applied to fractions
coil on each trampoline. The second stage had two levels and required students to determine the numerator that was being represented. Students were given whole unit coils and coils of the correct denominator. The third stage had three levels and required students to determine the denominator that was being represented as well as the numerator. Students were given whole unit coils and coils with a variety of denominators. The fourth stage had five levels and required students to determine the denominator and numerator represented in a two-dimensional grid, rather than the number line representation used up to this point. The fifth stage had three levels and required students to convert larger fractions into smaller fractions (e.g., breaking 1/2 coils into 2/4 coils). The sixth stage had four levels and required the students to add unlike denominators.
Additionally, a few of the levels in each stage were designed to represent more than one unit in order to enable diagnosis of students’ understanding of the unit. The game was also designed as a research testbed, with a level editor rather than hardcoded levels, so that findings from the evidence identification or evidence accumulation phases could be quickly and easily integrated into the presentation of the game.
3.3 Composite Library and Evidence Identification
In order to record student actions reflecting understanding of the knowledge specifications, the data generated by students while playing the game was stored in the composite library in the form of a structured log written to a tab delimited text file. While unstructured logging often captures every mouse click, we chose to capture only mouse clicks that represented deliberate student actions, such as clicking on a coil, dragging a trampoline to a position on the grid, or clicking on the “Reset” button, and to ignore mouse clicks or drags that did not result in an action in the game (e.g., mouse clicks on the game background).
without relevant game context information. For this reason, each click that resulted in an action was logged in a row in the log file that included valuable context information such as student ID number and time at which the action occurred, as well as specific information about the action itself.
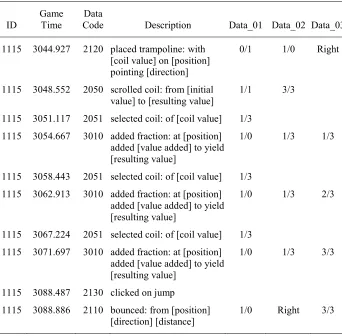
Additional structure was added by assigning codes to each of the different types of actions that could occur in the game, such as selecting a coil (code 2051) or adding a coil to a trampoline (code 3010). Codes 1000-1999 were used for general game information, such as game version or study condition; 2000-2999 were used for basic manipulation of objects, such as toggling a fraction to a new denominator; 3000-3999 were used for in-game mathematical decisions, such as adding a fraction to a trampoline; 4000-4999 were used for success or failure states such as player deaths; 5000-5999 were used for in-game navigation such as returning to the main menu or advancing to the next level; and 6000-6999 were used for the help menu system.
Using data codes allowed for the easy grouping of similar actions, which was important because we knew that analysis of the game data would be difficult without such categorization, since there was no e xisting theory to determine which actions indicated student understanding and which did not. Grouping specific actions such as the addition of a 1/2 coil to the first trampoline on the grid or the addition of a 1/8 coil on the third trampoline on the grid into a more general group (e.g., “adding fractions”), made both evidence identification and evidence accumulation easier. For instance, the number of times a player reset a level could be determined by simply adding up all code 4010’s appearing in the data log for that level, without having to determine post hoc which actions fell into this category. Additionally, if an entire category of actions (e.g., “scrolling coils to a different denominator”) proved to add little or nothing to the analysis, the whole category of actions could be easily ignored in later analyses.
These log files had to be transformed to a more compact structure before they could be used in cluster analysis or other data mining techniques. First the data for each level had to be extracted to create a series of data sets that consisted of all students’ log files for each level. This was necessary because the same action might have different meanings in different levels.
Then the data had to be transformed from its original form into a matrix wherein one dimension consisted of the actions to be clustered and the other consisted of the entities they would be clustered across (e.g., a row for each student and a column for each action) so that the results would indicate that a certain set of actions occurred for some entities and a d ifferent set of actions occurred for other entities.
Table III. Hypothetical Log File of a Student Adding 3/3
ID Game Time Code Data Description Data_01 Data_02 Data_03
1115 3044.927 2120 placed trampoline: with [coil value] on [position] pointing [direction]
0/1 1/0 Right
1115 3048.552 2050 scrolled coil: from [initial
value] to [resulting value] 1/1 3/3 1115 3051.117 2051 selected coil: of [coil value] 1/3
1115 3054.667 3010 added fraction: at [position] added [value added] to yield [resulting value]
1/0 1/3 1/3
1115 3058.443 2051 selected coil: of [coil value] 1/3 1115 3062.913 3010 added fraction: at [position]
added [value added] to yield [resulting value]
1/0 1/3 2/3
1115 3067.224 2051 selected coil: of [coil value] 1/3 1115 3071.697 3010 added fraction: at [position]
added [value added] to yield [resulting value]
1/0 1/3 3/3
1115 3088.487 2130 clicked on jump
1115 3088.886 2110 bounced: from [position]
Rather than use students as entities in our analysis, we chose to use attempts as entities since a given student could try a g iven level multiple times before reaching a solution. Attempts were defined as t he set of actions beginning immediately after either a new level load or a level reset and ending at either a level reset or a l evel completion. This decision was made because we were hoping to extract strategies from the cluster analysis and it seemed likely that a student would change their strategy in subsequent attempts if their first attempt was not successful. Therefore it was possible, and actually quite common, for a given student to be associated with multiple rows in a given level’s data set.
The transformation of data from the composite library into a form usable for data mining consisted of two main steps. First, shortened versions of the actions needed to be calculated from the log files and all symbols needed to be replaced
with letters so that each unique action could be used as the name of a column (e.g. ACRT_POS1.0_COIL1.3_YIELD2.3 indicating an addition to the
trampoline at position 1.0 of a 1/3 coil which resulted in a value of 2/3 on the trampoline) when the data are converted from one row per action to one row per attempt. To reduce noise, columns corresponding to actions occurring less often than a given threshold could be deleted from the resulting data set. In this study, we dropped any actions not made in at least five attempts at a given level (not necessarily across five different students) since initial examinations indicated that the cluster analysis algorithm being used was unable to group highly infrequent actions. While the algorithm had difficulty grouping actions made in only five to 10 attempts, these were retained in the analysis due to the small sample size and the fear that removing those actions would result in the failure to identify groupings that would be easily identified with a larger sample.
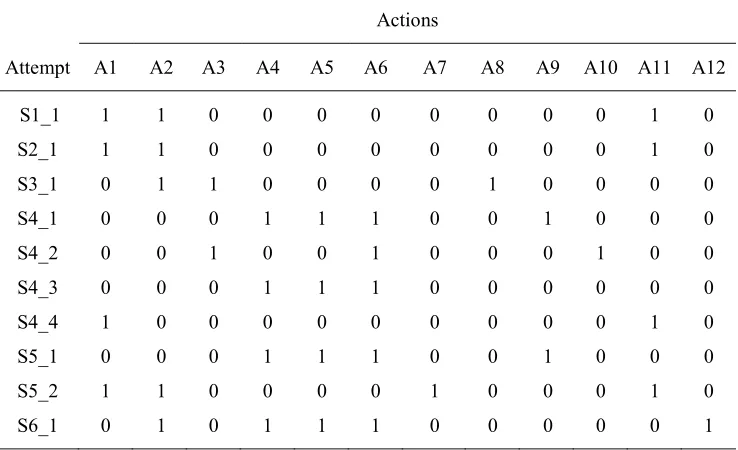
For the level in Table IV, this would indicate that the first student (S1), the second student (S2), the third student (S3), and the sixth student (S6) each had one attempt at the level, the fifth student (S5) had two attempts at the level, and the fourth student (S4) had four attempts at the level. The fourth student’s first attempt at the level (S4_1) consisted of action 4 (A4), action 5 (A5), action 6 (A6), and action 9 (A9), which they changed in their second attempt (S4_2) to action 3 (A3), action 6 (A6), and action 10 (A10). The third attempt (S4_3) was nearly identical to the first attempt, but in the last attempt (S4_4) the student changed actions completely to action 1 (A1) and action 11 (A11).
Table IV. Hypothetical Example of a Sparse Binary Matrix used in Cluster Analysis
Actions
Attempt A1 A2 A3 A4 A5 A6 A7 A8 A9 A10 A11 A12
S1_1 1 1 0 0 0 0 0 0 0 0 1 0
S2_1 1 1 0 0 0 0 0 0 0 0 1 0
S3_1 0 1 1 0 0 0 0 1 0 0 0 0
S4_1 0 0 0 1 1 1 0 0 1 0 0 0
S4_2 0 0 1 0 0 1 0 0 0 1 0 0
S4_3 0 0 0 1 1 1 0 0 0 0 0 0
S4_4 1 0 0 0 0 0 0 0 0 0 1 0
S5_1 0 0 0 1 1 1 0 0 1 0 0 0
S5_2 1 1 0 0 0 0 1 0 0 0 1 0
S6_1 0 1 0 1 1 1 0 0 0 0 0 1
Notes. In the Attempt column S1 through S6 indicate 6 hypothetical students and the
numbers _1 through _4 indicate the attempt number for each hypothetical student. In the Actions columns A1 through A12 indicate 12 different actions students could make on this level. The values in the Actions column indicate whether or not the action was made by that student in that attempt.
3.4 Evidence Accumulation
In this study, we tested the utility of fuzzy feature cluster analysis [Ruspini 1969] as a method of extracting key features of student performance from re-structured log data after initial evidence identification for the purpose of evidence accumulation. Cluster analysis is a density estimation technique for identifying patterns within user actions reflecting differences in underlying attitudes, thought processes, or behaviors [Berkhin 2006; Romero et al. 2009] through the analysis of either general correlations or sequential correlations [Bonchi et al. 2001].
It is particularly appropriate for the analysis of log data, seeing as clustering is driven solely by the available data and is therefore ideal in instances in which little prior information is known [Jain et al. 1999]. Cluster analysis can be used to identify the latent dimensionality of a data set [Roussos et al. 1998] and compress the data set into a manageable number of variables that are nontrivial, implicit, previously unknown, and potentially useful [Frawley et al. 1992; Hand et al. 2001; Vogt and Nagel 1992]. It has been used regularly in such fields as engineering, chemistry, physics, astronomy, law enforcement, and publishing to identify key data in large data sets [Frawley et al. 1992].
Cluster analysis partitions entities into groups on the basis of a matrix of inter-object similarities [James and McCulloch 1990]. Approaches such as Ward’s method within a hierarchical clustering scheme, or K-means cluster analysis as a non-hierarchical method, accomplish this by minimizing within-group distances compared to between-group distances so that entities classified as being in the same group are more similar to each other than they are to actions in other groups [Huang 1998; Rupp in press; Steinley 2006].
While standard clustering techniques are generally used for subgroup discovery, feature clustering must be used when the entities that are being clustered are actions rather than people. Feature clustering differs from standard clustering techniques only in that it groups descriptive features of entities (e.g., actions made by students) rather than grouping similarities that produce these features (e.g., students). Standard clustering algorithms can be used for feature clustering by transposing the matrix being operated on, pr ovided that the similarity between features can be interpreted [Krier et al. 2007].
In our analyses, two features/actions were considered to be similar by the cluster analysis if they were both performed by the same students (e.g., in the level in Table IV, A1 and A2 were similar because most rows with a 1 in A1 also had a 1 in A2). Features/actions were considered to be different from each other if some students performed one of the actions and different students performed the other action (e.g., in the level in Table IV, A3 and A11 were different from each other because every row with a 1 in A3 had a 0 in A11, and vice versa).
3.5 Identifying Key Features of Student Performance
We used the “fanny” algorithm in R to run our analysis for fuzzy clustering and the “agnes” algorithm to run our analyses for hard clustering [R Development Core Team 2010]. We used the Manhattan distance, rather than the Euclidean or Squared Euclidean distances as our distance metric, because our data were binary indicating whether or not a particular student had performed a particular action in a given attempt on a given level. The analyses were run individually for each level because the same action could have two different meanings in two different levels (e.g., adding a fourth in a level where the denominator is fourths is different than adding a fourth in a level where the denominator is thirds); see Appendix A for the R code used in the analysis.
incorrect actions began to appear in the ‘standard solution’ cluster or the additional clusters provided no additional interpretive value (e.g., the additional clusters simply split an easily identifiable strategy into parts).
The results of the feature cluster analyses are lists of the actions that make up each cluster in each level. However, these lists do not indicate which students made which actions. In order to determine which cluster each attempt by each student falls in, the clusters must be named and calculations must be performed to determine which students are making which actions.
For instance, in a level that requires a student to add one whole to the first trampoline and 2/3 to the second trampoline to correctly solve the level, the three
actions ACRT_POS1.0_COIL1.1_YIELD1.1,
ACRT_POS1.3_COIL1.3_YIELD1.3, and ACRT_POS1.3_COIL1.3_YIELD2.3 would be the standard solution for this level because these actions would result in Patch arriving safely at the end of the level. Consequently, we decided to code any attempt wherein a student made those three actions—and not subsequent
actions such as ACRT_POS1.0_COIL1.1_YIELD2.1 or
ACRT_POS1.3_COIL1.3_YIELD3.3—as being a “standard solution.”
Clusters resulting in an error are more difficult to name than clusters resulting in a solution, as the name depends on the intent rather than the result. For
instance, if ACRT_POS1.0_COIL1.2_YIELD1.2,
ACRT_POS1.0_COIL1.2_YIELD2.2, and ACRT_POS1.0_COIL1.2_YIELD3.2 were identified as forming a cl uster in a level which asked for 3/3 we would name that cluster a “partitioning error” as those actions are consistent with a partitioning error (explained further in the next section) resulting in the belief that the level represents halves, rather than thirds. Finally, we coded any attempts that did not match any of the identified action groups as “unexplained error.”
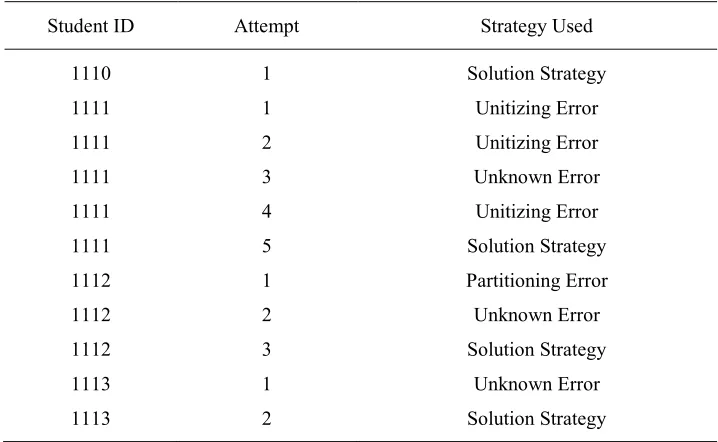
As shown in Table V, this process resulted in a single nominal variable at the level of each attempt for each student that indicated which cluster it belonged to (i.e., which solution strategy was used).
for each level as w ell as errors involving the addition of fractions and identification of the unit. Our content experts anticipated, in particular, errors involving knowledge specifications 2.1 and 2.3 regarding the addition of unlike denominators as well as errors involving knowledge specification 1.0 regarding the meaning and importance of a whole unit.
Table V. Cluster Assignment for Each Attempt by Each Student
Student ID Attempt Strategy Used
1110 1 Solution Strategy
1111 1 Unitizing Error
1111 2 Unitizing Error
1111 3 Unknown Error
1111 4 Unitizing Error
1111 5 Solution Strategy
1112 1 Partitioning Error
1112 2 Unknown Error
1112 3 Solution Strategy
1113 1 Unknown Error
1113 2 Solution Strategy
4. RESULTS
To address the utility of cluster analysis for evidence accumulation, we present the following four sets of results addressing our four research questions: (1) the kinds of strategies that were identified by the cluster analysis, including the results from Stage 4 – Level 2 as an example of the output for a given level as well as a co mparison of fuzzy clustering and hard clustering results, (2) the ability of cluster analysis to identify similar strategies in similar situations, (3) the accuracy of the identified actions, and (4) the amount of data explained by the strategies identified by the cluster analysis.
4.1 Strategies Identified by Cluster Analysis
needed to solve the level under the standard solution and a second cluster containing all other ineffective or inefficient actions made by students while attempting to solve the level. Additional clusters generally split the “other actions” cluster into smaller groups of actions representing specific error patterns. Regardless of the number of clusters in the final cluster analysis for the level, one cluster always remained containing the actions not identifiable as belonging to a specific strategy. That cluster was deemed to be the “unexplained error” strategy and upon visual examination of the log files appeared to be made up largely of seemingly random guesses or students employing a sy stematic guess-and-check strategy.
The cluster analysis also successfully identified errors involving knowledge specification 1.0 regarding the meaning and importance of a whole unit. Students who made a “unitizing error” were unable to correctly identify the size of the unit they were working with. Despite repeated instruction, those students did not recognize the red lines as denoting unit size. Instead, they assumed that the entire grid was one unit across, regardless of how many red lines they saw. As illustrated in Figure 3, this misconception led students to attempt to solve the level using an incorrect denominator. In Stage 5 – Level 1, t hat resulted in students placing 3/3 on the trampoline, rather than 3/2. This strategy accounted for 22% of all identified errors in the game.
Fig. 3. Stage 5 – Level 1 of Save Patch, showing a screen shot of the level and an illustration of the fractional amounts placed on each trampoline for each of the clusters identified by fuzzy clustering.
Instead, the cluster analysis identified an error indicating that students were not able to identify the fractional representation correctly. We had not anticipated this being a major error in our game as we believed students in sixth through eighth grade would have more trouble with knowledge specification 2.0 regarding the addition of fractions than knowledge specification 3.0 regarding the meaning of the denominator in a fraction or knowledge specification 4.0 regarding the meaning of the numerator in a fraction, which were largely included as necessary prerequisites to our targeted concepts. However, “partitioning errors” wherein students did not correctly identify the denominator represented in the level accounted for 47% of all errors made in the game.
rather than placing 2/3 on the first trampoline, 2/3 on the second trampoline, and 1/3 on the third trampoline.
Additionally, cluster analysis indicated that students engaged in a number of strategies involving misconceptions or misapplications of game mechanics. We had anticipated that students with little or no g aming experience might make errors such as misusing resources, e.g., students placing 3/3 on the first trampoline in Stage 3 – Level 3 (see Figure 7) and then not having enough 1/3 coils left to complete the level. However, the “misuse of resources” strategy accounted for only 6% of the identified errors in the game.
Fig. 4. Stage 5 – Level 2 of Save Patch, showing a screen shot of the level and an illustration of the fractional amounts placed on each trampoline for each of the clusters identified by fuzzy clustering.
on the third trampoline. The fact that this strategy would have led to a successful solution in a few early levels probably reinforced this behavior.
In summary, the cluster analysis identified three mathematical misconceptions that indicate lack of understanding of specific knowledge specifications and two game misconceptions that are unrelated to the mathematical concepts being addressed in the game (see Table VI). “Partitioning errors” indicate a l ack of understanding of the denominator of a fraction, “unitizing errors” indicate a lack of understanding of the meaning of a unit, and “adding errors” indicate a lack of understanding of the addition of fractions.
Table VI. Common Incorrect Strategies
Strategy Misconception Related Knowledge Specification
partitioning
error the denominator is determined by counting dividing marks 3.1 The denominator in a fraction represents the number of identical parts in one whole unit.
unitizing error the entire representation is
always one unit across 1.3 The whole unit can be represented as an interval on the number line.
adding error a fraction can be added to a whole unit without having the same denominator
2.1 To add quantities, the units or parts of units must be identical
everything in
order the order in which resources are given corresponds to the solution to the level
none: provides no information about student level of
mathematical understanding
misusing
resources enough resources have been provided to solve the level without conservation
none: game error only, does not indicate a mathematical misunderstanding
However, the use of the “everything in order” or “misuse of resources” strategy tells us very little about the student understanding of fractions and, instead, indicates that the student is either gaming the system (the “everything in order” strategy) or having difficulty with the strategic aspect of the problem rather than the conceptual aspect of the problem (the “misuse of resources” strategy).
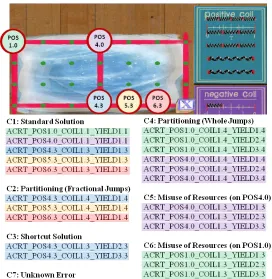
for an individual level of the game. This level was chosen as an example because it contained a variety of strategies, including both mathematical and game errors. The level image on the top of the figure shows the location of the five trampolines in this level and labels them with their position (e.g., POS1.0) so the image can be matched to the action names. The output for this particular level is displayed under the level image. It indicates that seven different clusters (C1 through C7) were identified in this level.
The output also shows the specific actions identified as belonging to each cluster. For instance, cluster 3 (C3) is composed of ACRT_POS4.3_COIL1.3_YIELD2.3 and ACRT_POS4.3_COIL1.3_YIELD3.3. The individual actions in the last cluster (C7) are not listed because that cluster consists of all otherwise unidentified actions. The cluster numbers represent the order in which they were identified by the cluster analysis, and hold no specific meaning outside of that.
Given the list of actions in each cluster and knowledge of the level in which the actions took place, names for each cluster were inferred (e.g., “standard solution,” “shortcut solution,” etc.) to indicate the specific strategy that group of actions appeared to represent. This allowed us to identify the same behavior (e.g., “partitioning errors”) across levels, even though the specific actions that made up that strategy differed in each level.
4.1.2 Comparing Fuzzy Clustering and Hard Clustering Results. Most educational data mining studies using cluster analysis have used hard clustering. While this method has been used successfully on test items to detect multidimensionality [Roussos et al. 1998] and to find conceptual similarity among items [Madhyastha and Hunt 2009], log data from educational video games and simulations are far more likely to require the use of fuzzy clustering algorithms than test item data because these environments often result in precisely the problems fuzzy cluster analysis was designed to address.
Fuzzy clustering was developed to address the issues of misclassification in hard clustering algorithms due to shape and size problems in the data, such as bridges between clusters, nonspherical clusters, linearly nonseparable clusters, or unequal cluster populations [Ruspini 1969]. In an environment where different solution strategies contain the same initial steps, different clusters will likely share some overlapping actions which will act as bridges between clusters and result in clusters that are not linearly separable. Additionally, some solution strategies will likely contain more actions than other solution strategies, resulting in unequal cluster populations.
The degree of ambiguous cluster assignment in the data is reported in the normalized Dunn coefficient. The normalized Dunn coefficient ranges from 0 to 1, with 0 indicating that the data is completely fuzzy (i.e., that actions cannot be clustered) and 1 indicating that the data is perfectly well-partitioned (i.e., that each action can be uniquely assigned to a single cluster). Like Levene’s test of equality of variance, the Dunn coefficient appears in the output of the analysis and indicates whether the correct analysis was run. If the Dunn coefficient shows that the data is poorly partitioned then the fuzzy cluster analysis was the correct analysis to run, whereas if the Dunn coefficient shows that the data is well partitioned a hard clustering algorithm should be run instead.
In our analyses, the Dunn coefficients for each level ranged from .13 ( very fuzzy) to .66 (moderately fuzzy) over the 18 levels we examined, with an average of .35. These results indicate that unique assignment of actions to clusters is not easy in our data and, therefore, fuzzy cluster analysis is more appropriate than hard cluster analysis.
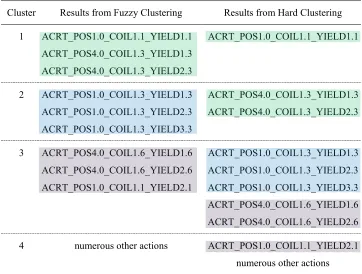
Table VII. A Comparison of Fuzzy and Hard Clustering of Stage 3 – Level 3
Cluster Results from Fuzzy Clustering Results from Hard Clustering
1 ACRT_POS1.0_COIL1.1_YIELD1.1 ACRT_POS4.0_COIL1.3_YIELD1.3 ACRT_POS4.0_COIL1.3_YIELD2.3
ACRT_POS1.0_COIL1.1_YIELD1.1
2 ACRT_POS1.0_COIL1.3_YIELD1.3 ACRT_POS1.0_COIL1.3_YIELD2.3 ACRT_POS1.0_COIL1.3_YIELD3.3
ACRT_POS4.0_COIL1.3_YIELD1.3 ACRT_POS4.0_COIL1.3_YIELD2.3
3 ACRT_POS4.0_COIL1.6_YIELD1.6 ACRT_POS4.0_COIL1.6_YIELD2.6 ACRT_POS1.0_COIL1.1_YIELD2.1
ACRT_POS1.0_COIL1.3_YIELD1.3 ACRT_POS1.0_COIL1.3_YIELD2.3 ACRT_POS1.0_COIL1.3_YIELD3.3 ACRT_POS4.0_COIL1.6_YIELD1.6 ACRT_POS4.0_COIL1.6_YIELD2.6
We chose Stage 3 – Level 3 to illustrate the differences between fuzzy and hard clustering because the differences in this level were clear and easy to explain. Additionally the level had a Dunn coefficient of .29, indicating that it was fairly representative of our data. The results from the fuzzy clustering and hard clustering algorithms are shown in Table VII.
The actions identified as being in Cluster 1 by the fuzzy clustering were ACRT_POS1.0_COIL1.1_YIELD1.1, ACRT_POS4.0_COIL1.3_YIELD1.3, and ACRT_POS4.0_COIL1.3_YIELD2.3. As can be seen from the screen shot of the level in Figure 7, these actions result in the placement of 1/1 on the first trampoline and 2/3 on the second trampoline, which corresponds to the standard solution for this level.
The actions identified by the fuzzy clustering as being in Cluster 2 were ACRT_POS1.0_COIL1.3_YIELD1.3, ACRT_POS1.0_COIL1.3_YIELD2.3, and ACRT_POS1.0_COIL1.3_YIELD3.3, which result in the placement of 3/3 on the first trampoline. While this is not mathematically incorrect, it is a misuse of the resources available in the level, as the student is now out of the thirds coils that they need to complete the level. The actions identified as being in Cluster 3 were ACRT_POS4.0_COIL1.6_YIELD1.6, ACRT_POS4.0_COIL1.6_YIELD2.6, and ACRT_POS1.0_COIL1.1_YIELD2.1; they result in the placement of 2/1 on the first trampoline and 2/6 on the second trampoline. This appears to be a gaming strategy that can be used to try to solve the levels by relying largely on the order in which the resources were presented rather than using math to determine the answer. In this case the 1/1 coils, which are located on the top of the resource bin, were placed on t he first trampoline and the 1/6 coils, which are located beneath the 1/1 coils in the resource bin, were placed on the next trampoline. Had there been a third trampoline, students using this strategy would have placed the 1/8 coils, which are located beneath the 1/6 coils, on the next trampoline. All other coil placements made by students in this level were identified as being in cluster 4, which appeared to be a catchall for all actions that did not cluster well with other actions.
2 as being representative of a “misuse of resources,” the actions in cluster 3 as being representative of an “everything in order” strategy, and the actions in cluster 4 as being “unexplained error.” The actions for the first three clusters are illustrated in Figure 6.
Fig. 6. Stage 3 – Level 3 of Save Patch, showing a screen shot of the level and an illustration of the fractional amounts placed on each trampoline for each of the clusters identified by fuzzy clustering.
ACRT_POS1.0_COIL1.1_YIELD2.1 was identified by the hard clustering as being in cluster 4 with the other unexplained errors.
Hard clustering allowed us to identify the actions in cluster 1 as being representative of the “standard solution” for the first trampoline in this level and the actions in cluster 2 as being representative of the “standard solution” for the second trampoline in this level. However, cluster 3 did not result in an easily identifiable strategy, as we could come up with no reason why a student would place 3/3 on the first trampoline and 2/6 on the second trampoline. The hard clustering did not allow for the identification of the “misuse of resources” strategy or the “everything in order” strategy in this level.
While the fuzzy clustering algorithm resulted in the identification of one solution strategy and two error patterns, the hard clustering algorithm only resulted in the identification of the solution strategy, and could only do t hat if cluster 1 and cluster 2 were combined. The difference in performance between the two algorithms occurred because the data for this level were very fuzzy. If the data had not been fuzzy, the results from the hard clustering and fuzzy clustering algorithms would have been nearly identical. While the difference between algorithms was not always this severe, the Dunn coefficients for each level indicated that the data were fuzzy. Therefore, fuzzy cluster analysis was deemed to be more appropriate than hard cluster analysis for our data and all results reported in this paper stem exclusively from fuzzy cluster analysis.
4.2 Identifying Similar Strategies in Similar Situations
Cluster analysis identified each of these strategies in a majority of the levels in which they were possible (see “identified frequency” in Table VIII). “Unitizing errors” were identified in six out of eight levels in which they were possible, or 75% of the time they were expected to occur. “Partitioning errors” were identified in seven out of 10 levels in which they were possible, or 70% of the time they were expected to occur. Overall, mathematical errors were found in 12 out of 13 levels in which they were possible, or 80% of the time they were expected to occur. Errors involving gaming mistakes were possible in all levels where the resources did not consist solely of one unit coils. These errors were identified in 10 out of 12 levels in which they were possible, or 83% of the time they were expected to occur.
Table VII. Strategies Identified by Cluster Analysis
Strategies identified frequencyIdentified a of attemptsPercentage b inaccuraciesNumber of c
Solutions 18 of 18 42.3% 2
Errors involving math misconceptions 12 of 15 32.5% 5
Unitizing errors 6 of 8 24.7% 2
Partitioning errors 7 of 10 34.6% 3
Errors involving gaming mistakes 10 of 12 20.3% 0
Unexplained errors 18 of 18 24.7% na
Notes. aIdentified frequency is the number of levels in which the cluster was identified
out of the number of levels in which it was possible. bPercentage of attempts is calculated
only for levels in which the cluster was identified. cNumber of inaccuracies is the number
of identified clusters that identified at least one action as belonging to the cluster which did not belong to that solution strategy or error pattern.
4.3 Accuracy of Identified Actions
identified solution strategy or error pattern (see “number of inaccuracies” in Table VIII).
In the seven cases where the cluster analysis identified extraneous actions, two were unitizing errors, three were partitioning errors, and two were solution strategies. The two clusters with unitizing errors extraneously identified one of seven actions in one cluster and one of five actions in the other cluster, leading to an overall rate of extraneous identification of 6% for unitizing clusters. The three clusters with partitioning errors extraneously identified one of nine actions, two of nine actions, and one of five actions, leading to an overall rate of extraneous identification of 5% for partitioning clusters. Overall, only 3% of actions were extraneously identified by the cluster analysis.
4.4 Amount of Explained Data
In order to examine the amount of data explained by the cluster analysis we first determined the percentage of levels in which cluster analysis was able to identify strategies. Of the 18 levels that were analyzed, cluster analysis identified key features of student performance in all but two levels, or 89% of the time. The two levels where cluster analysis could not identify key features of student performance were the first and third levels of the game (Stage 1 – Level 1 and Stage 2 – Level 2). These levels along with Stage 2 – Level 1 were designed to be extremely easy for students in order to draw them in to the experience and get them used to our representation of fractions.
(n-1)/2 where n is the number of actions). While “fanny” cannot identify key features of student performance in situations in which there is only one cluster, in all other levels it identified at least one cluster reflecting a l egitimate solution strategy, at least one cluster reflecting a specific type of error, and one cluster of unexplained error (see Table VIII).
To determine the amount of data explained by the cluster analysis, we also calculated the percentage of attempts that were identified by the cluster analysis by calculating the percentage of attempts that did not fall in the “unexplained error” cluster, (see “percentage of attempts” in Table VIII). “Standard solution” strategies made up 42% of all attempts, “unitizing errors” made up 25% of the attempts in the six levels in which the error occurred, “partitioning errors” made up 35% of the attempts in the seven levels in which the error occurred, and a majority of the remaining attempts were errors involving gaming mistakes such as using “everything in order.” The percentage of student attempts to solve a level that fell in the “unexplained error” cluster averaged 26% across all levels and ranged from 11% to 39% in individual levels. Overall, the cluster analysis was able to identify an average of 74% of the log data as belonging to a specific solution strategy or error pattern.
Table IX. Clusters Identified in Each Level of Save Patch
Cluster Type
Level Attempts Solution Math Error Game Error Total
1-1 177 1 (87%) -- -- 1 (87%)
2-1 264 1 (64%) 1 (3%) 1 (4%) 3 (71%)
2-2 490 1 (82%) -- -- 1 (82%)
3-1 319 1 (51%) -- 1 (37%) 2 (88%)
3-2 351 1 (6%) 1 (68%) -- 2 (74%)
3-3 446 1 (45%) -- 2 (26%) 3 (71%)
4-1 397 1 (57%) 1 (29%) -- 2 (86%)
4-2 373 2 (38%) 1 (20%) 1 (14%) 4 (72%)
4-3 304 2 (48%) -- 2 (34%) 4 (82%)
4-4 900 1 (15%) 1 (46%) 1 (7%) 3 (68%)
4-5 400 2 (39%) 1 (50%) -- 3 (89%)
5-1 644 2 (23%) 2 (31%) 1 (11%) 5 (65%)
5-2 586 1 (18%) 2 (52%) -- 3 (70%)
5-3 600 2 (35%) 2 (30%) -- 4 (65%)
6-1 448 1 (13%) 1 (30%) 1 (18%) 3 (61%)
6-2 143 3 (72%) -- 1 (11%) 4 (83%)
6-3 158 3 (51%) 2 (23%) -- 5 (74%)
6-4 254 2 (18%) 2 (30%) 1 (19%) 5 (67%)
5. DISCUSSION
This study indicates that cluster analysis may be a useful method of identifying key features of student performance in log data generated by educational video games or simulations, particularly in the context of evidence-centered design.
indicate the strategies (and the specific actions making up those strategies) that are expected in the game.
Cluster analysis expands on the information provided by the ECD framework by identifying unexpected strategies. In this case, we did not expect students to have trouble identifying the denominator or to use gaming strategies to circumvent the math. However, these errors accounted for 66% of all errors made in the game. This indicates that the cluster analysis contributes significantly to the evidence identification process.
In our study, cluster analysis was able to identify specific solution strategies and error patterns in all but two levels and 70% to 80% of the time they were possible. Of the actions identified by the analysis as belonging to each cluster, 94% to 97% of them appeared to be accurately identified. Additionally, cluster analysis was able to explain 74% of the variation in the actions that made up the log files.
However, these findings are only preliminary and more rigorous examinations of the reliability and validity of the cluster analysis are necessary. Since cluster analysis is designed to uncover the latent dimensionality of data sets that are so large that their underlying structure is obscured, the interpretation of the validity of the identified clusters is inevitably application-dependent and somewhat subjective [Hand et al. 2001]. Further studies interviewing students who make specific errors identified by the cluster analysis to determine whether the reason they give for their actions matches our assumptions (e.g., do students who make unitizing errors really think that the whole grid is one unit?, do students who make partitioning errors really count the dots to determine the denominator?) or comparing key features of student performance in the game to their answers on a more standard pretest (e.g., do students who make unitizing errors in the game make unitizing errors on num ber line questions on the pretest?) would help address concerns regarding our labeling of the clusters.
improved student performance would help validate the results. Studies that use the strategies identified by the cluster analysis as variables to predict in-game performance, posttest scores, or the difference between pretest and posttest scores would also help move these results beyond their preliminary state, as would studies that examine cluster analysis results for other games or other types of games.
ACKNOWLEDGEMENTS
REFERENCES
BERKHIN, R. 2006. A survey of clustering data mining techniques. In Grouping Multidimensional Data, J. KOGAN, C. NICHOLAS, AND M. TEBOULLE, Eds.
Springer, New York, NY, 25-72.
BONCHI, F., GIANNOTI, F., GOZZI, C., MANCO, G., NANNI, M., PEDRESCHI, D., RENSO, C., AND RUGGIERI, S. 2001. Web log data warehouses and mining for intelligent web caching. Data & Knowledge Engineering 39, 165-189.
CRAGAR, G. E., BERRY, D. T. R., SCHMITT, F. A., AND FAKHOURY, T. A. 2005. Cluster analysis of normal personality traits in patients with psychogenic nonepileptic seizures. Epilepsy & Behavior6, 593-600.
CHUNG, G. K. W. K., BAKER, E. L ., VENDLINSKI, T. P., BUSCHANG, R. E., DELACRUZ, G. C., MICHIUYE, J. K., AND BITTICK, S. J. 2010. Testing instructional design variations in a prototype math game. In Current Perspectives from Three National R&D Centers Focused on Game-based Learning: Issues in Learning, Instruction, Assessment, and Game Design. Structured poster session at
the annual meeting of the American Educational Research Association, Denver, CO, April, 2010, R. ATKINSON, Chair.
CHUNG, G. K. W. K., AND KERR, D. 2012. A Primer on Data Logging to Support Extraction of Meaningful Information from Educational Games: An Example from Save Patch. (CRESST Tech. Rep. No. 814). University of California, Los Angeles,
National Center for Research on Evaluation, Standards, and Student Testing, Los Angeles, CA.
FRAWLEY, W. J., PIATESKI-SHAPIRO, G., AND MATHEUS, C. J. 1992. Knowledge discovery in databases: An overview. AI Magazine13, 57-70.
FREZZO, D. C., BEHRENS, J. T., MISLEVY, R. J., WEST, P., AND DICERBO, K. E. 2009. Psychometric and evidentiary approaches to simulation assessment in packet tracer software. In Proceedings of the Fifth International Conference on Networking and Services (ICNS 2009), Valencia, Spain, April, 2009, 555-560.
HAND, D., MANNILA, H., AND SMYTH, P. 2001. Principles of data mining. MIT
Press, Cambridge, MA.
HUANG, Z. 1998. Extensions to the k-means algorithm for clustering large data sets with categorical values. Data Mining and Knowledge Discovery 2, 283-304.
JAIN, A. K., MURTY, M. N., AND FLYNN, P. J. 1999. Data clustering: A review. ACM Computing Surveys, 31, 264-323.
JAMES, F., AND MCCULLOCH, C. 1990. Multivariate analysis in ecology and systematic: Panacea or Pandora’s box? Annual Review of Ecology and Systematics 21, 129-166.
KERR, D., AND CHUNG, G. K. W. K. 2012. Using Cluster Analysis to Extend Usability Testing to Instructional Content. (CRESST Tech. Rep. No. 816). University of
California, Los Angeles, National Center for Research on Evaluation, Standards, and Student Testing, Los Angeles, CA.
KRIER, C., FRANCOIS, D., ROSSI, F., AND VERLEYSEN, M. 2007. Feature clustering and mutual information for the selection of variables in spectral data. In
Proceedings of the 2007 European Symposium on Artificial Neural Networks (ESANN 2007), Bruges, Belgium, April, 2007, 157-162.
MADHYASTHA, T., AND HUNT, E. 2009. Mining diagnostic assessment data for concept similarity. Journal of Educational Data Mining1, 72-91.
MALCOM, S. M., CHUBIN, D. E. AND JESSE, J. K. 2004. Standing our ground: A guidebook for STEM educators in the Post-Michigan Era. American Association for
MASIP, D., MINGUILLON, J., AND MOR, E. 2011. Capturing and analyzing student behavior in a virtual learning environment. In Handbook of Educational Data
Mining, C. ROMERO, S. VENTURA, M. PECHENIZKIY, AND R. S.J.D. BAKER,
Eds. CRC Press, Boca Raton, FL, 339-351.
MERCERON, A., AND YACEF, K. 2004. Mining student data captured from a web-based tutoring tool: Initial exploration and results. Journal of Interactive Learning Research 15, 319-346.
MISLEVY, R. J., ALMOND, R. G., AND LUKAS, J. F. 2004. A Brief Introduction to ECD. (CRESST Tech. Rep. No. 632). University of California, Los Angeles,
National Center for Research on Evaluation, Standards, and Student Testing, Los Angeles, CA.
MISLEVY, R.J., STEINBERG, L.S., ALMOND, R.G., AND LUKAS, J.F. 2006. Concepts, terminology, and basic models of evidence-centered design. In Automated Scoring of Complex Tasks in Computer-based Testing,D. M. WILLIAMSON, I. I.
BEJAR, AND R. J. MISLEVY, Eds. Erlbaum, Mahwah, NJ, 15-48.
NATIONAL MATHEMATICS ADVISORY PANEL (NMAP). 2008. Foundations for success: The final report of the National Mathematics Advisory Panel. U.S.
Department of Education, Washington, DC.
R DEVELOPMENT CORE TEAM. 2010. R: A Language and Environment for Statistical Computing [Computer software]. Retrieved from
http://www.R-project.org
ROMERO, C., GONZALEZ, P., VENTURA, S., DEL JESUS, M. J., AND HERRERA, F. 2009. Evolutionary algorithms for subgroup discovery in e-learning: A practical application using Moodle data. Expert Systems with Applications 39, 1632-1644.
ROMERO, C., AND VENTURA, S. 2007. Educational data mining: A survey from 1995 to 2005. Expert Systems with Applications 35, 135-146.
ROUSSOS, L., STOUT, W., AND MARDEN, J. 1998. Using new proximity measures with hierarchical cluster analysis to detect multidimensionality. Journal of Educational Measurement 35, 1-30.
ROWLEY, S. 2000. Profiles of African-American college students’ educational utility and performance: A cluster analysis. Journal of Black Psychology26, 3-26.
RUPP, A. A. in press. Clustering and classification. In The Oxford Handbook of Quantitative Methods, T. LITTLE, Ed. Oxford University Press, New York, NY.
RUPP, A. A., GUSHTA, M., MISLEVY, R. J., AND SHAFFER, D. W. 2010. ECD of epistemic games: Measurement principles for complex learning environments. The
Journal of Technology, Learning, and Assessment 8, Retrieved from
http://ejournals.bc.edu/ojs/index.php/jtla/article/view/1623/1467
RUSPINI, E. H. 1969. A new approach to clustering. Information and Control 15, 22-32.
STEINLEY, D. 2006. K-means clustering: A half-century synthesis. British Journal of Mathematical and Statistical Psychology 59, 1-34.
TRIGWELL, K., PROSSER, M., AND WATERHOUSE, F. 1999. Relations between teachers’ approaches to teaching and students’ approaches to learning. Higher Education37, 57-70.
VOGT, W., AND NAGEL, D. 1992. Cluster analysis in diagnosis. Clinical Chemistry 38,
APPENDIX
Code for Running Cluster Analysis in R
library(cluster)
library(vegan)
tlevel<- t(level)
dlevel<- dist(tlevel,"manhattan")
flevel<- fanny(dlevel,c)
summary(flevel)
ord<- cmdscale(dlevel)
ordiplot(ord, dis = "si")
ordihull(ord, f$clustering, col = "blue")
hlevel<- agnes(dlevel)
plot(hlevel)