Citation: Bajoghli M. Comparison of Application of AERMOD and ISCST3 Models for Simulating the Dispersion of Emitted Pollutant from the Stack of an Industrial Plant in Different Time Scales. Archives of Occupational Health. 2019; 3(1): 245-51.
Article History: Received: 6 August 2018; Revised: 1 November 2018; Accepted: 24 November 2018
1 MSc in Environmental Science, Isfahan (Khorasgan) Branch, Islamic Azad University, Isfahan, Iran
Abstract
Background:
Methods:
×
Results:
Conclusion:
Key words:
Introduction
Methods
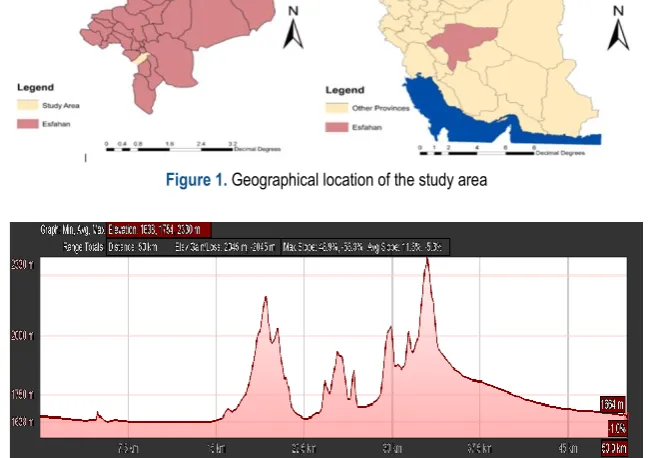
Figure 1. Geographical location of the study area
Figure 2. Elevation changes in 50 km radius
۰
۰
×
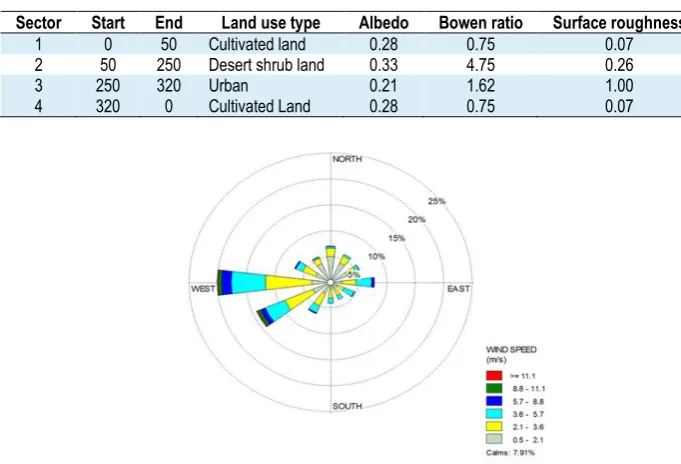
Table 1. Surface parameters used in AERMET preprocessor
Sector Start End Land use type Albedo Bowen ratio Surface roughness
1 0 50 Cultivated land 0.28 0.75 0.07
2 50 250 Desert shrub land 0.33 4.75 0.26
3 4
250 320
320 0
Urban Cultivated Land
0.21 0.28
1.62 0.75
1.00 0.07
Figure 3.Produced wind rose with common meteorological data between two models
Figure 5. 1 hour average concentrations
Figure 4.
24 hour average concentrations Using AERMOD Using AERMOD
Figure 7 . Monthly average concentrations Figure 6.Annual average concentrations Using AERMOD using AERMOD
Figure 9. 1 hour average concentrations
Figure 8. 24 hour average concentrations Using ISCST3 using ISCST3
Figure 11. Monthly average concentrations Figure 10. Annual average concentrations Using ISCST3 using ISCST3
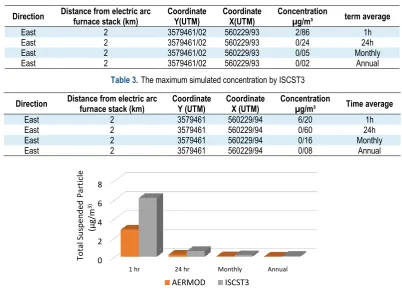
Table 2.The maximum simulated concentration by AERMOD
term average Concentration µg/m³ Coordinate X(UTM) Coordinate Y(UTM) Distance from electric arc
furnace stack (km) Direction 1h 2/86 560229/93 3579461/02 2 East 24h 0/24 560229/93 3579461/02 2 East Monthly 0/05 560229/93 3579461/02 2 East Annual 0/02 560229/93 3579461/02 2 East
Table 3.The maximum simulated concentration by ISCST3
Time average Concentration µg/m³ Coordinate X (UTM) Coordinate Y (UTM) Distance from electric arc
furnace stack (km) Direction 1h 6/20 560229/94 3579461 2 East 24h 0/60 560229/94 3579461 2 East Monthly 0/16 560229/94 3579461 2 East Annual 0/08 560229/94 3579461 2 East
Figure 12.Comparison of simulated concentrations with AERMOD and ISCST3
0 2 4 6 8
1 hr 24 hr Monthly Annual
To tal S u sp en d ed Pa rt ic le (μ g/m 3 ) AERMOD ISCST3
.
References
1- Watkins T, Williams R, Vette A, Burke J, George BJ, Isakov V. Air Pollution Modeling and Its Application XIX. The Importance of Exposure in Addressing Current and Emerging Air Quality Issues. US: springer; 2008.P:640647
2- Kesarkar AP, Dalvi M, Kaginalkar A, Ojha A. Coupling of the weather research and forecasting model with aermod for pollutant dispersion modeling. a case study for pm10 dispersion over pune, India. Atmospheric environment. 2007;41(9):1976-88
3- Vallero DA. Fundamentals of Air Pollution. 4th ed. Burlington: Academic Press; 2008.
4- Gurjar BR, Molina LT, Ojha CSP. Air Pollution: Health and Environmental Impacts. CRC Press Florida; 2010.
5- Caputo M, Giménez M, Schlamp M. Intercomparison of atmospheric dispersion models. Atmospheric Environment. 2003; 37(18):2435-49.
6- Vannucci M, Valentina C, Haines N. Air dispersion modeling for the assessment of ULCOS technologies. Metallurgical Research & Technology Formerly Revue de Métallurgie. 2009;106(9):357-62. 7- Collett RS, Oduyemi K. Air quality modelling: a technical review of
mathematical approaches. Meteorological applications. 1997;4(3):235-246.
8- Modi M, Venkata Ramachandra P, Liyakhath Ahmed SK, Zakir H. A Review on theoretical air pollutants dispersion models. International journal of pharmaceutical, Chemical and Biological Sciences. 2013;3(4):1224-30.
9- Morselli M, Ghirardello D, Semplice M, Raspa G, Di Guardo A. Integration of an atmospheric dispersion model with a dynamic multimedia fate model: development and illustration. Environmental pollution. 2012;164:182-7.
10- Afzali A, Rashid M, Noorhafizah K, Amar M. Evaluating human exposure to emission from incineration plant using AERMOD dispersion modeling. Iranian journal of public health. 2015; 43(3):25-33.
11- Haynes EN, Heckel P, Ryan P, Roda S, Leung YK, Sebastian K, et.al. Environmental manganese exposure in residents living near a ferromanganese refinery in Southeast Ohio: a pilot study. Neurotoxicology. 2010;31(5):468-74.
12- Rood AS. Performance evaluation of AERMOD, CALPUFF, and legacy air dispersion models using the Winter Validation Tracer Study dataset. Atmospheric environment. 2014;89: 707-20.
13- Sax T, Isakov V. A case study for assessing uncertainty in local-scale regulatory air quality modeling applications. Atmospheric Environment. 2003;37(25):3481-9.
14- Mulukutla ANV, Varghese GK. Comparison of field monitored and prognostic model generated meteorological parameters for source dispersion modeling. Modeling Earth Systems and Environment. 2015;1(4):39.
15- Hanna SR, Egan BA, Purdum J, Wagler J. Evaluation of the ADMS, AERMOD, and ISC3 dispersion models with the OPTEX, Duke Forest, Kincaid, Indianapolis and Lovett field datasets. International Journal of Environment and Pollution. 2001;16(1-6):301-14.
16- Orloff KG, Kaplan B, Kowalski P. Hydrogen cyanide in ambient air near a gold heap leach field: Measured vs. modeled concentrations. Atmospheric Environment. 2006;40(17):3022-9. 17- Kalhor M, Bajoghli M. Comparison of AERMOD, ADMS and ISC3
for incomplete upper air meteorological data (case study: Steel plant). Atmospheric pollution research. 2017; 8(6):1203-8. 18- Faulkner WB, Shaw BW, Grosch T. Sensitivity of two dispersion
models (AERMOD and iscst3) to input parameters for a rural ground-level area source. The Air & Waste management association. 2008;58(10):1288-96.
19- EPA. Comparison of regulatory design concentrations: Aermod versus iscst3 and ctdmplus. 2003.