www.geosci-instrum-method-data-syst.net/2/339/2013/ doi:10.5194/gi-2-339-2013
© Author(s) 2013. CC Attribution 3.0 License.
Instrumentation
Methods and
Data Systems
A double-station meteor camera set-up in the Canary Islands –
CILBO
D. Koschny1, F. Bettonvil2, J. Licandro3, C. v. d. Luijt1, J. Mc Auliffe4, H. Smit1, H. Svedhem1, F. de Wit1, O. Witasse1, and J. Zender1
1European Space Agency ESA/ESTEC, Keplerlaan 1, 2200 AG Noordwijk ZH, the Netherlands 2Astronomical Institute Utrecht, Princetonplein 5, 3584 CC Utrecht, the Netherlands
3Observatorio del Roque de los Muchachos, Instituto de Astrofísica de Canarias, Apdo. Correos 50,
C/Cuesta de San José, s/n, San Antonio, 38712 – Breña Baja (La Palma), Spain
4European Space Agency ESA/ESAC, Camino bajo del Castillo, s/n, Urbanizacion Villafranca del Castillo,
Villanueva de la Cañada, 28692 Madrid, Spain
Correspondence to: D. Koschny ([email protected])
Received: 30 July 2013 – Published in Geosci. Instrum. Method. Data Syst. Discuss.: 9 August 2013 Revised: 20 November 2013 – Accepted: 3 December 2013 – Published: 23 December 2013
Abstract. This paper describes a double-station camera set-up in the Canary Islands, called CILBO (Canary Island Long-Baseline Observatory). Image-intensified video cameras – one camera on Tenerife and one on La Palma – monitor the same volume of the atmosphere. They are located in auto-mated roll-off roofs. From the obtained data, the meteoroid trajectory can be computed. A second camera on Tenerife is equipped with an objective grating. For bright meteors (typ-ically 0 mag or brighter), a spectrum is recorded which al-lows constraining the chemical composition of the meteor. The system is completely automated and sends the obtained data after every observation night to a central FTP server. It has been in operation for about 2 yr and the first scientific results have been produced.
1 Introduction and scientific rationale
Dust is ubiquitous in the solar system. It is formed during impact events on solid solar system objects and by the gas-driven ejection of dust from cometary nuclei. It manifests it-self in zodiacal light (e.g. Levasseur-Regourd et al., 2001) and thermal emission of the sky background (e.g. Pyo et al., 2009); in impact craters on natural and artificial surfaces in space (Grün et al., 1985; Krüger et al., 2007); and, when in-teracting with the Earth’s atmosphere, in meteors.
The dust particles causing meteors are often referred to as meteoroids. When a meteoroid enters the Earth’s atmo-sphere, it excites air molecules, which generates light and an ionized path in the atmosphere. The light can be recorded with optical cameras; the ionized path reflects radio waves and allows observation by radar systems.
Up until a few years ago, the global meteoroid complex was observed mainly by radar systems (e.g. Baggaley et al., 1994; Campbell-Brown and Jones, 2006). Radars can ob-serve the complete sky, and detect the ionization trails of me-teoroids down to an estimated size of micrometres. Due to the ready availability of low-light level video surveillance cam-eras, optical observations of meteors have seen a dramatic in-crease in popularity in recent years. However, non-intensified video cameras are limited in sensitivity and typically only al-low recording meteoroids larger than a few millimetres in diameter.
In order to contribute to the measurements of the global meteoroid dust distribution, we have set up a double-station system for meteor observations using intensified video cam-eras in the Canary Islands. The system is called CILBO, which stands for “Canary Island Long-Baseline Observa-tory”. CILBO also is a whistling language used by the in-digenous population of the island for communication.
meteoroid properties during their flight in the solar sys-tem, to constrain the physical and chemical properties of their parent body.
b. To study the variability of the background dust flux in the Earth environment during a complete year. The use of image intensifiers allows the system to record fainter meteors compared to non-intensified systems, bridg-ing the gap to radar observations. It also results in very spe-cial operational constraints, as an image intensifier becomes damaged when it is exposed to too much bright light (e.g. the Moon going through the field of view). This paper describes in detail the set-up and explains in particular the special pre-cautions needed to be taken when operating a light-sensitive image intensifier system in an autonomous way.
2 The observation stations
2.1 Overview
The location of the camera stations must fulfil the follow-ing requirements: they should be located under dark skies and about 100 to 150 km apart from each other. Infrastructure like power connections and internet should be available. We have selected the Canary Islands where two astronomical ob-servatories provide not only technical infrastructure but also personnel, which can be contacted in case of problems. One station (called CILBO-T) is located on Tenerife at the Izaña Observatory, next to the ESA-operated Optical Ground Sta-tion (OGS) telescope. The control computer is located in the basement of the OGS. The other selected site is on La Palma, at the Observatorio del Roque de los Muchachos. There, our station (CILBO-L) is located next to the Automated Transit Circle, where the control computer is located.
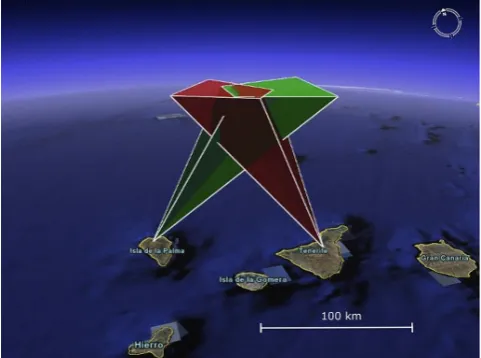
We currently use one pair of cameras to monitor a volume in the sky about half way between the two islands in 100 km altitude (see Fig. 1). On Tenerife, a second camera with an objective grating is used to record meteor spectra. The cam-era is tilted such that the first-order spectrum of the same meteor as that recorded in the “zero-order” camera is in the field of view. In the future we plan to add a second camera on La Palma to record meteors occurring at a higher altitude.
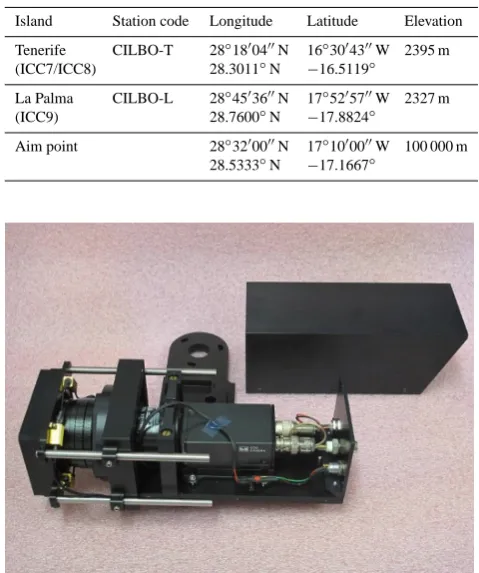
Table 1 gives the precise locations of the stations. 2.2 The cameras
Most other camera networks we are aware of use un-intensified low-light-level surveillance cameras. These have a typical limiting stellar magnitude of 3–4 for the field of view that we are using (22◦×28◦). The limiting magnitude for meteors depends on the apparent velocity of the meteor – the slower it is, the closer the limiting magnitude will be to that of the non-moving stars. The goal in our set-up was to reach a limiting stellar magnitude of about 6.5 while at the same time reaching a positional accuracy of 10 or better to
Fig. 1. Principle sketch of the CILBO camera set-up. Image: Google
Earth
allow good orbit determination. This can only be achieved using image intensifiers.
Figure 2 shows a photograph of one of our cameras. A technical overview drawing is shown in Fig. 3. All cameras are named ICCn, where ICC is the abbreviation for “Intensi-fied CCD Camera” andnis a number. We use low-distortion machine-vision lenses (Fujinon CF-25L) with 25 mm focal length and a maximum aperture of f/0.85. The lens images the sky onto the entrance aperture of a second-generation image intensifier (DEP XX-1700). The intensifier has a spec-tral sensitivity from about 350 to 850 nm. It is fibre-coupled to a charge-coupled device (CCD), which is read out via a Toshiba Teli CS8310Bi PAL video camera. The PAL format has 576×768 pixel2; 25 full frames are read out per second with 8 bit dynamical accuracy. With the given field of view the pixel scale is 2.30.
A dew remover (type Kendrick) is wrapped around the ob-jective lens to avoid dewing.
The spectrum camera on Tenerife is identical to the zero-order camera. A Zeiss transmission grating with 611 grooves mm−1is mounted in front of the objective lens. The holder is heated via four power resistors to avoid dewing.
2.3 The housing
Table 1. Geographical positions of the two observation stations and
the aim point.
Island Station code Longitude Latitude Elevation
Tenerife (ICC7/ICC8)
CILBO-T 28◦1800400N
28.3011◦N
16◦3004300W −16.5119◦
2395 m
La Palma (ICC9)
CILBO-L 28◦4503600N 28.7600◦N
17◦5205700W
−17.8824◦
2327 m
Aim point 28◦3200000N 28.5333◦N
17◦1000000W
−17.1667◦
100 000 m
Fig. 2. Photograph of one of the intensified video cameras. The
protective cover is removed and visible in the back. The camera is shown with the optional grating holder on the left side. Power resistors to heat the grating can be seen on the left.
control electronics in a weather-proof box. This box can be seen (with a transparent door) in the front of the roof.
Foundation, roll-off roof, and pier can be seen in the con-figuration drawing Fig. 5.
On the Canary Islands, the foundation and lower part of the wall was poured in concrete. A metal pier holds the camera via heavy-duty camera tripod heads.
On Tenerife, a spectral camera with an objective grating is mounted under an angle of 14◦ such that the first-order spectrum of meteors recorded by the zero-order camera is visibly centred in the field of view. The objective grating is blazed, and the orientation of the grating is chosen such that the maximum light is deflected into the field of view.
2.4 Electronic set-up and software
A control software interfaces with the different modules: a certain time after sunset, the weather conditions are checked. If they are okay, the roof opens and the cameras start detect-ing meteors. Detected events are stored to the hard disk. In the morning, the detection software is stopped, the cameras are switched off and the roof is closed. The collected data
Fig. 3. Technical drawing of the camera showing the main elements.
Fig. 4. Roll-off roof in real-sky test environment.
are packed in a zip file and sent to a central FTP server. An email notification system informs the operators of the system status.
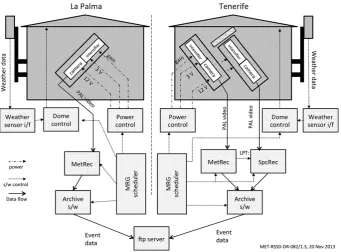
The following paragraphs describe this process in more detail. A block diagram showing the control process of hard-ware and softhard-ware is shown in Fig. 6.
A dedicated controller provided by the company Pier-Tech interfaces with the Pier-Pier-Tech roof. An ADLink NuDAM 6024 voltage controller is used to switch the cameras and im-age intensifiers on and off. It is operated via an RS485 inter-face.
Fig. 5. Cut side view and back view of the complete housing with pier.
Fig. 6. CILBO block diagram.
Tenerife, it also starts up a software called SpcRec, which reads out the camera with the objective grating.
The scheduler computes the distance of the field of view of the main camera to the centre of the field of view as a func-tion of time. To avoid damaging the intensifier, the system is switched off when the Moon gets closer than 40◦ (config-urable) to the centre of the field of view. The spectral camera points more to the north compared to the zero-order camera, so it is always safe.
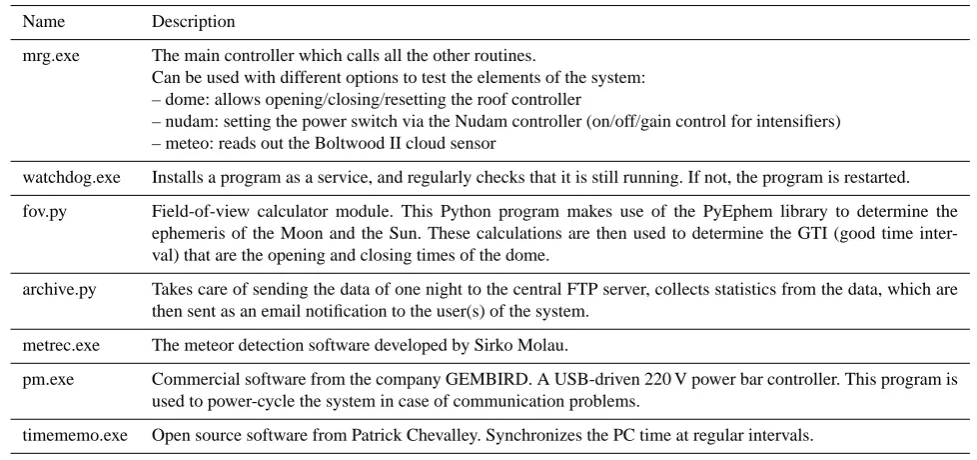
Table 2. C++and Python scripts developed as part of the “mrg” application.
Name Description
mrg.exe The main controller which calls all the other routines.
Can be used with different options to test the elements of the system: – dome: allows opening/closing/resetting the roof controller
– nudam: setting the power switch via the Nudam controller (on/off/gain control for intensifiers) – meteo: reads out the Boltwood II cloud sensor
watchdog.exe Installs a program as a service, and regularly checks that it is still running. If not, the program is restarted.
fov.py Field-of-view calculator module. This Python program makes use of the PyEphem library to determine the ephemeris of the Moon and the Sun. These calculations are then used to determine the GTI (good time inter-val) that are the opening and closing times of the dome.
archive.py Takes care of sending the data of one night to the central FTP server, collects statistics from the data, which are then sent as an email notification to the user(s) of the system.
metrec.exe The meteor detection software developed by Sirko Molau.
pm.exe Commercial software from the company GEMBIRD. A USB-driven 220 V power bar controller. This program is used to power-cycle the system in case of communication problems.
timememo.exe Open source software from Patrick Chevalley. Synchronizes the PC time at regular intervals.
It generates false detections when clouds move through the field of view. When the sky is bright (close to full moon), background noise fluctuations can also trigger false detec-tions.
The cameras point in a fixed direction in azimuth and ele-vation. Using the tool “RefStars” from the MetRec software suite, we have determined the pointing position of the cam-eras to sub-pixel accuracy. This is done by manually match-ing stars in the field of view with reference stars on a star map. From the matches and the time of the image used, Ref-Stars computes the necessary pointing information for the camera. If the camera position is fixed, this needs to be done once. Due to very small changes in the mounting, this pro-cess needs to be repeated typically every few months. The transformation from pixels to celestial coordinates is done by a third-order polynomial fit. Typically 50–100 stars are used for the fit, using two to three reference images, resulting in root-mean-square residuals of typically below 10.
With the pointing information and the time of a meteor event, MetRec generates position measurements of each de-tected event in right ascension and declination. The given po-sition is the photometric centre of the meteor in each single frame where the meteor was detected. MetRec automatically estimates the magnitude of the meteor in each individual frame. The way this is determined is that the sum of the pixel values in a given aperture is compared to the pixel values of the reference stars marked with the previously mentioned tool “RefStars”. While a colour correction is performed, Me-tRec does not properly handle changes in image brightness towards the corner of the images. The magnitudes are there-fore not extremely accurate; we expect the typical error bars for bright events to be±1 mag.
MetRec stores, for each meteor, one sum image file of all frames in which the meteor was detected, a movie sequence of a sub-frame containing the meteor, and a text file giving a magnitude estimate and the position of the meteor in each frame. In addition, MetRec uses the visible stars in the field of view to determine an estimate of the limiting magnitude and possible cloud factor for every minute.
Tests have shown that MetRec has difficulties to detect meteor spectra reliably. Therefore we have opted for the fol-lowing solution: MetRec allows sending information to the RS232 serial port; in particular it allows sending the infor-mation that a meteor was detected. We have physically con-nected one of the serial ports of the PC with another printer port. This printer port receives the information from Me-tRec. A dedicated software – called SpcRec (for “spectrum recorder”) – continuously grabs frames from the spectrum camera into a ring buffer. It monitors the incoming serial port. When a “meteor-detected” signal is received, it stores the relevant image frames.
Time information for both MetRec and SpcRec is taken from the PC clock. The clock is synchronized every 2 min with a “network time protocol” server using the freeware software tool “TimeMemo”.
Fig. 7. Screenshot of weather conditions, roof status, and number
of detections as sent from CILBO via email at the end of an obser-vation night.
When any of the given thresholds are exceeded, the control software properly closes down MetRec, closes the roof, and switches off cameras and image intensifiers. If the weather conditions get better again, the system may be switched back to operational status.
In the morning the control software shuts down the sys-tem when the Sun reaches a configurable elevation below the horizon. Then, the detection software MetRec is shut down, the cameras and image intensifiers are switched off, and the roof is closed.
In the next step, the data directories of all cameras for the night are packed into a zip file. This zip file is transferred via FTP to a server located at ESA/ESTEC in the Nether-lands. An email notification with a summary of the night is generated. The email contains information on the time(s) the system was operating, the number of detections in these time intervals, the free disk space on the computer and the size and name of the transferred data files. A screenshot of a graph showing the weather conditions, the roof open/closed status, and the cumulative number of meteor detections is also at-tached. Figure 7 shows an example of such a screenshot. It gives a very quick overview of the observation night and al-lows the trained user to judge whether the system functioned correctly that night.
Several safety measures are built into the system:
a. The roof has mechanical limit switches. These are ac-tivated when the roof is open or closed. The Pier-Tech roof control will issue an error if the roof does not reach the commanded position within a preconfig-ured time. When this error is encountered, the schedul-ing software attempts to reset the Pier-Tech roof con-troller and sends another “open” or “close” command. If a total of three resets still do not result in a
suc-cessful opening or closing, a power cycle for the roof is commanded via a USB-connected power distribu-tion strip. If the first power cycle does not succeed in re-establishing communication, a second and final at-tempt is made 30 s later. After a power cycle, an email is sent to a pre-defined email list with a notification message.
b. The NuDAM 6024 voltage controller, which switches the cameras and the image intensifiers on and off, also includes a watchdog timer. This timer is set to 30 s and triggers a system shutdown in a controlled man-ner (camera off, intensifier off, close dome), when no “ping” communication is received from the control computer. Such an event may occur with mrg.exe pro-gram crashes, the control computer crashes, or due to a bad operation by the system operator.
c. In normal operation, the software reads out the Bolt-wood cloud sensor every few seconds and triggers a dome closure when the weather conditions exceed pre-defined thresholds. An additional safety feature is built into the hardware using the Boltwood cloud sensor’s “threshold exceeded” signal. This is used as redun-dancy in case of software logic failure. The “threshold exceeded” signal feeds into specially designed hard-ware, which closes the roof.
3 Data processing
After the cameras were mounted, we used the “RefStars” programme from the MetRec software suite to determine the precise pointing position of the camera. This allows the de-tection software to convertx/ypositions in an image to ce-lestial coordinates. For each frame where a meteor was de-tected, the right ascension and declination of the photometric centre of the meteor is measured and stored.
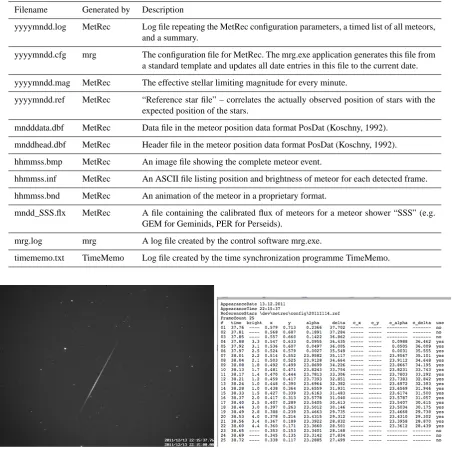
The system stores one directory per camera and per night. Each directory contains a number of files as defined in Ta-ble 3. The FTP server has one directory per camera. In each camera directory, the data from one observation night are contained in one zip file with the file name yyyymndd.zip.
The main scientific data are contained in the *.inf files which list, for each meteor, the right ascension and decli-nation of the photometric centre of the meteor for each de-tected frame and its magnitude. If data of the same meteor are available from both stations, this information can be used to compute the trajectory with respect to the Earth and from that the heliocentric orbit of the meteor.
Table 3. The data which the system generates automatically every night.
Filename Generated by Description
yyyymndd.log MetRec Log file repeating the MetRec configuration parameters, a timed list of all meteors, and a summary.
yyyymndd.cfg mrg The configuration file for MetRec. The mrg.exe application generates this file from a standard template and updates all date entries in this file to the current date.
yyyymndd.mag MetRec The effective stellar limiting magnitude for every minute.
yyyymndd.ref MetRec “Reference star file” – correlates the actually observed position of stars with the expected position of the stars.
mndddata.dbf MetRec Data file in the meteor position data format PosDat (Koschny, 1992).
mnddhead.dbf MetRec Header file in the meteor position data format PosDat (Koschny, 1992).
hhmmss.bmp MetRec An image file showing the complete meteor event.
hhmmss.inf MetRec An ASCII file listing position and brightness of meteor for each detected frame.
hhmmss.bnd MetRec An animation of the meteor in a proprietary format.
mndd_SSS.flx MetRec A file containing the calibrated flux of meteors for a meteor shower “SSS” (e.g. GEM for Geminids, PER for Perseids).
mrg.log mrg A log file created by the control software mrg.exe.
timememo.txt TimeMemo Log file created by the time synchronization programme TimeMemo.
Fig. 8. A typical meteor image and the corresponding *.inf file.
continuously produced. The viewing geometry in space is computed from the pointing direction of the camera. Assum-ing typical values of the magnitude distribution for shower meteors, the flux of the particles in km−3s−1is computed. The data are uploaded regularly to the beta version of the MetRec FluxViewer at http://vmo.estec.esa.int/flx.
The actual sum image itself is also typically used for sci-entific analysis (e.g. to get a continuous light curve of the meteor). An example image and the corresponding *.inf file is shown in Fig. 8.
After the data have been received at the central FTP server, they are downloaded to a local processing machine. The
soft-ware “PostProc” from the MetRec softsoft-ware suite is used to visually inspect all potential meteor events. False detections are deleted.
4 First scientific results
Page 26/27
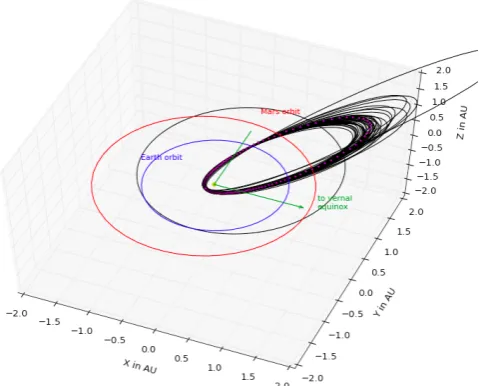
Figure 9: 3-D view of the orbits of meteors associated with the Geminid meteor shower by MetRec in the nights 13-15 Dec 2011. Fig. 9. 3-D view of the orbits of meteors associated with the Gemi-nid meteor shower by MetRec in the nights 13–15 December 2011.
The double-station system has been fully operational with both stations for a total of about 12 months. Between 60 and 130 meteors are typically captured by each of the “zero-order” cameras in a clear night. About five nights per month are lost to the Moon or to bad weather, resulting in about 800 to 3000 meteors per month. About 70 % of these are double-station meteors, allowing trajectory and orbit computations.
The grating camera of CILBO-T records spectra only of the brightest meteors. Typically, these need to be brighter than 0 mag. About one to two meteors per night are bright enough, resulting in about 30–40 spectra per month.
To give a first impression of the results this set-up is ca-pable of producing, we have analysed double-station data from the Geminid meteor shower on 13–15 December 2011. We uploaded the data into the Virtual Meteor Observatory (http://vmo.estec.esa.int, Barentsen et al., 2010) and used its built-in orbit computation tool MOTS (Meteor Orbit and Tra-jectory Software; Koschny and Diaz, 2002).
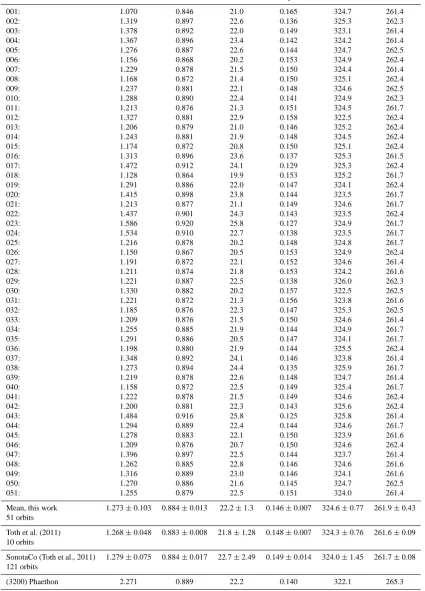
Using the double-station data of all meteors marked as Geminids by the detection software, we obtain Fig. 9. The 3-D view of the inner solar system shows the position of the Earth, Mars, and the orbits of the detected meteors. The dotted orbit embedded in the meteor orbits denotes the orbit of (3200) Phaethon. Table 4 shows the individual orbits and mean values, compared to other values found in the literature. It can be seen that the system produces results as expected.
Plotting the light curve of all those meteors allows us to de-termine the so-calledF factor (i.e. the position of the bright-ness peak relative to the length of the meteor). AnF factor of 0 corresponds to a peak at the beginning of the meteor, an F factor of 1 at the end of the meteor (Fleming et al., 1993; Beech and Murray, 2003). This value can indicate the strength of the meteoroid. A late-peaked light curve (high
Fig. 10.F factor of all sporadics and all Geminids observed in the nights from 13 to 15 December 2012. The average value for the sporadics.
F values) would correspond to high-strength material; an early-peaked light curve indicates a very fragile particle.
To obtain theF factor, we use the sum images showing the complete meteor. The position of the meteor in the image is known from the *.inf file recorded by the detection software. A semi-automated software cuts out a 10-pixel-wide stripe around the meteor image. After subtraction of a background area around the meteor, the pixel values perpendicular to the direction of flight are summed up. The beginning and end point of the meteor are defined as those positions where the meteor flux is 25 % of the peak flux. The software presents the results graphically to a user who has to inspect the cor-rectness of the result visually and accept it.
In Fig. 10 we plot a histogram showing the distribution of the F factor for all Geminids and all sporadic meteors observed during the three nights of 13–15 December 2011. We find a mean value for the Geminids of 0.53±0.14, which is consistent with, for example, Koten et al. (2004), who find a value of 0.58±0.02. A more detailed interpretation of the obtainedF factor is beyond the scope of this paper.
5 Summary and lessons learnt
This paper describes the technical aspects of a double-station meteor camera set-up in the Canary Islands. It has been oper-ational for about 2 yr now, and some preliminary results have been presented.
To illustrate the capabilities of the set-up, we analysed three nights of observations from 13 to 15 December 2011 during the Geminid meteor stream. We have obtained 51 Geminid orbits, and the orbital parameters are consistent with other literature (Toth et al., 2011). From the light curve, we measured the F factor (Fleming et al., 1993) to be 0.53±0.14, consistent with, for example, Koten et al. (2004), who find a value of 0.58±0.02.
The following lessons learnt are worth mentioning: a. The reliability of the set-up could still be improved.
Table 4. Orbits of the 51 Geminid meteors as obtained by the CILBO system in the nights 13–15 December 2011. The average values
are compared to other authors and the orbital elements of the parent body (3200) Phaethon.a: semi-major axis in AU;e: eccentricity; i: inclination in degrees;q: pericentre distance in AU;ω: argument of pericentre in degrees;: longitude of ascending node in degrees.
a e i q ω
001: 1.070 0.846 21.0 0.165 324.7 261.4
002: 1.319 0.897 22.6 0.136 325.3 262.3
003: 1.378 0.892 22.0 0.149 323.1 261.4
004: 1.367 0.896 23.4 0.142 324.2 261.4
005: 1.276 0.887 22.6 0.144 324.7 262.5
006: 1.156 0.868 20.2 0.153 324.9 262.4
007: 1.229 0.878 21.5 0.150 324.4 261.4
008: 1.168 0.872 21.4 0.150 325.1 262.4
009: 1.237 0.881 22.1 0.148 324.6 262.5
010: 1.288 0.890 22.4 0.141 324.9 262.3
011: 1.213 0.876 21.3 0.151 324.5 261.7
012: 1.327 0.881 22.9 0.158 322.5 262.4
013: 1.206 0.879 21.0 0.146 325.2 262.4
014: 1.243 0.881 21.9 0.148 324.5 262.4
015: 1.174 0.872 20.8 0.150 325.1 262.4
016: 1.313 0.896 23.6 0.137 325.3 261.5
017: 1.472 0.912 24.1 0.129 325.3 262.4
018: 1.128 0.864 19.9 0.153 325.2 261.7
019: 1.291 0.886 22.0 0.147 324.1 262.4
020: 1.415 0.898 23.8 0.144 323.5 261.7
021: 1.213 0.877 21.1 0.149 324.6 261.7
022: 1.437 0.901 24.3 0.143 323.5 262.4
023: 1.586 0.920 25.8 0.127 324.9 261.7
024: 1.534 0.910 22.7 0.138 323.5 261.7
025: 1.216 0.878 20.2 0.148 324.8 261.7
026: 1.150 0.867 20.5 0.153 324.9 262.4
027: 1.191 0.872 22.1 0.152 324.6 261.4
028: 1.211 0.874 21.8 0.153 324.2 261.6
029: 1.221 0.887 22.5 0.138 326.0 262.3
030: 1.330 0.882 20.2 0.157 322.5 262.5
031: 1.221 0.872 21.3 0.156 323.8 261.6
032: 1.185 0.876 22.3 0.147 325.3 262.5
033: 1.209 0.876 21.5 0.150 324.6 261.4
034: 1.255 0.885 21.9 0.144 324.9 261.7
035: 1.291 0.886 20.5 0.147 324.1 261.7
036: 1.198 0.880 21.9 0.144 325.5 262.4
037: 1.348 0.892 24.1 0.146 323.8 261.4
038: 1.273 0.894 24.4 0.135 325.9 261.7
039: 1.219 0.878 22.6 0.148 324.7 261.4
040: 1.158 0.872 22.5 0.149 325.4 261.7
041: 1.222 0.878 21.5 0.149 324.6 262.4
042: 1.200 0.881 22.3 0.143 325.6 262.4
043: 1.484 0.916 25.8 0.125 325.8 261.4
044: 1.294 0.889 22.4 0.144 324.6 261.7
045: 1.278 0.883 22.1 0.150 323.9 261.6
046: 1.209 0.876 20.7 0.150 324.6 262.4
047: 1.396 0.897 22.5 0.144 323.7 261.4
048: 1.262 0.885 22.8 0.146 324.6 261.6
049: 1.316 0.889 23.0 0.146 324.1 261.6
050: 1.270 0.886 21.6 0.145 324.7 262.5
051: 1.255 0.879 22.5 0.151 324.0 261.4
Mean, this work 51 orbits
1.273±0.103 0.884±0.013 22.2±1.3 0.146±0.007 324.6±0.77 261.9±0.43
Toth et al. (2011) 10 orbits
1.268±0.048 0.883±0.008 21.8±1.28 0.148±0.007 324.3±0.76 261.6±0.09
SonotaCo (Toth et al., 2011) 121 orbits
1.279±0.075 0.884±0.017 22.7±2.49 0.149±0.014 324.0±1.45 261.7±0.08
We suspect issues with the end switches. It seems to be difficult to build up a robust autonomous system with commercial elements. Still, the set-up has survived the extreme weather of the Canary Islands in > 2000 m al-titude – extended frost and ice periods in winter and storms with wind speeds above 120 km h−1.
b. The cameras seem to be sagging continuously, possi-bly because of the weight of the cables at the back end of the camera. This requires regular use of the “Ref-Stars” programme to re-establish the pointing direc-tion of the camera. Relieving strain on the cables could solve this issue. The slight shift in the field of view can be corrected by using the capability of the “PostProc” software of the MetRec suite to recompute the precise position of the camera. This would result in the highest precision astrometry of the measured meteors. c. Using a roll-off roof for housing just one camera may
be overkill. Possibly a compact camera housing with a mechanical protection shutter in front of the lens may have been enough. The roof, however, gives us the flexibility to add more camera systems with little additional effort.
Acknowledgements. We acknowledge the work of the laboratory
of ESA’s Scientific and Robotic Exploration Directorate, SRE-F, in particular the following: R. Westera, who did most of the me-chanical design; the RSSD workshop, which built the meme-chanical parts; B. Butler, who supported the electronic work; and Klok Vac-uumservice, who built the additional control electronics. Funding was made available by the research budget of the Research and Scientific Support Department. We also acknowledge the support of J. Rey from the Instituto Astronómico de Canarias. Thanks to J. Vaubaillon and an anonymous referee for their valuable comments.
Edited by: G. Kargl
References
Baggaley, W. J., Bennett, R. G. T., Steel, D. I., and Taylor, A. D.: The Advanced Meteor Orbit Radar facility AMOR, Q. J. Roy. Astron. Soc., 35, 293–320, 1994.
Barentsen, G., Arlt, R., Koschny, D., Atreya, P., Flohrer, J., Jopek, T., Knofel, A., Koten, P., Mc Auliffe, J., Oberst, J., Toth, J., Vaubaillon, J., Weryk, R., Wisniewski, M., and Zo-ladek, P.: The VMO file format. I. Reduced camera meteor and orbit data, WGN, the Journal of the IMO, 38, 1–24, 2010. Beech, M. and Murray, I. S.: Leonid meteor light-curve synthesis,
Mon. Not. R. Astron. Soc., 345, 696–704, 2003.
Campbell-Brown, M. D. and Jones, J.: Annual variation of sporadic radar meteor rates, Mon. Not. R. Astron. Soc., 367, 709–716, 2006.
Fleming, D. E. B., Hawkes, R. L., and Jones, J.: Light curves of faint television meteors, in: Meteoroids and their parent bodies, Astro-nomical Inst., Slovak Acad. Sci., Bratislava, 261–264, 1993. Grün, E., Zook, H. A., Fechtig, H., and Giese, R. H.: Collisional
balance of the meteoritic complex, Icarus, 62, 244–272, 1985. Koschny, D.: PosDat – The positional meteor database of the IMO,
WGN, the Journal of the IMO, 20, 136–139, 1992.
Koschny, D. and Diaz del Rio, J.: Meteor Orbit and Trajectory Soft-ware (MOTS) – Determining the position of a meteor with re-spect to the Earth using data collected with the software MetRec, WGN, the Journal of the IMO, 30, 87–101, 2002.
Koten, P., Borovicka, J., Spurny, P., Betlem, H., and Evans, S.: At-mospheric trajectories and light curves of meteors, Astron. As-trophys., 428, 683–690, 2004.
Krüger, H., Landgraf, M., Altobelli, N., and Grün, E.: Interstellar dust in the solar system, Space Sci. Rev., 130, 401–408, 2007. Levasseur-Regourd, A. C., Mann, I., Dumont, R., and Hanner, M.
S.: Optical and thermal properties of interplanetary dust, in: In-terplanetary Dust, edited by: Grün, E., Gustafson, B. A. S., Der-mott, S. F., and Fechtig, H., 57–94, Springer Verlag, Berlin Hei-delberg, New York, 2001.
Molau, S.: The Meteor Detection Software MetRec, in: Proceed-ings of the International Meteor Conference, Stara Lesna 20–23 August 1998, edited by: Arlt, R. and Knoefel, A., International Meteor Organization, ISBN: 2-87355-010-4, 9–16, 1999. Pyo, J., Hong, S. S., Kwon, S. M., Ueno, M., Ishiguro, M., Usui, F.,
Ootsubo, T., Ishihara, D., and Mukai, T.: The zodiacal dust cloud revealed by the AKARI IRC All-Sky Survey, in: AKARI, a light to illuminate the misty universe, Vol. 418 of the Astronomical Society of the Pacific Conference Series, edited by: Onaka, T., White, G. J., Nakagawa, T., and Yamamura, I., 39–44, 2009. Toth, J., Veres, P., Kornos, L., Piffl, R., Koukai, J., Gajdos, S.,