ORIGINAL RESEARCH PAPER .
Gas Mixing Simulation in a T-Shape Micro Channel Using The DSMC
Method
S.M. Hosseinalipour1,*, E. Jabbari1, M. Madadelahi1, A. Fardad1
1Mechanical Engineering Department, Iran University of Science & Technology, Narmak, Tehran, I.R. Iran
1. Introduction
….The study of gas or liquid flows in micro systems is developing very rapidly as they have many applications in various fields. Because of their small size, they can be produced in very great numbers and low manufacturing cost. In addition, their miniaturized size enables them to respond quickly to excitations of actuators [1]. Gas mixing is a basic problem for the design of propulsion devices in Power-MEMS and in a variety of these devices, the inside mixing process determines the efficiency of the whole system [2,4]. For these reasons, the study of the gas mixing and the identification of the factors which
*
Corresponding author
Email address: [email protected]
reduce the mixing length in a micro channel, has been intensely studied [2,4]. In micro channels, the continuum assumption is not valid anymore because the Knudsen number is not very small. Therefore these flows are usually analyzed with kinetic methods, for instance the Direct Simulation Monte Carlo Method (DSMC).
Wang and Li developed a generalized Enskog Monte Carlo method by introducing a generalized molecular collision model for Lennard-Jones potential and the corresponding internal energy exchange model into the Monte Carlo method for the correct modeling and predictions of high Knudsen number non-ideal gas flow and heat transfer. The generalized collision model considers both repulsive and attractive forces between molecules and the density effect, so that the gas equation of state extends from the Clapeyron
ARTICLE INFO.
Article history
Received 3 February 2014 Accepted 27 June 2014
Keywords DSMC Method Rapid Mixing
Rarefied Gas Mixing T-Shape Micro Channel
Abstract
Gas mixing in a T-shape micro mixer has been simulated using the Direct Simulation Monte Carlo (DSMC) method. It is considered that the adequate mixing occurs when the mass composition of the species, CO or N2, deviates below 1 % from their equilibrium composition.
The mixing coefficient is defined as the ratio of the mixing length to the main channel’s height. As the inlet Kn increases, while the diffusion of the molecules behaves more active, the mixing coefficient decreases. Furthermore, increasing the inlet pressure will cause the mixing length to increase, since the convection effect of the gas stream is more pronounced compared with the diffusion effect. Increasing the gas flow temperature or the wall temperature can enhance the mixing performance, while the effect of increasing the wall temperature is more significant. Walls with diffuse reflectors show more enhancement in mixing coefficient compared with the specular reflectors.
133
NomenclatureGreek Symbols
m
molecular mass, kgmol-1
mixing performance, 1h main channel height, m
composition deviation coefficient, 1L
mixing length, m Subscripts
w
Mass fraction of species, 1 mix mixture
equation to the van der Waals equation. The GEMC method was validated by comparing the gas transport properties with existing experimental data and by comparing numerical results with DSMC at low gas densities. The GEMC method was then used for simulations and analyses of non-ideal gas flows in micro and nano channels. The results show that the high gas density influences the flow behavior and heat transfer deviating from the predictions by the DSMC method. The denseness makes the surface friction coefficient on the wall lower than that based on the perfect assumption[3].
Yan and Farouk simulated the gas mixing process in micro channels using the DSMC method [5]. They investigated the mixing of the H2 and O2 parallel gas
streams which were driven by inlet-outlet pressure differences, and separated by a splitter plate in a micro channel. In their work, the gases were considered as mixed when the mass density contours were symmetric with respect to the centerline of the channel. They showed that the mixing length increases with the increasing of the inlet-outlet pressure difference. Furthermore, the mixing process was very sensitive to the wall boundary condition. It was shown that the mixing length is shorter in the case with fully diffuse reflection than in the case with the specular reflection [2,4]. Wang and Li, simulated the mixing process of CO and N2 in a micro channel [2,
5]. In their study, the gases were considered to be mixed when the gas mixture density near the upper and lower walls was equal. In their work, it was emphasized that the main flow velocity and the temperature are the most important factors affecting the gas mixing performance.
Le and Hassan studied the gas mixing by considering CO and N2 in a T-shape micro mixer with
the inlet-outlet pressure boundary condition when the internal channel flow is driven by the pressure gradient [4]. They showed that increasing Knudsen number decreases the mixing length and enhances the mixing process. In the present paper, the mixing of two parallel gas streams of CO and N2 with the same
inlet boundary conditions (for the velocity, the
pressure and the temperature) is analyzed by DSMC method (Figure 1). The main purpose is to obtain the numerical references which could be compared with the results by Le and Hassan [4].The mixing process can be affected by many factors, such as Kn number, inlet pressure, stream temperature, and wall temperature. This will be discussed in the following sections.
Fig.1. Schematic of the T-Shape microchannel
geometry.
2. Numerical modeling and boundary
conditions
134
flow field is subdivided in several cells which their characteristic dimensions are smaller or equal to the mean free path of the molecules. The macroscopic quantities are evaluated in these cells. The mean free path depends on the characteristics of the mixture.
There are various models of collision but the most common ones in DSMC, are VHS (Variable Hardware Sphere) and VSS (Variable Software Sphere) models [7], which are based on “Inverse Power Law (IPL)” model. In these models the cross section of collision depends only on the relative velocity of the two colliding molecules. Moreover, they provide easier use of realistic viscosity power laws and calculation of the collisions. To study a mixture, it is preferable to use VSS model [7].
A developed version of bird code for T shape micro channel geometry is used in this study [6]. This code is based on the DSMC method which allows simulating the solution of the Boltzmann equation and obtaining a reference solution for the transition regime [7].
Figure 2 shows the T-shape microchannel with two inlets along the vertical axis and one outlet along the horizontal axis. The widths of the two inlets are both equal to l and the height of the outlet is h. The computational domain was established as shown in Fig.2. CO and N2 are selected as the operating species
in order to avoid the density effect on the mixing since those two gases have the same molecular mass, mCO =
mN2 =4.65×10⁻²⁶ kg.
Fig.2. Boundary condition for the T-Shape micro
channel.
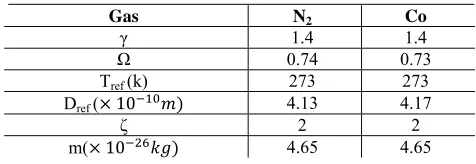
Table 1 shows the molecular parameters of two species. The two gas streams enter the T junction from the upper and lower inlet, and leave the main channel exit after being fully mixed. The pressure at the two inlets is set at the same value, which is near the
atmospheric pressure for most of the cases. The outlet pressure for all cases is maintained low enough to prevent the backflow and thus enhancement in the mixing process.
Table 1
Molecular parameters
Co N2
Gas
1.4 1.4
γ
0.73 0.74
Ω
273 273
Tref (k)
4.17 4.13
Dref (× 10 )
2 2
ζ
4.65 4.65
m(× 10 )
3. Results and discussion
3.1. Characterization of the mixing process
Considering a T-shape microchannel with the inlet channel width l=1μm, the whole length of the channel L = 8μm, the height H = 2.8μm, and the main channel height h=1.4μm. The two opposing stream temperatures are equal to the wall temperature, Tin =
Tw = 300 K. The inlet pressure is 0.1 MPa and, with a
low outlet pressure, no back-flow can be obtained downstream the outlet plane. Figure 3 shows the velocity vectors for the T-shape microchannel flow. The two gaseous flows which come from the inlets, start to merge within the T junction. In the main channel flow is accelerated due to the pressure difference between inlet and outlet, and the stream-wise velocity has a parabolic profile at each cross section as expected. Moreover, the velocity slip near the wall caused by the rarefaction effect can be observed.
Fig.3. Velocity vectors for the gas mixture of CO and N2 in the T Shape micro channel.
135
appeared symmetric about the channel centerline, and therefore the mixing length was determined [5]. In fact, the mixing length determined by this way, may cause large errors because it somehow relies on one's sense and vision. In the present work, the idea presented by Gobby et al. is used to judge the mixing process [8]. In this way, complete mixing is developed when the equilibrium composition is reached. In order to quantitatively evaluate the mixing process, it is defined that complete mixing can be achieved when the composition of each species deviates below 1 % from its equilibrium composition for all locations in a cross section. In other words, gas mixing is considered complete when:
100 100
) i ( ) y ,i ( ) y ,i ( ) i ( ) i
(
(1)
Where w∞(i) represents the equilibrium mass fraction for species i (i = 1,2) and w(i,y) represents the
mass fraction for species i at location y in a cross section. Similarly, the development of the gases mixing can be also judged by defining the composition deviation coefficient as:
ξ
=max(
) i (
| ) i ( ) y ,i ( |
)
(2)
The composition deviation coefficient should decrease asymptotically to zero along the main channel and the critical value set to judge whether the two gases are fully mixed is equal to ±1% as mentioned before. In the present study, only the composition deviation coefficient of CO along the channel is examined since the N2 gas stream must
behave the same manner as CO due to the conservation of mass. Figure 4 shows the density contour for N2 in the T micro mixer. The CO gas
stream enters from the upper inlet while the N2 gas
stream enters from the lower inlet.
As a result, it is reasonable to get the mass fraction of N2 in the down half of the channel higher than that
in the upper half of the channel. Based on the previous definition, the evolution of the composition deviation coefficient along the main channel for CO is calculated.
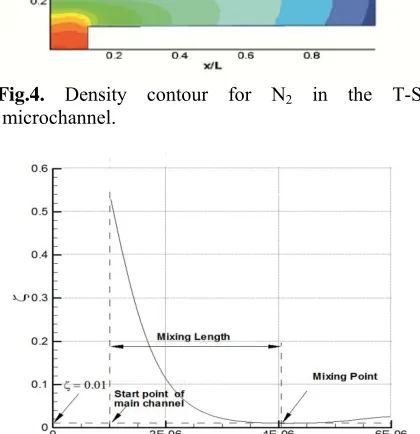
Figure 5 indicates the determination of the mixing length Lmix from the simulation results.
Fig.4. Density contour for N2 in the T-Shape microchannel.
Fig.5. Evolution of composition deviation coefficient
along the main channel.
The composition deviation coefficient decreases asymptotically to 0 along the main channel as was expected before. The mixing point is picked out where the composition deviation coefficient is equal to 0.01. Then, the mixing length, Lmix can be defined as the
distance between the starting point of the main channel and the mixing point.
3.2. Benchmark testing of current work
Figure 6 depicts the comparison between the effect of inlet pressure on dimensionless mixing length in the present study and what is reported by Hassan et al. [4].
136
Fig.6. inlet pressure effect in the current study and
Hassan et al. [3]
Fig.7. composition deviation coefficient in the current
study and Hassan et al. [3]
3.3. Effect of channel geometry and Kn
The effect of the channel geometry on mixing process was investigated by changing the size of the T shape channel, while the inlet Kn wasn't maintained by means of the adjusted inlet pressure. Figure 8 shows the evolution of the composition deviation coefficient along the main channel for the cases with a fixed scale of geometry.
Fig.8. Effect of inlet-outlet width ratio of the channel on
the mixing coefficient.
For the cases with the inlet channel width equal to 0.8μm and 1.2μm, the combination of the two gas streams develops similarly along the main channel and the complete gas mixing doesn't happen at the same portion of the main channel length.
It can be observed that the channel geometry may have some effect on the mixing process even though the inlet Kn is fixed. Inspired by the fact that the channel geometry may have some effects on mixing, the Kn effect was investigated in the scale-fixed mixers, and also in those with the same main channel height. It should be emphasized that the Kn mentioned here all correspond to N2
The dimensionless mixing coefficient defined in Wang and Li's work was also adopted here to estimate the mixing performance, which is calculated by: [2]
h Lmix mix
(3)
Where Lmix, was defined as the mixing length, and
h is the main channel height. Figure 9 depicts the variation of the mixing coefficient as a function of the inlet Kn corresponding to the mentioned two configurations. It can be observed that as the inlet Kn increases the mixing coefficient always decreases. Furthermore, the Kn affects the mixing coefficient more significantly while the micro mixer is shrunk under a certain scale.
Fig.9. Effect of the Kn on mixing coefficient.
137
rarefied conditions differs considerably from that in the continuum flow model and is expected to be primarily counted in the design of the micro gas mixers.
3.4. Effects of inlet pressure, stream temperature
and wall temperature
.Calculations were repeated by changing the inlet pressures while the outlet pressure was maintained lower enough to prevent the backflow. Nine cases were carried out with the inlet pressure values of 100, 125, 150, 175, 200, 225, 250, 275 and 300 kPa. The variation of Lmix/L, versus the inlet pressure is shown
in Figure 10. It can be seen that the mixing length increases monotonically with the increasing inlet pressure. As the inlet pressure increases, the Kn value decreases at the channel inlet and within the rest of the T shape microchannel as well. Thus, the diffusion effect in the micro T-junction becomes less efficient. In addition, the increment of the inlet pressure also speeds up the flow velocity, which makes the convection effect of the gas stream more pronounced compared with the diffusion effect of the molecules. Therefore, it takes longer for the higher inlet pressure cases to achieve the complete gas mixing.
Fig.10. Effect of the inlet pressure on the mixing
coefficient.
The effect of the stream temperature was investigated by varying the inlet gas temperature from 300 K to 450 K while the wall temperature was kept at 300 K. Figure 11 shows decrease of mixing length with the increase of gas stream temperature.
This can also be explained by the molecular diffusion characteristic within the T-junction. High gas temperature makes the molecular motion more active because the thermal velocity of a molecule is proportional to the gas temperature.
Fig.11. Effect of the stream temperature on the mixing
coefficient.
As a result, the diffusion effect turns to be more significant thus enhancing the mixing process.
On the other hand, when the incoming gas stream temperature was kept at 300 K while the wall temperature was set at 300, 350,400 and 450 K, a similar trend was obtained as shown in Figure 12; high wall temperature leads to a shorter mixing length. It can be concluded that the mixing process is more sensitive to the wall temperature rather than the stream temperature. Because when the temperature of the incoming flow is different from that of the wall, the flow temperature can adjust to be equal to the wall temperature very fast at the entrance region of the microchannel. Therefore, increasing the wall temperature can effectively increase the gas flow temperature along the whole channel thus accelerates the mixing process.
Fig.12. Effect of the wall temperature on the mixing
coefficient.
3.5. Effects of wall’s condition on mixing length
The effect of the wall temperature was investigated by varying the wall temperature from 300 K to 450 K in 2 cases as shown in Figure13.
138
Fig.13. Effect of the wall condition on the mixing
coefficient
It shows that diffuse wall makes the molecular motion more active because the thermal velocity of a molecule is proportional to the gas temperature. As a result, the diffusion effect turns to be more significant thus enhancing the mixing process.
4. Conclusion
The mixing process of two gas species, CO and N2, within the T shape microchannel was simulated.
The outlet pressure was chosen to be lower enough to prevent the backflow in order to speed up the mixing process and enhancing the mixing performance. The following conclusions are drawn:
1-When the Kn increases, the mixing coefficient decreases, indicating an enhanced mixing process. This type of mixing behavior can only be observed in micro scale, which is quite different from those being predicted in the macro scale. The two investigated gas streams started to mix within the T junction before entering the main channel due to the diffusion effect of the rarefied flows.
2-the mixing length increases with the increasing inlet pressure, which speeds up the flow velocity thus making the convection effect of the gas stream more pronounced compared with the diffusion effect.
3-Increasing the gas flow temperature or the wall temperature can both lead to an enhanced mixing process, while the effect of the wall temperature is more significant.
4-Diffuse walls lead to enhanced mixing process in compassion with specular walls.
References
[1] R. Bacon, Growth, Structure, and Properties of Graphite Whiskers, Appl. Phys. Lett. 31(2) (1960) 283-290.
[2] A. Oberlin, M. Endo, T. Koyama, Filamentous growth of carbon through benzene decomposition, J. Crystal Growth 32 (3) (1976) 335-349.
[3] S. Iijima, Helical microtubules of graphitic carbon, Nature 354 (1991) 56-58.
[4] Y.X. Liang, T.H. Wang, A double-walled carbon nanotube field-effect transistor using the inner shell as its gate, Physica E 23 (2004) 232-236.
[5] C. Klinke, A. Afzali, Interaction of solid organic acids with carbon nanotube field effect transistors, Chemical Physics Letters 430 (2006) 75-79.
[6] T.W. Odom, J.L. Huang, P. Kim, C.M. Lieber, Atomic structure and electronic properties of single-walled carbon nanotubes Nature 391(1998) 62–64.
[7] M.M.J. Treacy, T.W. Ebbesen, J.M. Gibson, Exceptionally high Young's modulus observed for individual carbon nanotubes, Nature 381 (1996) 678-680.
[8] S.J. Tans, R.M. Verschueren, C. Dekker, Room-temperature transistor based on a single carbon nanotube, Nature 393 (1998) 49-52.
[9] J.M. Bonard, M. Croci, C. Klinke, R. Kurt, O. Noury, N. Weiss, Carbon nanotube films as electron field emitters, Carbon 40 (2002) 1715-1728.
[10] J. Suehiro, G. Zhou, H. Imakiire, W. Ding, M. Hara, Controlled fabrication of carbon nanotube
NO2 gas sensor using dielectrophoretic
impedance measurement, Sensors and Actuators B 108 (2005) 398-403.
[11] A. Thess et al., Crystalline Ropes of Metallic Carbon Nanotubes, Science 273, (1996), 483-487.
[12] R. Andrews, D. Jacques, A. M. Roa, F. Derbyshire, D. Qian, X. Fan, E. C. Dickey and J. Chen, `Continuous Production of Aligned Nanotubes: a Step Closer to Commercial Realization’, Chem. Phys. Lett. 303 (1999) 467-474.
139
by catalytic chemical vapor deposition of acetylene over Fe-Mo/MgO catalyst, Chemical Physics Letters 383 (2004) 104-108.
[14] Y.S. Cho, G. Seok Choi, G. S. Hong, D. Kim, Carbon nanotube synthesis using a magnetic fluid via thermal chemical vapor deposition , Journal of Crystal Growth, 243 (2002) 224-229.
[15] W. W. Liu, A. Aziz, S.P. Chai, A.R. Mohamed, Tye Ching-Thian, The effect of carbon precursors (methane, benzene and camphor) on the quality of carbon nanotubes synthesized by the chemical vapour decomposition, Physica E 43 (2011) 1535-1542.
[16] A. C. Lysaght, W. K. S. Chiu, Modeling of the carbon nanotube chemical vapor deposition process using methane and acetylene precursor gases Nanotechnology,19(16) (2008) 165607-165614.
[17] L. Pan, Y. Nakayama, H. Ma, Modelling the growth of carbon nanotubes produced by chemical vapor deposition, Carbon 49 (2011) 854-861.
[18] B. Zahed, T. Fanaei S., H. Ateshi, Numerical analysis of inlet gas-mixture flow rate effects on carbon nanotube growth rate, Transport Phenomena in Nano and Micro Scales 1 (2013) 38-45 .
[19] B. Zahed, T. Fanaei S., A.Behzadmehr, H. Atashi, Numerical Study of Furnace Temperature and Inlet Hydrocarbon Concentration Effect on Carbon Nanotube Growth Rate, International J. of Bio-inorganic hybrid nanomaterials 2(1) (2013) 329-336 [20] M. Grujicic, G. Cao, B. Gersten, Reactor
length-scale modeling of chemical vapor deposition of carbon nanotubes, J. Mater. Sci. 38(8) (2003) 1819–30.
[21] H. Endo, K. Kuwana, K. Saito, D. Qian, R.
Andrews, E.A. Grulke, CFD prediction of
carbon nanotube production rate in a CVD reactor, Chem.Phys. Lett. 387 (2004) 307–311. [22] K. Kuwana, K. Saito, Modeling CVD synthesis
of carbon nanotubes: nanoparticle formation from ferrocene, Carbon 43(10) (2005) 2088– 95.
[23] A.A. Puretzky, D.B. Geohegan, S. Jesse, I.N. Ivanov, G. Eres, In situ measurements and modeling of carbon nanotube array growth kinetics during chemical vapor deposition, Appl. Phys. A 81(2) (2005) 223–40.
[24] Chris R. Kleijn, C. Werner, Modeling of chemical vapor deposition of tungsten films, Vol 2, Birkhauser, Berlin, 1993.