www.biogeosciences.net/12/6301/2015/ doi:10.5194/bg-12-6301-2015
© Author(s) 2015. CC Attribution 3.0 License.
Permafrost coverage, watershed area and season control of dissolved
carbon and major elements in western Siberian rivers
O. S. Pokrovsky1, R. M. Manasypov2,3, S. Loiko2, L. S. Shirokova1,3, I. A. Krickov2, B. G. Pokrovsky4, L. G. Kolesnichenko2, S. G. Kopysov2, V. A. Zemtzov2, S. P. Kulizhsky2, S. N. Vorobyev2, and S. N. Kirpotin2
1GET UMR 5563 CNRS, University of Toulouse, 14 Avenue Edouard Belin, 31400 Toulouse, France 2BIO-GEO-CLIM Laboratory, Tomsk State University, Lenina av., 36, Tomsk, Russia
3Institute of Ecological Problem of the North, 23 Nab Severnoi Dviny, RAS, Arkhangelsk, Russia 4Geological Institute, Russian Academy of Science, Pyzhevskiy per., 7c1, Moscow, Russia
Correspondence to: O. S. Pokrovsky ([email protected])
Received: 1 June 2015 – Published in Biogeosciences Discuss.: 9 July 2015
Revised: 17 October 2015 – Accepted: 20 October 2015 – Published: 5 November 2015
Abstract. Analysis of organic and inorganic carbon (DOC
and DIC, respectively), pH, Na, K, Ca, Mg, Cl, SO4and Si in∼100 large and small rivers (<10 to≤150 000 km2) of western Siberia sampled in winter, spring, and summer over a more than 1500 km latitudinal gradient allowed establish-ing main environmental factors controllestablish-ing the transport of river dissolved components in this environmentally impor-tant region, comprising continuous, discontinuous, sporadic and permafrost-free zones. There was a significant latitudi-nal trend consisting in a general decrease in DOC, DIC, SO4, and major cation (Ca, Mg, Na, K) concentration northward, reflecting the interplay between groundwater feeding (de-tectable mostly in the permafrost-free zone, south of 60◦N) and surface flux (in the permafrost-bearing zone). The north-ward decrease in concentration of inorganic components was strongly pronounced both in winter and spring, whereas for DOC, the trend of concentration decrease with latitude was absent in winter, and less pronounced in spring flood than in summer baseflow. The most significant decrease in K con-centration from the southern (<59◦N) to the northern (61– 67◦N) watersheds occurs in spring, during intense plant lit-ter leaching. The latitudinal trends persisted for all river wa-tershed size, from <100 to >10 000 km2. Environmental factors are ranked by their increasing effect on DOC, DIC, δ13CDIC, and major elements in western Siberian rivers as follows: watershed area<season<latitude. Because the de-gree of the groundwater feeding is different between large and small rivers, we hypothesize that, in addition to ground-water feeding of the river, there was a significant role of
surface and shallow subsurface flow linked to plant litter degradation and peat leaching. We suggest that plant-litter-and topsoil-derived DOC adsorbs on clay mineral horizons in the southern, permafrost-free and discontinuous/sporadic permafrost zone but lacks the interaction with minerals in the continuous permafrost zone. It can be anticipated that, under climate warming in western Siberia, the maximal change will occur in small (<1000 km2watershed) rivers DOC, DIC and ionic composition and this change will be mostly pronounced in summer.
1 Introduction
zone (Gordeev et al., 1996, 2004; Moran and Woods, 1997; Lobbes et al., 2000; Dittmar and Kattner, 2003; Gebhardt et al., 2004; Cooper et al., 2008; Nikanorov et al., 2010a, b; Holmes et al., 2000, 2001, 2012; Pokrovsky et al., 2010; Feng et al., 2013). While these studies have allowed for the quantification of the carbon and major element delivery fluxes from the continent to the Arctic Ocean, the mecha-nisms responsible for carbon and metals mobilization from the soil/groundwater to the rivers remain very poorly under-stood. The WSL offers a unique site to test various hypothe-ses of element sources and to reveal related mechanisms as it presents the full gradient of the permafrost coverage, cli-mate and vegetation over homogeneous sedimentary base-ment rock, essentially peat soil, flat orography and similar annual precipitation. Taking advantage of these features, in their pioneering studies, Frey et al. (2007a, b) and Frey and Smith (2005) provided a first-order assessment of the rela-tive contributions of shallow surface water and deep ground-water to small western Siberian rivers. Their study was conducted during the summer baseflow season, presenting the largest contrast between free and permafrost-affected rivers. This allowed them to conclude that climate warming should shift the permafrost-affected part of the re-gion from surface feeding to groundwater feeding, while the permafrost-free zone may remain unaffected.
However, unlike many regions of the world, the boreal and subarctic river regions exhibit extreme seasonal varia-tions in discharge and chemical elements concentravaria-tions (see Voronkov et al., 1966; Gordeev and Sidorov, 1993; Gordeev et al., 1996; Gislason et al., 1996; Gaillardet et al., 2003; Rember and Trefry, 2004; Zakharova et al., 2005, 2007; Bagard et al., 2011, 2013; Prokushkin et al., 2011; Guo et al., 2004b, 2007; Olefeldt and Roulet, 2012; Voss et al., 2015). The quantitative description of these systems, therefore, re-quires an understanding of how weathering rates and riverine fluxes of major and trace elements as well as their main car-rier (organic carbon) vary seasonally. High seasonality im-plies significant variations in the source of the elements in river flow over the year, which is further accentuated by high variability in the depth of the active layer and relevant con-tributions of mineral soil weathering and the leaching of the soil organic horizon. As such, the chemistry of fluxes on the seasonal scale depends on the relative role of mineral disso-lution vs. plant litter (organic soil) leaching. Although sev-eral recent studies have used isotopic techniques in an at-tempt to resolve the sources of elements in subarctic rivers (Engström et al., 2010; Keller et al., 2010; Pokrovsky et al., 2013a; Mavromatis et al., 2014), the relative contributions of mineral and plant litter/organic soil components remain poorly constrained, particularly for boreal watersheds.
The purpose of the present work is to improve our under-standing of western Siberian river transport of organic and in-organic carbon and major elements (Ca, Mg, K, Si) via study-ing numerous watersheds across the 1500 km latitudinal pro-file during three main hydrological seasons: winter baseflow,
2 Study site and methods
2.1 Geographical setting
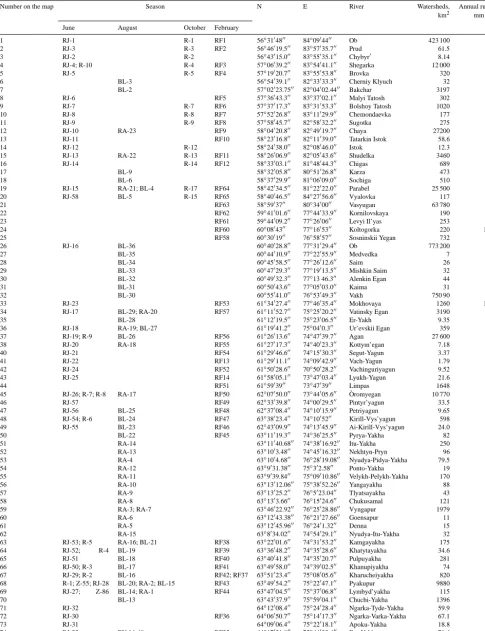
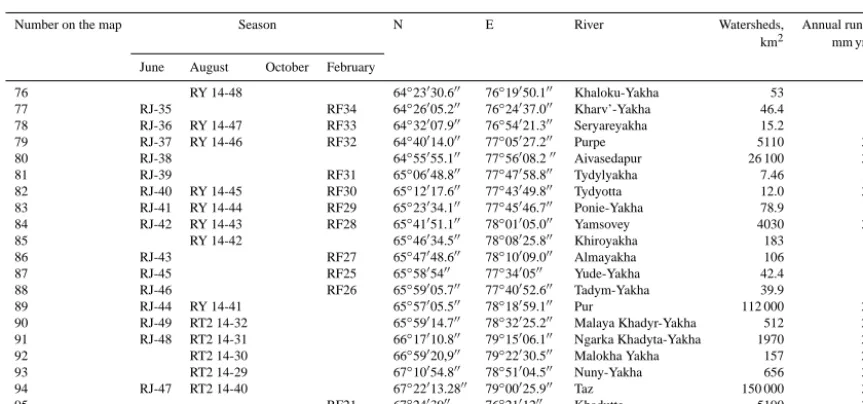
The Western Siberian Lowland (WSL) is the world second largest flooding territory, after the Amazon’s Varzea. The rivers (mainly the tributaries of the Ob, Pur, and Taz) drain Pleistocene sands and clays, covered by thick (1 to 3 m) peat and enclosing three main zones of the boreal biome – taiga, forest–tundra and tundra. Approximate coverage of studied territory by sand, peat and clay deposits in the first 3 m soil layer is shown in Fig. 1. Note that the peat is al-ways dominant on the watershed divides and bog zones, whereas the sand is abundant along the river valleys. Qua-ternary clays, sands, and silts ranging in thickness from sev-eral meters to 200–250 m have alluvial, lake-alluvial and, rarely, aeolian origin south of 60◦N and fluvio-glacial and lake-glacial origin north of 60◦N. The older (i.e., Paleogene and Neogene) rocks are rarely exposed on the surface and are represented by sands, alevrolites and clays, where car-bonate material is present as concretions of individual shells (Geological composition of the USSR, 1958). The climate is humid semi-continental with a mean annual temperature (MAT) ranging from −0.5◦C in the south (Tomsk region) to −9.5◦C in the north (Yamburg). The annual precipita-tion increases from 550 mm at the latitude of Tomsk to 650– 700 mm at Noyabrsk and further decreases to 600 mm at the lower reaches of the Taz River. The annual river runoff gradually increases northward, from 160–220 mm yr−1in the permafrost-free region to 280–320 mm yr−1 in the Pur and Taz river basins located in the discontinuous to continuous permafrost zone (Nikitin and Zemtsov, 1986). A detailed de-scription of physico-geography, hydrology, lithology and soil can be found in earlier works (Botch et al., 1995; Smith et al., 2004; Frey and Smith, 2005, 2007; Frey et al., 2007a, b; Beilman et al., 2009; Vorobyev et al., 2015) and in our re-cent limnological and pedological studies (Pokrovsky et al., 2013b; Shirokova et al., 2013; Manasypov et al., 2014, 2015; Stepanova et al., 2015). A detailed map of studied region to-gether with main permafrost provenances and river runoff in the WSL is given in Fig. 1, and the list of sampled rivers grouped by watershed size and season is presented in Table 1. Permafrost zonation in the WSL shown in this figure is based on extensive geocryological work in this region (Baulin et al., 1967; Gruzdov and Trofimov, 1980; Baulin, 1985; Liss et al., 2001). The hydrological parameters of the WSL rivers are described in Supplement S1.
2.2 Chemical and isotope analyses and statistical treatment
Altogether, 95 river samples were collected in early June 2013 (spring flood), August 2013 and 2014 (summer baseflow), October 2013 (autumn) and February 2014 (win-ter baseflow) along the 1500 km latitudinal gradient
(Ta-ble 1). All sampled rivers of the WSL belong to the Kara Sea basin. Seasonal sampling covered a full gradient from south to north, except the month of October, which was sampled only in rivers south of 60◦N (12 rivers in total). The water-shed area of sampled rivers ranged from 2 to 150 000 km2, not considering the Ob River in its medium course zone. Collected water samples were immediately filtered in pre-washed 30 mL PP Nalgene®flasks through single-use Min-isart filter units (Sartorius, acetate cellulose filter) with a diameter of 25 mm and a pore size of 0.45 µm. The first 20 to 50 mL of filtrate was discarded. Filtered solutions for cation analyses were acidified (pH∼2) with ultrapure double-distilled HNO3and stored in pre-washed HDPE bot-tles. The preparation of bottles for sample storage was per-formed in a clean bench room (ISO A 10 000). Filtered sam-ples for DOC, DIC, UV280 nm absorbance and anions were stored in the refrigerator for a maximum of 3 weeks before the analyses. The effect of storage for DOC, DIC and opti-cal measurements in boreal waters was found to be within the uncertainty of analysis (Ilina et al., 2014). Blanks were performed to control the level of pollution induced by sam-pling and filtration. The DOC blanks of filtrate never ex-ceeded 0.1 mg L−1, which is quite low for the organic-rich river waters sampled in this study (i.e., 10–60 mg L−1DOC). pH was measured in the field using a combined electrode cal-ibrated against NIST buffer solutions (pH of 4.00 and 6.86 at 25◦C). The accuracy of pH measurements was±0.02 pH units. DOC and DIC were analyzed using a carbon total an-alyzer (Shimadzu TOC VSCN) with an uncertainty better than 3 %. Special calibration of the instrument for analysis of both form of dissolved carbon in organic-rich, DIC-poor waters was performed as described elsewhere (Prokushkin et al., 2011). Major anion (Cl, SO4) concentrations were measured by ion chromatography (HPLC, Dionex ICS 2000) with an uncertainty of 2 %. The UV absorbance at 280 nm is used as a proxy for aromatic C and source of DOM in the river water. It was measured using a 1 cm quartz cuvette in a CARY-50 UV–VIS spectrophotometer (Bruker, UK). Ma-jor cations (Ca, Mg, Na, K) and Si were determined with an ICP-MS Agilent ce 7500 with In and Re as internal stan-dards and three various external stanstan-dards, placed once per 10 samples of river water. Approximately 30 % of samples were analyzed for Ca, Mg and Na concentration using atomic absorption spectroscopy (flame) with an uncertainty of 2 %. Reasonable and non-systematic agreement (between 5 and 10 %) with the results of ICP MS analyses was achieved. Aqueous Si concentrations were also determined colorimet-rically (molybdate blue method) with an uncertainty of 1 % using a Technicon automated analyzer. The SLRS-5 (river-ine water reference material for trace metals certified by the National Research Council of Canada) was used to check the accuracy and reproducibility of each analysis (Yeghicheyan et al., 2014).
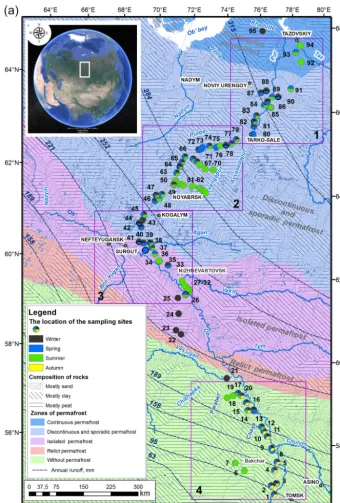
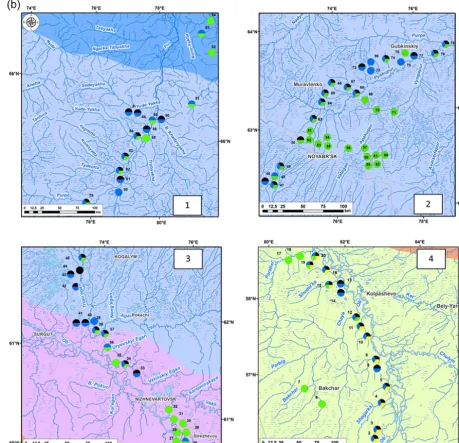
Table 1. List of sampled rivers, their watershed area and annual runoff. The codes under the months identify the sampling sites listed in
Table S1 in the Supplement. The annual runoff was calculated following the approach of Frey et al. (2007b) as explained in Supplement 1.
Number on the map Season N E River Watersheds, Annual runoff,
km2 mm yr−1
June August October February
1 RJ-1 R-1 RF1 56◦3104800 84◦0904400 Ob 423 100 207
2 RJ-3 R-3 RF2 56◦46019.500 83◦57035.700 Prud 61.5 44.8
3 RJ-2 R-2 56◦43015.000 83◦55035.100 Chybyr0 8.14 44.8
4 RJ-4; R-10 R-4 RF3 57◦06039.200 83◦54041.100 Shegarka 12 000 58.3
5 RJ-5 R-5 RF4 57◦19020.700 83◦55053.800 Brovka 320 63.4
6 BL-3 56◦54039.100 82◦33033.300 Cherniy Klyuch 32 168
7 BL-2 57◦02023.7500 82◦04002.4400 Bakchar 3197 96.1
8 RJ-6 RF5 57◦36043.300 83◦37002.100 Malyi Tatosh 302 63.4
9 RJ-7 R-7 RF6 57◦37017.300 83◦31053.300 Bolshoy Tatosh 1020 74.6
10 RJ-8 R-8 RF7 57◦52026.800 83◦11029.900 Chemondaevka 177 63.4
11 RJ-9 R-9 RF8 57◦58045.700 82◦58032.200 Sugotka 275 63.4
12 RJ-10 RA-23 RF9 58◦04020.800 82◦49019.700 Chaya 27200 95.6
13 RJ-11 RF10 58◦23016.800 82◦11039.000 Tatarkin Istok 58.6 33.4
14 RJ-12 R-12 58◦24038.000 82◦08046.000 Istok 12.3 127
15 RJ-13 RA-22 R-13 RF11 58◦26006.900 82◦05043.600 Shudelka 3460 211
16 RJ-14 R-14 RF12 58◦33003.100 81◦48044.300 Chigas 689 180
17 BL-9 58◦32005.800 80◦51026.800 Karza 473 148
18 BL-6 58◦37029.900 81◦06009.000 Sochiga 510 148
19 RJ-15 RA-21; BL-4 R-17 RF64 58◦42034.500 81◦22022.000 Parabel 25 500 131 20 RJ-58 BL-5 R-15 RF65 58◦40046.500 84◦27056.600 Vyalovka 117 127
21 RF63 58◦5903700 80◦3400000 Vasyugan 63 780 177
22 RF62 59◦41001.600 77◦44033.900 Kornilovskaya 190 133
23 RF61 59◦44009.200 77◦2600600 Levyi Il’yas 253 133
24 RF60 60◦0804300 77◦1605300 Koltogorka 220 155.4
25 RF58 60◦3001900 76◦5805700 Sosninskii Yegan 732 199
26 RJ-16 BL-36 60◦40028.800 77◦31029.400 Ob 773 200 216
27 BL-35 60◦44010.900 77◦22055.900 Medvedka 7 173
28 BL-34 60◦45058.500 77◦26012.600 Saim 26 173
29 BL-33 60◦47029.300 77◦19013.500 Mishkin Saim 32 173
30 BL-32 60◦49032.300 77◦13 46.300 Alenkin Egan 44 173
31 BL-31 60◦50043.600 77◦05003.000 Kaima 31 173
32 BL-30 60◦55041.000 76◦53049.300 Vakh 750 90 298
33 RJ-23 RF53 61◦34027.400 77◦46035.400 Mokhovaya 1260 192.3
34 RJ-17 BL-29; RA-20 RF57 61◦11052.700 75◦25020.200 Vatinsky Egan 3190 287
35 BL-28 61◦12019.500 75◦23006.500 Er-Yakh 9.35 173
36 RJ-18 RA-19; BL-27 61◦19041.200 75◦0400.300 Ur’evskii Egan 359 272 37 RJ-19; R-9 BL-26 RF56 61◦26013.600 74◦47039.700 Agan 27 600 291 38 RJ-20 RA-18 RF55 61◦27017.300 74◦40023.300 Kottym’egan 7.18 192
40 RJ-21 RF54 61◦29046.600 74◦15030.300 Segut-Yagun 3.37 192
41 RJ-22 RF13 61◦29011.100 74◦09042.900 Vach-Yagun 1.79 192
42 RJ-24 RF52 61◦50028.600 70◦50028.200 Vachinguriyagun 9.52 192
43 RJ-25 RF14 61◦58005.100 73◦47003.400 Lyukh-Yagun 21.6 192
44 RF51 61◦5903900 73◦4703900 Limpas 1648 320
45 RJ-26; R-7; R-8 RA-17 RF50 62◦07050.000 73◦44005.600 Òromyegan 10 770 263
46 RJ-57 RF49 62◦33039.800 74◦00029.500 Pintyr’yagun 33.5 192
47 RJ-56 BL-25 RF48 62◦37008.400 74◦10015.900 Petriyagun 9.65 192 48 RJ-54; R-6 BL-24 RF47 63◦38023.400 74◦1005200 Kirill-Vys’yagun 598 225 49 RJ-55 BL-23 RF46 62◦43009.900 74◦13045.900 Ai-Kirill-Vys’yagun 24.0 192
50 BL-22 RF45 63◦11019.300 74◦36025.500 Pyrya-Yakha 82 194
51 RA-14 63◦11040.6800 74◦38016.9200 Itu-Yakha 250 194
52 RA-13 63◦1003.4800 74◦45016.3200 Nekhtyn-Pryn 96 194
53 RA-4 63◦1004.6800 76◦28019.0800 Nyudya-Pidya-Yakha 79.5 194
54 RA-12 63◦9031.3800 75◦302.5800 Ponto-Yakha 19 194
55 RA-11 63◦9039.8400 75◦09010.8600 Velykh-Pelykh-Yakha 170 194
56 RA-10 63◦13012.0600 75◦38052.2600 Yangayakha 88 194
57 RA-9 63◦13025.200 76◦5023.0400 Tlyatsayakha 43 194
58 RA-8 63◦1303.6600 76◦15024.600 Chukusamal 121 194
59 RA-3; RA-7 63◦46022.9200 76◦25028.8600 Vyngapur 1979 324
60 RA-6 63◦12043.3800 76◦21027.6600 Goensapur 11 194
61 RA-5 63◦12045.9600 76◦2401.3200 Denna 15 194
62 RA-15 63◦8034.0200 74◦54029.100 Nyudya-Itu-Yakha 32 194
63 RJ-53; R-5 RA-16; BL-21 RF38 63◦22001.600 74◦31053.200 Kamgayakha 175 194 64 RJ-52; R-4 BL-19 RF39 63◦36048.200 74◦35028.600 Khatytayakha 34.6 194
65 RJ-51 BL-18 RF40 63◦40041.800 74◦35020.700 Pulpuyakha 281 194
66 RJ-50; R-3 BL-17 RF41 63◦49058.000 74◦39002.500 Khanupiyakha 74 194 67 RJ-29; R-2 BL-16 RF42; RF37 63◦51023.400 75◦08005.600 Kharucheiyakha 820 292 68 R-1; Z-55; RJ-28 BL-20; RA-2; BL-15 RF43 63◦49054.200 75◦22047.100 Pyakupur 9880 324 69 RJ-27; Z-86 BL-14; RA-1 RF44 63◦47004.500 75◦37006.800 Lymbyd’yakha 115 194
70 BL-13 63◦43037.900 75◦59004.100 Chuchi-Yakha 1396 292
71 RJ-32 64◦12008.400 75◦24028.400 Ngarka-Tyde-Yakha 59.9 186
72 RJ-30 RF36 64◦06050.700 75◦14017.300 Ngarka-Varka-Yakha 67.1 186
73 RJ-31 64◦09006.400 75◦22018.100 Apoku-Yakha 18.8 186
74 RJ-33 RY 14-49 RF35 64◦17031.900 75◦44033.400 Etu-Yakha 71.6 186
Table 1. Continued.
Number on the map Season N E River Watersheds, Annual runoff,
km2 mm yr−1
June August October February
76 RY 14-48 64◦23030.600 76◦19050.100 Khaloku-Yakha 53 186 77 RJ-35 RF34 64◦26005.200 76◦24037.000 Kharv’-Yakha 46.4 186 78 RJ-36 RY 14-47 RF33 64◦32007.900 76◦54021.300 Seryareyakha 15.2 186 79 RJ-37 RY 14-46 RF32 64◦40014.000 77◦05027.200 Purpe 5110 309 80 RJ-38 64◦55055.100 77◦56008.200 Aivasedapur 26 100 309 81 RJ-39 RF31 65◦06048.800 77◦47058.800 Tydylyakha 7.46 185 82 RJ-40 RY 14-45 RF30 65◦12017.600 77◦43049.800 Tydyotta 12.0 309 83 RJ-41 RY 14-44 RF29 65◦23034.100 77◦45046.700 Ponie-Yakha 78.9 185 84 RJ-42 RY 14-43 RF28 65◦41051.100 78◦01005.000 Yamsovey 4030 309 85 RY 14-42 65◦46034.500 78◦08025.800 Khiroyakha 183 185 86 RJ-43 RF27 65◦47048.600 78◦10009.000 Almayakha 106 185 87 RJ-45 RF25 65◦5805400 77◦3400500 Yude-Yakha 42.4 185 88 RJ-46 RF26 65◦59005.700 77◦40052.600 Tadym-Yakha 39.9 185 89 RJ-44 RY 14-41 65◦57005.500 78◦18059.100 Pur 112 000 298 90 RJ-49 RT2 14-32 65◦59014.700 78◦32025.200 Malaya Khadyr-Yakha 512 278 91 RJ-48 RT2 14-31 66◦17010.800 79◦15006.100 Ngarka Khadyta-Yakha 1970 277 92 RT2 14-30 66◦59020,900 79◦22030.500 Malokha Yakha 157 208 93 RT2 14-29 67◦10054.800 78◦51004.500 Nuny-Yakha 656 312 94 RJ-47 RT2 14-40 67◦22013.2800 79◦00025.900 Taz 150 000 330
95 RF21 67◦2403900 76◦2101200 Khadutte 5190 346
by gas chromatography and isotope mass spectrometry, using Delta V Advantage and Finnigan GasBench II in order to de-termineδ13CDIC(per mil relative to V-PDB; Fritz and Fontes, 1980). For these measurements, 0.1 mg of 100 % H3PO4was added to the borosilicate vial and flushed with He (purity of 7.0) for 400 s. Afterwards, 1 mL of the sample was injected into the vial and shaken for 36 h at 24◦C. Standard samples of C-O-1 and NBS-19 were routinely analyzed to test the ac-curacy of our measurements; typically, a disagreement of less than 0.3 ‰ between the measured and certified values was observed, with a total estimated measurement uncertainty of ±0.2 ‰.
The concentration of carbon and major elements in rivers were treated using the least-squares method, Pearson corre-lation and one-way ANOVA (SigmaPlot version 11.0, Sys-tat Software, Inc.). The ANOVA was used to reveal the dif-ferences between different permafrost zones. It was carried out using Dunn’s method because each sampling period con-tained a different number of rivers. Regressions and power functions were used to examine the relationships between the dissolved component concentrations and the watershed area, river discharge, average latitude of the watershed and seasons. Comparison of DOC and major element concentra-tion in rivers sampled in three main permafrost zones (con-tinuous, discontinuous and permafrost-free regions), during all seasons and of different watershed size class, was con-ducted using the non-parametric H-criterion Kruskal–Wallis test. First, we separated the watershed into four main classes encompassing all studied rivers (except the Ob):<100, 100 to 1000, 1000 to 10 000, and>10 000 km2. We considered three main seasons in six different ranges of latitude (56 to 58◦N, 58 to 60◦N, 60 to 62◦N, 62 to 64◦N, 64 to 66◦N
and 66 to 68◦N). We checked for the variation in measured
parameters of each watershed size as a function of latitude,
separately in each season. In addition, a generalized assess-ment of the role of permafrost type and abundance on river water chemical composition was possible via separating all the sampled watersheds into three categories according to the permafrost distribution in the WSL: permafrost-free, discon-tinuous and condiscon-tinuous permafrost.
3 Results
sta-Figure 1.
tistically significant (H=10.6,p=0.014). Considering the full data set of all seasons and watershed sizes, we distin-guished three geographical zones in terms of the permafrost abundance: continuous, discontinuous and absent. For most river water parameters (pH, DIC, DOC, major anions and cations) the differences between three zones are significant (30< H <95, p level<0.001). Si concentration exhibited lower but statistically significant differences between differ-ent zones (H=9.5,p=0.0086).
[image:6.612.128.469.64.568.2]Figure 1. (a) Map of the study site with permafrost boundaries (Brown et al., 2002; http://portal.inter-map.com (NSIDC)), runoff contour
lines (Nikitin and Zemtzov, 1986) and sampling points along the latitudinal transect of river basin of the Ob, Pur and Taz. The numbers of the sampling sites are listed in Table 1. (b) Detailed map of the four rectangles in (a).
−25 ‰ in the continuous permafrost zone, Fig. S6c). In con-trast, the effect of the permafrost on Si concentration is not clearly seen; the scatter of the data between different seasons and watersheds does not allow for any significant trend to be traced (not shown).
The optical properties of DOC remain essentially constant throughout the full range of watershed sizes, latitudes and seasons (Fig. S7). The largest variation in specific UV280 nm absorbance occurred in winter, when several DOC-rich wa-ters from the southern (permafrost-free) part of the WSL
demonstrated quite a low concentration of aromatic (colored) compounds.
4 Discussion
4.1 Effect of latitude (permafrost and vegetation) on major cation, Si and DIC mobilization from the soil profile and groundwater to the river
[image:7.612.67.526.70.512.2]Figure 2. Decrease in river water pH with the increase in the latitude
during winter (a), spring (b) and summer (c). The spring acid pulse is seen only in permafrost-affected rivers north of 62◦N (b), and the scatter of the values is maximal during summer (c). The vari-ability among different watershed sizes is smaller than that between the seasons and within the latitude gradient. Diamonds, squares, tri-angles and circles represent watersheds of size<100, 100 to 1000, 1000 to 10 000, and>10 000 km2, respectively.
(Prokushkin et al., 2011; Pokrovsky et al., 2012) and other boreal and subarctic regions (Laudon et al., 2004; Petrone et al., 2006; Walvoord and Striegl, 2007; Jantze et al., 2013; Giesler et al., 2014), we anticipate a decrease in most ele-ment concentrations, including DOC, northward regardless of the season and the river size in the WSL due to (1) a de-crease in chemical weathering intensity with the temperature, well demonstrated for igneous rocks such as basalts (Dessert et al., 2003) and granites (Oliva et al., 2003); (2) a decrease
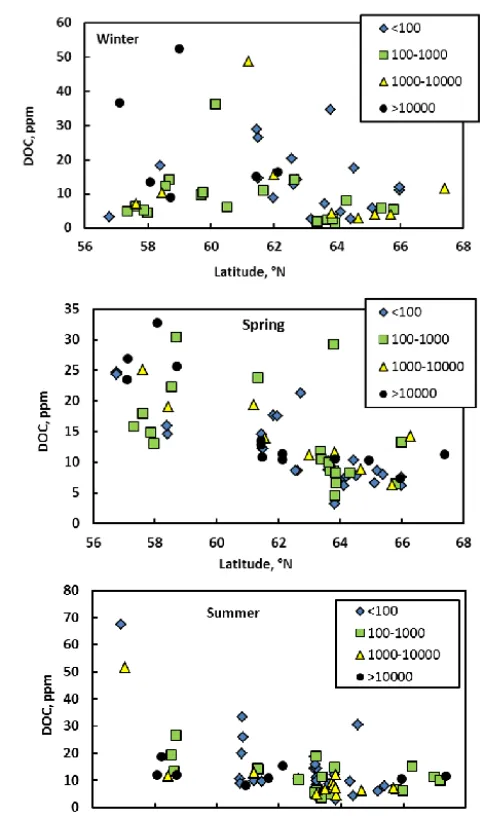
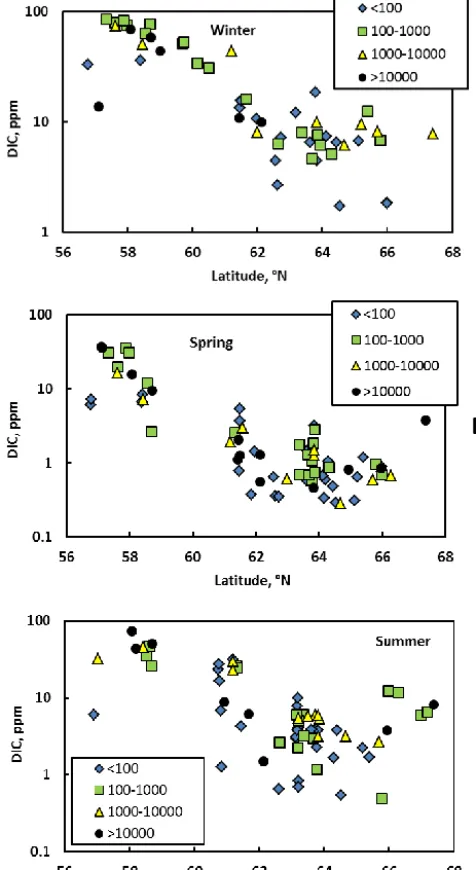
Figure 3. Decrease in DOC with latitude during winter (a), spring (b) and summer (c). The latitudinal trend is significant atp <0.05. Considering all seasons together, the differences between different watershed sizes are not statistically significant (p >0.05). The sym-bols are the same as in Fig. 2.
[image:8.612.47.283.64.487.2]al-Figure 4. Significant decrease in DIC with latitude during
win-ter (a), spring (b) and summer (c). Note the logarithmic scale on concentration in all three plots. The symbols represent different size of the watershed; see Fig. 2.
[image:9.612.307.550.65.350.2]lochthonous DOC from the soil to the river (Striegl et al., 2005); (2) the increase in DOC and related element leach-ing from plant litter and topsoil (Pokrovsky et al., 2005; Giesler et al., 2006; Fraysse et al., 2010) during more pro-nounced massive freshet event or summer high flow (Michel and Vaneverdingen, 1994; McClelland et al., 2006; White et al., 2007); (3) the decrease in DOM retention (adsorption) on the mineral soil horizon because clay horizon is typically frozen in the north (Kawahigashi et al., 2004); (4) the de-crease in authigenic clay and allophane mineral formation in the soil horizons (Targulian, 1971).
Figure 5. The variation inδ13CDICwith latitude during winter (a) and spring (b) for watershed of different size. The symbols are the same as in Fig. 2. Isotopically light DIC is observed in permafrost-affected zone during spring, suggesting intensive respiration of soil or plant litter carbon (Ob River sediments are from−25 to−27 ‰; Guo et al., 2004a).
[image:9.612.46.284.71.506.2]south should be minimal. However, the abovementioned hy-potheses are not supported by DIC, Ca and Mg concentra-tions observed in rivers (Figs. 4, S1 and S2). First, the DIC concentrations decrease between permafrost-free and discon-tinuous/continuous permafrost zones is a factor of 15±5 in winter (Fig. 4a) and a factor of 60±10 in spring (Fig. 4b). Similarly, the decrease in Ca and Mg concentrations between south of 59◦N and 62–66◦N zones is 10-fold in winter and 20–30-fold in May. In fact, it is the spring period which ex-hibits the highest contrast in element concentrations between the south and the north. Second, for the latitude concentra-tions gradient from south to north, the relative DIC, Ca and Mg concentration change between large (1000–10 000 and >10 000 km2) and small (<100 km2) rivers in winter is not statistically significant (p >0.05).
However, a systematic decrease in Ca concentration in the WSL rivers northward (Figs. S1, S5b) is consistent with a general decrease in Ca concentration in soil ecosystems as illustrated in Fig. S8. An order-of-magnitude decrease in Ca concentration in mineral horizons of WSL peat columns oc-curred between 55 and 66◦N (Stepanova et al., 2015). On a smaller scale, a 3-fold decrease in exchangeable Ca concen-tration in alluvial soils of the Ob Basin from 56 to 60◦N was reported (Izerskaia et al., 2014). These observations confirm a strong control of lithology and soil weathering on Ca con-centration in both deep and surface soil horizons and vegeta-tion, which finally determines the extent of Ca transport via surface flux to the river.
North of 66◦N, concentrations of Ca, Mg and sulfate in-crease relative to their concentration at 62–66◦N of discon-tinuous permafrost zone. This is especially pronounced dur-ing the summer period (Figs. S1c, S2c). We do not exclude here the influence of marine sedimentary deposits contain-ing salts in the deep part of the mineral soil profile below the peat layer. These deposits are described in the low reaches of Taz and Pur rivers, based on sedimentary cores extracted dur-ing extensive drilldur-ing of the territory (Liss et al., 2001). This influence, however, cannot be unequivocally evidenced be-cause (i) DIC concentrations also increase in summer, north of 66◦N, although DIC is not likely to be affected by marine deposits, and (ii) chloride, an efficient marker of sea salts, is not increasing in the north (not shown).
The isotopic composition of DIC confirms the general fea-tures of DIC and cation concentration (Fig. 5). The ground-water feeding by taliks in winter is highly uniform over 10◦ of latitude, with the value of δ13C
DIC being equal to −15±5 ‰, reflecting both carbonate/silicate weather-ing and a buildup of CO2 with a stronger respiratory sig-nal (Finlay, 2003; Striegl et al., 2001; Giesler et al., 2014; Rinta et al., 2015). During this period, the variability in δ13CDICis the highest in small (<100 km2) watersheds, but no trend of isotopic composition with latitude could be evi-denced atp <0.05 (Fig. 5a). This isotopic signature is pre-served in spring for southern (<60◦N) watersheds whereas in permafrost-affected regions,δ13CDICdecreases to ca.−25
to −20 ‰ regardless of the river size and the type and the abundance of the permafrost (Fig. 5b). Such low val-ues in the permafrost-affected zone could no longer repre-sent the influence of carbonate/silicate rock weathering by soil CO2 and likely reflect direct microbial processing of soil and sedimentary organic matter (Waldron et al., 2007; Giesler et al., 2013), with the DIC isotopic signature similar to that of organic carbon in western Siberian subarctic topsoil (−26±2 ‰; Gentsch et al., 2015) and the Ob River organic sediments (−25 to−27 ‰; Guo et al., 2004a).
A plausible explanation for the δ13CDIC seasonal varia-tion being mostly pronounced in the permafrost zone can be that microbial mineralization of dissolved organic carbon oc-curs most efficiently during the springtime, when significant amounts of fresh organic matter from ground vegetation are leached by melted snow. Higher bioavailability of vegetation leachates relative to more refractory soil humic and fulvic acids is known from studies in other temperate (van Hees et al., 2005) and boreal (Wickland et al., 2007) regions. The lack ofδ13CDIC decrease in spring relative to winter in the permafrost-free zone may stem from (i) significant input of the carbonate/silicate rock-hosted groundwaters during the full period of the year in the south or (ii) the different na-ture of DOM in the south, where the more refractory organic matter originated from peat leaching is less subjected to mi-crobial processing compared to fresh vegetation leachates in the north, where the peat soil in spring is frozen. One has also take into account that the DIC concentrations in spring are a factor of 30 lower in the permafrost-bearing region relative to the permafrost-free region (Fig. 4b). As such, a relatively small input of microbially respired CO2will be significantly more visible in theδ13CDICvalue of the northern rivers com-pared to that of the southern rivers.
of Frey et al. (2007b), the groundwater contribution to sum-mertime period river chemical composition ranges between 30 and 80 % for the rivers located between 56 and 58◦N.
Consistent with these findings, the pH values of 7 to 7.5 in the southern rivers observed both in winter and spring (Fig. 2a, b) are indicative of carbonate/silicate rock input. The spring acid pulse, well established in other permafrost-free boreal regions (Buffam et al., 2007), is not at all pro-nounced in the south of the WSL but becomes clearly vis-ible in the permafrost-affected, northern regions where the springtime pH decreases to 5±0.5 (Fig. 2b). This illustrates the more important role of plant litter and moss leaching in the permafrost-bearing zone on solute export from the wa-tershed. In addition, the dominance of sands north of 62◦N (Liss et al., 2001) may allow low-molecular-weight (LMW) organic acids migrate to the river from the soil profile. In the southern, permafrost-free zone, the dominating clays under-neath the peat can adsorb acidic LMW organic compounds and thus do not allow the acid pulse to be clearly visible.
The increase in pH in summer relative to the spring period is again less visible in the south than in the north (Fig. 2c) and may reflect the persisting role of bedrock dissolution as well as the change in the river feeding regime, from top soil and vegetation in the north to the peat soil column leaching in the south. The summertime increase in river water pH north of 60◦N, in the forest–tundra and tundra zone may be linked to (i) enhanced photosynthesis in rivers of the north due to better insolation and less forest shading and (ii) mobilization of DOM and other solutes from soil depressions rather than from watershed divides. The depressions are subjected to in-tense rinsing during the spring seasons, when the majority of soluble acidic compounds are flushed from the litter and Oe horizon. These mechanisms are evidenced from studies of the hydrological balance of frozen bogs performed in the north-ern part of studied territory (Novikov et al., 2009). In con-trast, the watershed divides contain significant amounts of organic litter and release organic acids only in spring, when they are covered by temporary ponds of melted snow (see Manasypov et al., 2015). This hydrological scheme of river water feeding is based on the seasonal multiannual observa-tions on frozen bogs of the north of the WSL (Novikov et al., 2009), although the chemical nature of DOM mobilized from different parts of the watershed remains unknown.
The importance of plant litter and ground vegetation leaching as element sources in western Siberian rivers can be assessed from the comparison of K concentrations as a function of latitude during different seasons (Fig. S3). The most significant decrease in K concentration from the southern (<59◦N) to the northern (61–67◦N) water-sheds occurs in spring, during intense plant litter leach-ing. Regardless of latitude, K concentration follows the or-der spring>winter>summer, with the highest concentra-tions, up to 2500 ppb, recorded in permafrost-free region. Given that the other cations, possibly originating from the water–mineral interaction at some depth, do not exhibit such
high concentration in spring, we interpret the springtime K “pulse” as indicative of plant litter leaching in the produc-tive taiga zone. This “pulse” is much less visible in the per-mafrost zone due to significantly lower biomass and primary productivity of forest–tundra and tundra biomes compared to the taiga of the WSL (Tyrtikov, 1979; Liss et al., 2001).
Despite significant variability in Si concentrations among rivers of various sizes across the latitude profile (Fig. S4), the concentrations in the permafrost zone are not lower than those in the south of the WSL. Results of a previous study of WSL rivers during summer show that Si concentrations are weakly dependent on latitude (Frey et al., 2007), as also con-firmed in this work for the spring flood and winter baseflow period. Given that (i) the dominance of permafrost north of 64◦N implies very low groundwater feeding (4 to 6 % of the annual discharge; see Nikitin and Zemtsov, 1986; Novikov, 2009) and (ii) the upper part of the soil profile including its seasonally frozen and unfrozen parts is mostly peat rather than silicate mineral sediments, the role of groundwater– silicate rock interaction in Si supply to northern rivers should be quite low. Therefore, we hypothesize that elevated con-centrations of Si in northern rivers are due to peat leaching and degradation. A depletion of Si in rivers of the southern part of the WSL may be due to Si retained by abundant bog and forest vegetation. This is consistent with the general set-ting of the WSL, recovering from the last glaciation (Liss et al., 2001), with contemporary peat accumulation in the south and old frozen peat thawing/degrading in the north.
4.2 DOC concentration across a 1500 km latitude transect of variable permafrost coverage
Results of organic carbon concentration in western Siberian rivers collected over various seasons of the year generally confirm the pioneering findings of Frey and Smith (2005). The strong statistically significant (p <0.05) contrast in DOC concentration between permafrost-free, discontinuous and continuous permafrost zone persists over the course of the year and each season except probably winter (Figs. 3 and S6a). This difference is also seen in δ13CDIC values among all three zones (Fig. S6c), suggesting, on the annual scale, a more significant contribution of microbial process-ing of plant and soil organic carbon to HCO3and CO2of the river water in the permafrost-bearing zone compared to the permafrost-free zone.
be-tween 10 and 15 % and as such does not significantly affect annual export of DOC from the watersheds.
In contrast, the gradient of organic carbon concentration along the latitudinal profile in spring will be mostly con-trolled by the difference in plant litter stock subjected to leaching by melted snow. As such, one would not expect any significant difference between large and small rivers at oth-erwise similar runoff, vegetation and bog coverage. This is partially confirmed by the similarity of the UV280 nm–DOC slope, corresponding to similar degree of DOM humification, among different seasons and latitudinal positions (Fig. S7). The uniform distribution of UV280absorbance demonstrates that the main control of DOC by allochthonous (terrestrial) input from peat and/or ground vegetation leachates. The ex-ceptions are the rivers Vasyugan (no. 21), Shegarka (no. 4) and Vatinsky Egan (no. 34), exhibiting low UV280 nmat high [DOC] (Fig. S7). These rivers are potentially affected by oil production sites and may contain some uncolored products of hydrocarbon oxidation in the underground waters.
Overall, results on western Siberian rivers generally con-firm the conclusion of Finlay et al. (2006) on (i) the lack of groundwater contribution to streamflow in arctic watersheds and (ii) that river DOC dynamics are driven essentially by processes occurring at the soil surface. However, we doubt the importance of large DOC pool production under very cold conditions with regard to the main reason for sustained high concentration of DOC at snowmelt suggested by Finlay et al. (2006). Indeed, the plant litter degradation in winter, even in the warmest scenario, is minimal and does not con-tribute significantly to annual litter leaching (Bokhorst et al., 2010, 2013). Instead, we suggest fast plant litter and ground vegetation leaching in spring, at the very beginning of the snow melt. Such a fast enrichment in DOC and colored or-ganic compounds of surface water depressions, on the order of several hours, has been observed in the discontinuous per-mafrost zone in early June (Manasypov et al., 2015). Sig-nificant release of DOC and nutrients from flooded ground vegetation in the southern part of the WSL is also known (Vorovyev et al., 2015).
An unexpected result of the study of western Siberian watersheds is the lack of the enrichment in DOC of small headwater streams, in contrast to what has been reported for Scandinavian rivers and streams (Ågren et al., 2007, 2014, and references therein). In the WSL, especially in the north-ern, permafrost-affected zone, the small (<100 km2) streams yielded DOC concentrations that were not statistically higher (p >0.05) than those of larger rivers, neither in spring flood nor in summer. A number of factors can be responsible for the observed difference between permafrost-free European and permafrost-bearing Siberian watersheds. In the north of western Siberia, the microbial processing of DOM in large rivers may be weakly pronounced. This is confirmed by the observation that the degree of light C isotope enrichment (loweringδ13CDIC)in spring is independent (p >0.05) of the size of the river (Fig. 5b) and, correspondingly, of the water
residence time on the watershed. According to Kawahigashi et al. (2004), the DOM in northern, permafrost-affected trib-utaries of the Yenisey River was significantly less biodegrad-able than that in southern tributaries. This may contribute to better preservation of DOM in the stream yielding its inde-pendence of the water travel time. Small watersheds of west-ern Siberia exhibit a runoff and average slope very similar to that of the large rivers, given the very flat orographic con-text of the WSL. This contrasts with the mountain regions of Sweden and Alaska, where the headwater streams may ex-hibit higher runoff and thus higher export of the dissolved constituents. Finally, the riparian zone, very important for regulation DOC stock and export in small streams draining glacially formed terrain of NW Europe (Dick et al., 2015; Kuglerová, et al., 2014), is much less pronounced in western Siberia, where generally flat, frequently flooded areas domi-nate the watershed profile.
The elevated DOC concentrations in continuous per-mafrost zone, especially north of 67◦N observed in the present study (Fig. 3b, c), are consistent with previous results showing that, for otherwise similar factors, the permafrost ar-eas are a greater source of DOC than the arar-eas with sar-easonal frost (Carey et al., 2003). In permafrost areas, meltwater trav-els through organic-rich layers in the form of so-called supra-permafrost flow, as opposed to areas without impermeable permafrost table. In the latter, the infiltration of organic-rich surface waters to the deep mineral layer and DOC sorption on clay minerals may occur, thus decreasing the overall export of DOC (see Smedberg et al., 2006, for discussion). Given the dominance of peat rather than minerals within the ac-tive (unfrozen) layers of soil profile, the difference between permafrost-free and permafrost-affected zones is even more accentuated in western Siberia.
tribu-A
Figure 6.
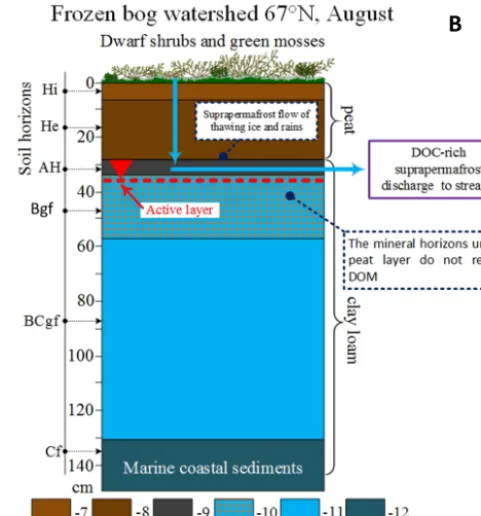
taries exhibited significantly higher DOC concentrations than the southern tributaries of this river. Specifically, given the significant thickness of the peat even in the northernmost part of the WSL and the active layer thickness of <50 to 80 cm (30 cm on mounds and 80 to 150 m in troughs and de-pressions, Tyrtikov 1973, 1979; Baulin et al., 1967; Baulin, 1985; Khrenov, 2011; Novikov et al., 2009), even in the re-gion of continuous permafrost development, peat soil inter-stitial solutions might not come in contact with the mineral soil horizon and thus will not decrease their DOC concentra-tion during migraconcentra-tion from the soil column to the river along the permafrost impermeable layer (Fig. 6).
Therefore, in the permafrost zone, the DOC export is strongly controlled by DOC residence time and the water travel pathway through organic topsoil and lichen, moss and litter leaching vs. peat and mineral layer leaching (Fig. 6b). In this case, it is only the thickness of the unfrozen peat and the local permafrost coverage that control the DOC export from the soil to the river. As a result, DOC concentration in the streams will be weakly dependent on the watershed size and seasons. It follows that DOC export from peat soils by
[image:13.612.308.549.68.326.2]B
Figure 6. Scheme of DOC pathways within the soil profile and
to the river. (a) In forest watershed of the south, permafrost-free zone (57◦N). Soil horizons (FAO, 2006): (1) O (Mor, forest lit-ter), (2) medium-decomposed peat (He) transforming into strongly decomposed peat (Ha) in the bottom layer, (3) mollic humic hori-zon, (4) ABg surface horizons with stagnic properties, (5) Bg mid-dle stagnic horizon, and (6) Cgk carbonate-bearing clays and clay loam. (b) DOC pathways in frozen bog peatlands of continuous permafrost (67◦N). Soil horizons (FAO, 2006): (7) weakly decom-posed peat (Hi), (8) partially decomdecom-posed peat (He), (9) humic hori-zons (AH), (10) cryoturbated frozen stagnic horizon (Bgf), (11) frozen stagnic horizon (BCgf), and (12) sedimentary deposits (Cf). In the south, DOC is retained by clay, and deep in the soil profile by clay loam with carbonates. In the north, the active layer depth does not exceed the overall thickness of the peat and thus the leachates of ground vegetation and peat layer do not meet mineral horizons during their transit to the river.
4.3 Possible evolution of chemical composition and fluxes of western Siberian rivers under climate change scenarios
The most likely scenario of the climate change in western Siberia consists of shifting the permafrost boundary further north and increase in the active layer thickness (Pavlov and Moskalenko, 2002; Frey, 2003; Romanovsky et al., 2010; Vasiliev et al., 2011; Anisimov et al., 2013). The permafrost boundary change, equivalent to the northward shift of the river latitudes, may decrease the DOC concentrations of the most northern rivers by a maximum of 2-fold due to the change of continuous to discontinuous permafrost. The thickness of the active layer is projected to increase by more than 30 % during this century across the tundra area in the Northern Hemisphere (Anisimov et al., 2002; Stendel and Christensen, 2002; Dankers et al., 2011). In the WSL, this increase will be most dramatic in the north, where the peat deposits are thinner than those in the discontinuous per-mafrost zone (Botch et al., 1995; Liss et al., 2001; Novikov et al., 2009; Kremenetski et al., 2004). Assuming a short-term (hundreds of years) scenario in the WSL, we hypoth-esize that the main consequences of this increase will be the involvement of upper clay horizon and sand/silts in wa-ter pathways within the soil profile. As a result, the DOC originating from the upper peat layer leaching and plant lit-ter degradation will be retained on mineral surfaces and in the clay interlayers (Kaiser et al., 2007; Oosterwoud et al., 2010; Mergelov and Targulian, 2011; Gentsch et al., 2015). To which degree this change of water pathways in the soil column may affect the other dissolved components cannot be predicted. However, this effect for inorganic solutes is expected to be lower than that for DOC, given much lower affinity of HCO3, major cations and Si to clay surfaces and the lack of unweathered (primary) silicate rocks underneath the peat soil column. Nevertheless, the possibility of leaching of inorganic components from the mineral layers should be considered. For example, DOC export exceeded DIC export in a tributary of the Yukon River during high flow, whereas DIC predominated during low flow and the DIC yields in-creased with decreasing permafrost extent (Dornblaser and Striegl, 2015). Unfortunately, no time series on hydrochem-istry of rivers of continuous permafrost development, north of 64◦N, are available to test the hypothesis of the impact of climate change on a possible decreasing DOC flux from frozen peatlands and the DOC/DIC change due to ongoing decrease in permafrost protection of the mineral layer from adsorbing DOC.
Important modifications linked to the climate change in boreal and subarctic zones concern the change of the hydro-logical regime (Karlsson et al., 2015), in particular the in-crease in the winter baseflow (Yang et al., 2004; Ye et al., 2009; Serreze et al., 2000) due to the increase in the ground-water feeding (Frey et al., 2007a, b; Walvoord and Striegl, 2007; Rowland et al., 2010; Walvoord et al., 2012),
cou-pled with the increase in the overall precipitation and, con-sequently, water runoff (Peterson et al., 2002; McClelland et al., 2006). Here, we argue that the 10 to 30 % modification in the annual runoff will be within the variation in the DOC and cation concentrations between watersheds of various sizes observed in the present study and as such will not signifi-cantly affect the export fluxes of river water constituents.
To which degree the ongoing DOC concentration and flux rise in rivers, linked to climate change and/or acidification as reported in western Europe and Canada (Worrall et al., 2004; Porcal et al., 2009) can be applied to the WSL is unknown. However, we did not observe any significant (i.e.,>30 %) change of DOC fluxes over past 30 to 40 years neither in the boreal non-permafrost pristine region of NW Russia (Sever-naya Dvina River; Pokrovsky et al., 2010), nor in the Central Siberian, continuous permafrost rivers of the Yenisei Basin (Pokrovsky et al., 2005). Moreover, a decrease in DOC fluxes in the Yukon River was reported and suggested to be linked to enhanced mineralization of DOC by biota (Striegl et al., 2005). Note also that the more recent evaluation of the Ob River DOC discharge using flow-weighted concentration of 9.4 mg L−1 measured in 2003–2007 (Cooper et al., 2008) gives a flux of 1.3 t C km−2yr−1, well comparable with the earlier estimate of 1.2 t C km−2yr−1, based on the RHS data of 1950–1990 (Gordeev et al., 1996).
The increase in vegetation productivity reported for Arctic river basins (Sturm et al., 2001, Tape et al., 2006; Kirdyanov et al., 2012) will most likely proportionally increase the springtime K flux due to its leaching from plant litter but likely decrease the summertime Si flux, especially in the permafrost-bearing regions. The increase in vegetation den-sity in the next decades to centuries may produce a transient uptake of Si by growing vegetation in the discontinuous per-mafrost zone during summer period. However, this potential decrease in Si export flux may be outweighed by the increas-ing release of Si from previously frozen mineral horizons and as such the overall modification of the Si concentration and riverine flux in the discontinuous–continuous permafrost zone may be smaller than that projected by simple latitudinal shift.
5 Conclusions
Ca) concentration decrease from the south to the north, re-ported for the peat, moss and mineral layer.
Both seasonal and latitudinal patterns of DOC and DIC concentrations in WSL rivers are consistent with previ-ous observations that, in the continuprevi-ous permafrost zone of frozen peat bogs, the underlining mineral layer is not reac-tive, being that it is protected by the permafrost, so that the major part of the active layer is located within the organic (peat) and not the mineral matrix. The variation in δ13CDIC along the permafrost/latitude gradient is consistent with a progressive decrease in the groundwater feeding of rivers northward, reflecting the shift of DIC origin from groundwa-ter in the south to plant litgroundwa-ter degradation and soil respiration in surface waters north of 62◦N. In winter, theδ13CDIC is rather constant within the full latitudinal profile, confirming the dominant role of carbonate/silicate mineral weathering by atmospheric and soil CO2dissolved in the groundwaters. Because the thickness of the unfrozen peat and local per-mafrost coverage essentially control the DOC export from the soil to the river, the DOC concentration in the streams is weakly dependent on the watershed size and seasons. It follows that DOC export from peat soils by medium-sized (<100 000 km2) rivers located entirely in the permafrost zone may be higher than that of the larger rivers, crossing permafrost-free regions. Assuming a short-term (hundreds of years) climate warming scenario in the WSL, we hypothesize that the increase in the active layer thickness will bring about the involvement of upper clay horizon and sand/silts in water pathways within the soil profile. As a result, the DOC export in permafrost-affected watersheds may decrease, whereas the export of DIC and major cations will increase. Enhanced non-stationary uptake of Si by growing vegetation in the permafrost-bearing zone may attenuate the expected increase in its riverine concentration linked to progressive involve-ment of thawed mineral horizons.
The Supplement related to this article is available online at doi:10.5194/bg-12-6301-2015-supplement.
Author contributions. O. Pokrovsky designed the study and wrote
the paper; R. Manasypov, I. Krickov, and S. Vorobyev per-formed sampling, analysis of major cations and their interpretation; S. Vorobyev and S. Kirpotin were responsible for the choice of sam-pling objects and statistical treatment; S. Loiko and S. Kulizhsky provided the background information on soil, peat, and permafrost active layer; L. Shirokova was in charge of DOC, DIC and an-ion measurements and their interpretatan-ion; B. Pokrovsky performed 13C measurements and their interpretation; L. Kolesnichenko pro-vided GIS-based interpretation, mapping and identification of river watersheds; S. Kopysov and V. Zemtsov performed all primary hy-drological data collection, their analysis and interpretation. All 12 authors participated in field expeditions. Each co-author viewed and approved the final paper and contributed to writing the manuscript.
Acknowledgements. We acknowledge support from a
BIO-GEO-CLIM grant from the Ministry of Education and Science of the Rus-sian Federation and Tomsk State University (no. 14.B25.31.0001) and partial support from RSF grant no. 15-17-10009 “Evolution of thermokarst ecosystems” awarded to L. Shirokova (25 %).
Edited by: J. Vonk
References
Ågren, A., Buffam, I., Jansson, M., and Laudon, H.: Importance of seasonality and small streams for the landscape regulation of dissolved organic carbon export, J. Geophys. Res., 112, G03003, doi:10.1029/2006JG000381, 2007.
Ågren, A. M., Buffam, I., Cooper, D. M., Tiwari, T., Evans, C. D., and Laudon, H.: Can the heterogeneity in stream dissolved or-ganic carbon be explained by contributing landscape elements?, Biogeosciences, 11, 1199–1213, doi:10.5194/bg-11-1199-2014, 2014.
Anisimov, O. A., Shiklomanov, N. I., and Nelson, F. E.: Variabil-ity of seasonal thaw depth in permafrost regions: A stochastic modeling approach, Ecol. Model., 153, 217–227, 2002. Anisimov, O., Kokorev, V., and Zhil’tsova, Y.: Temporal and spatial
patterns of modern climatic warming: Case study of Northern Eurasia, Climatic Change, 118, 871–883, 2013.
Anisimova, N. P.: Cryohydrochemical Features of Permafrost Zone, Nauka, 1981 (in Russian).
Bagard, M. L., Chabaux, F., Pokrovsky, O. S., Prokushkin, A. S., Viers, J., Dupré, B., and Stille, P.: Seasonal variability of ele-ment fluxes in two Central Siberian rivers draining high latitude permafrost dominated areas, Geochim. Cosmochim. Acta, 75, 3335–3357, 2011.
Bagard, M. L., Schmitt, A. D., Chabaux, F., Pokrovsky, O. S., Viers, J., Stille, P., Labolle, F., and Prokushkin, A. S.: Biogeochem-istry of stable Ca and radiogenic Sr isotopes in larch-covered permafrost-dominated watersheds of Central Siberia, Geochim. Cosmochim. Acta, 114, 169–187, 2013.
Baulin, V. V.: Permanently frozen rocks of oil and gaz producing re-gions of the USSR, Moscow, Nauka, 176 pp., 1985 (in Russian). Baulin, V. V., Belopukhova, E. B., Dubikov, G. I., and Shmelev, L. M.: Geocryological conditions of western Siberia Lowland, Moscow, Nauka, 214 pp., 1967 (in Russian).
Beaulieu, E., Godderis, Y., Donnadieu, Y., Labat, D., and Roelandt, C.: High sensitivity of the continental-weathering carbon dioxide sink to future climate change, Nat. Clim. Change, 2, 346–349, 2012.
Beilman, D. W., MacDonald, G. M., Smith, L. C., and Reimer, P. J.: Carbon accumulation in peatlands of West Siberia over the last 2000 years, Global Biogeochem. Cy., 23, GB1012, doi:10.1029/2007GB003112, 2009.
Bokhorst, S., Bjerke, J. W., Melillo, J., Callaghan, T. V., and Phoenix, G. K.: Impacts of extreme winter warming events on lit-ter decomposition in a sub-Arctic heathland, Soil Biol. Biochem., 42, 611–617, 2010.
Botch, M. S., Kobak, K. I., Vinson, T. S., and Kolchugina, T. P.: Carbon pools and accumulation in peatlands of the former Soviet Union, Global Biogeochem. Cy., 9, 37–46, 1995.
Brown, J., Ferrians Jr., O. J., Heginbottom, J. A., and Melnikov, E. S.: Circum-Arctic Map of Permafrost and Ground Ice Condi-tions, National Snow and Ice Data Center/World Data Center for Glaciology, Boulder, CO, USA, Digital media, 2002.
Buffam, I., Laudon, H., Temnerud, J., Mörth, C.-M., and Bishop, K.: Landscape-scale variability of acidity and dissolved organic carbon during spring flood in a boreal stream network, J. Geo-phys. Res., 112, G01022, doi:10.1029/2006JG000218, 2007. Carey, S. K.: Dissolved organic carbon fluxes in a
discontinu-ous permafrost subarctic alpine catchment, Permafrost Periglac. Proc., 14, 161–171, 2003.
Cooper, L. W., McClelland, J. W., Holmes, R. M., Raymond, P. A., Gibson, J. J., Guay, C. K., and Peterson, B. J.: Flow-weighted values of runoff tracers (δ18O, DOC, Ba, alkalin-ity) from the six largest Arctic rivers, Geophys. Res. Lett., 35, L18606, doi:10.1029/2008GL035007, 2008.
Dankers, R., Burke, E. J., and Price, J.: Simulation of permafrost and seasonal thaw depth in the JULES land surface scheme, The Cryosphere, 5, 773–790, doi:10.5194/tc-5-773-2011, 2011. Dessert, C., Dupré, B., Gaillardet, J., Francois, L. M., and Allégre,
C. J.: basalt weathering laws and the impact of basalt weathering on the global carbon cycle, Chem. Geol., 202, 257–273, 2003. Dick, J. J., Tetzlaff, D., Birkel, C., and Soulsby, C.: Modelling
land-scape controls on dissolved organic carbon sources and fluxes to streams, Biogeochemistry, 122, 361–374, 2015.
Dittmar, T. and Kattner, G.: The biogeochemistry of the river and shelf ecosystem of the Arctic Ocean: a review, Mar. Chem., 83, 103–120, 2003.
Dornblaser, M. M. and Striegl, R. G.: Switching predominance of organic versus inorganic carbon exports from an intermediate-size subarctic watershed, Geophys. Res. Lett., 42, 386–394, 2015.
Engström, E., Rodushkin, I., Ingri, J., Baxter, D., Ecke, F., Öster-lund, H., and Öhlander, B.: Temporal isotopic variations of dis-solved silicon in a pristine boreal river, Chem. Geol., 271, 142– 152, 2010.
FAO, Guidelines for soil description, 4th Edn., Rome, FAO, 2006. Feng, X. J., Vonk, J. E., van Dongen, B. E., Gustafsson, O.,
Semile-tov, I. P., Dudarev, O. V., Wang, Z. H., Montlucon, D. B., Wacker, L., and Eglinton, T.I.: Differential mobilization of terrestrial car-bon pools in Eurasian Arctic river basins, P. Natl. Acad. Sci. USA, 110, 14168–14173, 2013.
Finlay, J. C.: Controls of streamwater dissolved inorganic carbon dynamics in a forested watershed, Biogeochemistry, 62, 231– 252, 2003.
Finlay, J., Neff, J., Zimov, S., Davydova, A., and Davy-dov, S.: Snowmelt dominance of dissolved organic carbon in high-latitude watersheds: Implications for characterization and flux of river DOC, Geophys. Res. Lett., 33, L10401, doi:10.1029/2006GL025754, 2006.
Fotiev, C. M.: Taliks and their formations (Taliki and zakonomer-nosti ix formirovanija), in: Geocryology of the USSR, Western Siberia, edited by: Ershov, E. D., Moscow, Nedra, 72–84, 1989 (in Russian).
Fotiev, C. M.: Formation of taliks of Western Siberia, in: Perma-nently frozen rocks and cryogenic processes, Moscow, Nauka, 71–78, 1991 (in Russian).
Fraysse, F., Pokrovsky, O. S., and Meunier, J.-D.: Experimental study of terrestrial plant litter interaction with aqueous solutions, Geochim. Cosmochim. Acta, 74, 70–84, 2010.
Frey, K. E. and McClelland, J. W.: Impacts of permafrost degrada-tion on arctic river biogeochemistry, Hydrol. Process., 23, 169– 182, 2009.
Frey, K. E. and Smith, L. C.: Recent temperature and precipitation increases in West Siberia and their association with the Arctic Oscillation, Polar Res., 22, 287–300, 2003.
Frey, K. E. and Smith, L. C.: Amplified carbon release from vast West Siberian peatlands by 2100, Geophys. Res. Lett., 32, L09401, doi:10.1029/2004GL022025, 2005.
Frey, K. E. and Smith, L. C.: How well do we know northern land cover? Comparison of four global vegetation and wetland prod-ucts with a new ground-truth database for West Siberia, Global Biogeochem. Cy., 21, GB1016, doi:10.1029/2006GB002706, 2007.
Frey, K. E., McClelland, J. W., Holmes, R. M., and Smith, L. C.: Impacts of climate warming and permafrost thaw on the riverine transport of nitrogen and phosphorus to the Kara Sea, J. Geophys. Res., 112, G04S58, doi:10.1029/2006JG000369, 2007a. Frey, K. E., Siegel, D. I., and Smith, L. C.: Geochemistry
of west Siberian streams and their potential response to permafrost degradation, Water Resour. Res., 43, W03406, doi:10.1029/2006WR004902, 2007b.
Fritz, P. and Fontes, J. C.: Handbook of environmental isotope geo-chemistry, v. 1, Elsevier, 1980.
Gaillardet, J., Millot, R., and Dupré, B.: Chemical denudation rates of the western Canadian orogenic belt: the Stikine terrane, Chem. Geol., 201, 257–279, 2003.
Gebhardt, A. C., Gaye-Haake, B., Unger, D., Lahajnar, N., and It-tekkot, V.: Recent particulate organic carbon and total suspended matter fluxes from the Ob and Yenisei Rivers into the Kara Sea (Siberia), Mar. Geol., 207, 225–245, 2004.
Gentsch, N., Mikutta, R., Alves, R. J. E., Barta, J., Capek, P., Gittel, A., Hugelius, G., Kuhry, P., Lashchinskiy, N., Palmtag, J., Richter, A., Šantrucková, H., Schnecker, J., Shibistova, O., Urich, T., Wild, B., and Guggenberger, G.: Storage and trans-formation of organic matter fractions in cryoturbated permafrost soils across the Siberian Arctic, Biogeosciences, 12, 4525–4542, doi:10.5194/bg-12-4525-2015, 2015.
Geological composition of the USSR, v. 1, Stratigraphy, ?oscow, Gostoptekhizdat, 588 pp., 1958 (in Russian).
Giesler, R., Högberg, M. N., Strobel, B. W., Richter, A., Nordgren, A., and Högberg, P.: Production of dissolved organic carbon and low-molecular weight organic acids in soil solution driven by re-cent tree photosynthate, Biogeochemistry, 84, 1–12, 2006. Giesler, R., Mörth, C.-M., Karlsson, J., Lundin, E. J., Lyon, S.
W., and Humborg, C.: Spatiotemporal variations ofpCO2 and δ13C-DIC in subarctic streams in northern Sweden, Global Bio-geochem. Cy., 27, 176–186, 2013.
Gislason, S. R., Arnorsson, S., and Armannsson, H.: Chemical weathering of basalt as deduced from the composition of precipi-tation, rivers and rocks in Southwest Iceland: effect of runoff, age of rocks and vegetative/glacial cover, Am. J. Sci., 296, 837–907, 1996.
Gordeev, V. V. and Sidorov, I. S.: Concentrations of major elements and their outflow into the Laptev Sea by the Lena River, Mar. Chem., 43, 33–46, 1993.
Gordeev, V. V., Martin, J.-M., Sidorov, I. S., and Sidorova, M. V.: A reassessment of the Eurasian river input of water, sediment, major elements, and nutrients to the Arctic Ocean, Am. J. Sci., 296, 664–691, 1996.
Gordeev, V. V., Rachold, V., and Vlasova, I. E.: Geochemical behav-ior of major and trace elements in suspended particulate material of the Irtysh river, the main tributary of the Ob river, Siberia, Appl. Geochem., 19, 593–610, 2004.
Gruzdov, A. V. and Trofimov, V. T.: Abundance and temperature of permanently frozen and seasonally frozen rocks, In: Cryo-genic composition and ice content of permanently frozen rocks of Western Siberian Plate, Moscow, Izd-vo Moscow State Uni-versity, 29–57, 1980 (in Russian).
Guo, L., Semiletov, I., Gustafsson, O., Ingri, J., Anders-son, P., Dudarev, O., and White, D.: Characterization of Siberian Arctic coastal sediments: Implications for terrestrial organic carbon export, Global Biogeochem. Cy., 18, GB1036, doi:10.1029/2003GB002087, 2004a.
Guo, L., Zhang, J. Z., and Guéguen, C.: Speciation and fluxes of nutrients (N, P, Si) from the upper Yukon River, Global Bio-geochem. Cy., 18, GB1038, doi:10.1029/2003GB002152, 2004b. Guo, L., Ping, C. L., and MacDonald, R.W.: Mobilization path-ways of organic carbon from permafrost to Arctic rivers in a changing climate, Geophys. Res. Lett., 34, L13603, doi:10.1029/2007GL030689, 2007.
Holmes, R. M., Peterson, B. J., Gordeev, V. V., Zhulidov, A. V., Meybeck, M., Lammers, R. B., and Vörösmarty, C. J.: Flux of nutrients from Russian rivers to the Arctic Ocean: Can we es-tablish a baseline against which to judge future changes? Water Resour. Res., 36, 2309–2320, 2000.
Holmes, R. M., Peterson, B. J., Zhulidov, A. V., Gordeev, V. V., Makkaveev, P. N., Stunzhas, P. A., Kosmenko, L. S., Köhler, G. H., and Shiklomanov, A. I.: Nutrient chemistry of the Ob’ and Yenisey Rivers, Siberia: results from June 2000 expedition and evaluation of long-term data sets, Mar. Chem., 75, 219–227, 2001.
Holmes, R. M., McClelland, J. W., Peterson, B. J., Tank, S. E., Bu-lygina, E., Eglinton, T. I., Gordeev, V. V., Gurtovaya, T. Y., Ray-mond, P. A., Repeta, D. J., Staples, R., Striegl, R. G., Zhulidov, A. V., and Zimov, S. A.: Seasonal and annual fluxes of nutrients and organic matter from large rivers to the Arctic Ocean and sur-rounding seas, Estuar. Coast., 35, 369–382, 2012.
Ilina, S. M., Drozdova, O. Y., Lapitskiy, S. A., Alekhin, Y. V., Demin, V. V., Zavgorodnyaya, Y. A., Shirokova, L. S., Viers, J., and Pokrovsky, O. S.: Size fractionation and optical properties of dissolved organic matter in the continuum soil solution-bog-river and terminal lake of a boreal watershed, Org. Geochem., 66, 14–24, 2014.
Ivanov, Y. K. and Beshentsev, V. A.: Paleo-geographical aspects of formation of chemical composition of fresh underground waters in Yamalo-Nenetz region, Lithosphere, 4, 188–196, 2005.
Izerskaia, L. A., Vorobyev, S. N., Vorobyeva, T. E., Kolesnichenko, L. G., and Zakharchenko, A. V.: The concentration of Mn, Cu, Zn, Co, B, Sr, Cd and Pb in alluvial soils of the Ob River (forest-steppe, southern taiga and central taiga), Internat. J. Environ. Stud., 71, 691–697, 2014.
Jantze, E. J., Lyon, S. W., and Destouni, G.: Subsurface release and transport of dissolved carbon in a discontinuous permafrost re-gion, Hydrol. Earth Syst. Sci., 17, 3827–3839, doi:10.5194/hess-17-3827-2013, 2013.
Kaiser, C., Meyer, H., Biasi, C., Rusalimova, O., Barsukov, P., and Richter, A.: Conservation of soil organic matter through cryotur-bation in arctic soils in Siberia, J. Geophys. Res., 112, 9–17, 2007.
Karlsson, J. M., Jaramillo, F., and Destouni, G.: Hydro-climatic and lake change patterns in Arctic permafrost and non-permafrost ar-eas, J. Hydrol., 529, 134–145, 2015.
Kawahigashi, M., Kaiser, K., Kalbitz, K., Rodionov, A., and Guggenberger, G.: Dissolved organic matter in small streams along a gradient from discontinuous to continuous permafrost, Glob. Change Biol., 10, 1576–1586, 2004.
Kawahigashi, M., Kaiser, K., Rodionov, A., and Guggenberger, G.: Sorption of dissolved organic matter by mineral soils of the Siberian forest tundra, Glob. Change Biol., 12, 1868–1877, 2006. Keller, K., Blum, J. D., and Kling, G. W.: Stream geochemistry as an indicator of increasing permafrost thaw depth in an arctic wa-tershed, Chem. Geol., 273, 76–81, 2010.
Khrenov V. Y.: Soils of cryolithozone of western Siberia: Mor-phology, physico-chemical properties and geochemistry, Nauka, Moscow, 214 pp., 2011 (in Russian).
Kirdyanov, A. V., Hagedorn, F., Knorre, A. A., Fedotova, E. V., Vaganov, E. A., Naurzbaev, M. M., Moiseev, P. A., and Rigling, A.: 20th century tree-line advance and vegetation changes along an altitudinal transect in Putorana Mountains, northern Siberia, Boreas, 41, 56–67, 2012.
Kremenetski, K. V., Velichko, A. A., Borisova, O. K., MacDonald, G. M., Smith, L. C., Frey, K. E., and Orlova, L. A.: Peatlands of the West Siberian Lowlands: Current knowledge on zonation, carbon content, and Late Quaternary history, Quaternary Sci. Rev., 22, 703–723, 2003.
Kuglerová, L., Jansson, R., Ågren, A., Laudon, H., and Malm-Renöfält, B.: Groundwater discharge creates hotspots of riparian plant species richness in a boreal forest stream network, Ecology, 95, 715–725, 2014.
Laudon, H., Köhler, S., and Buffam, I.: Seasonal TOC export from seven boreal catchments in northern Sweden, Aquat. Sci., 66, 223–230, 2004.
Liss, O. L., Abramova, L. I., Avetov, N. A., Berezina, N. A., Ini-sheva, L. I., Kurnishnikova, T. V., Sluka, Z. A., TolpyIni-sheva, T. Yu., and Shvedchikova, N. K.: Wetland systems of West Siberia and their importance for nature conservation, Grif i K publisher, Tula, Russia, 584 pp., 2001 ISBN 5-8125-0150-5 (in Russian). Lobbes, J. M., Fitznar, H. P., and Kattner, G.: Biogeochemical
char-acteristics of dissolved and particulate organic matter in Russian rivers entering the Arctic Ocean, Geochim. Cosmochim. Acta, 64, 2973–2983, 2000.