VOLUME 41, ARTICLE 14, PAGES 393
-
424
PUBLISHED 30 JULY 2019
http://www.demographic-research.org/Volumes/Vol41/14/ DOI: 10.4054/DemRes.2019.41.14
Research Article
The role of conflict and organized violence
in international forced migration
Alessandra Conte
Silvia Migali
This publication is part of the Special Collection on “Drivers and the potential impact of future migration in the European Union,” organized by Guest Editors Alain Bélanger, Wolfgang Lutz, and Nicholas Gailey.
© 2019 Alessandra Conte & Silvia Migali.
This open-access work is published under the terms of the Creative Commons Attribution 3.0 Germany (CC BY 3.0 DE), which permits use, reproduction, and distribution in any medium, provided the original author(s) and source are given credit.
1 Introduction 394
2 Facts and figures 396
2.1 New asylum applications 396
2.2 Refugee stocks 397
2.3 Where people are fleeing from 400
3 Empirical implementation 401
3.1 Model and data 401
3.2 Conflict and organized violence measures 402
3.3 Control variables 405
4 Findings 407
4.1 Estimates of new asylum flows 407
4.2 Estimates of new asylum flows and different forms of organized
violence 411
4.3 Estimates of refugee stocks 413
5 Conclusions 415
6 Acknowledgements 416
References 417
The role of conflict and organized violence
in international forced migration
Alessandra Conte1
Silvia Migali2
Abstract
BACKGROUND
The growing relevance of migration in the policy agenda of both host and sending countries asks for a better understanding of factors shaping migration processes. This paper analyzes recent trends of increasing asylum applications and refugee stocks and examines the influence of conflicts, as well as political and economic factors, as primary push and pull factors.
OBJECTIVE
The main aim is to empirically investigate the relationship that armed conflicts have with first-time asylum applications and refugee stocks in and outside Europe.
METHOD
We explore different measures that capture the severity and geographical spread of armed conflicts and link them to the dependent variables by fitting a gravity model. RESULTS
The intensity of the conflict and where the fighting is taking place explain an essential portion of the variation in flows of asylum applications and stocks of refugees. Results suggest that people flee terror and war but also violence and insecurity emerging from non-conflict-affected areas and perpetrated by different criminal actors. Results also show that economic conditions, the presence of previous migrant communities in the destination country, distance, and presence of a common language between the origin and destination countries are relevant drivers of new asylum applications. Higher rates of asylum recognition by host countries act as an important pull factor, positively correlated with receiving additional new asylum claims.
CONTRIBUTION
This paper contributes to the empirical literature on the determinants of international
forced migration by empirically examining the latest bilateral migration data and the associations with armed conflict and growing forms of organized violence in the origin countries.
1. Introduction
Both the number of internally and internationally displaced people and the volume of new asylum applications have increased in recent years as a result of intensifying violent conflicts since 2010. According to the Office of the United Nations High Commissioner for Refugees (UNHCR 2018), by the end of 2017 the number of refugees worldwide rose to 25.4 million,3 40 million people were internally displaced,
and 3.1 million were asylum seekers. These figures are substantially higher than those recorded in the preceding decades, with the last two years showing unprecedented numbers of refugees and migrants fleeing conflict-affected zones.
Overall, academic literature has analyzed exposure to violence, armed conflicts, and the effects of different forms of state fragility on new asylum flows. Hatton (2004) analyzes the evolution of asylum flows across the EU and finds that both economic forces and the presence of armed conflict in the source country are important determinants of the size of asylum flows. When looking at the number of asylum applications to OECD countries over the 1980s and 1990s, Thielemann (2006) finds that the most powerful explanatory variables are existing migrant networks, job opportunities, and the perceptions about the ‘liberalness’ of the host country. Hatton (2009, 2016) finds evidence that the flow of asylum seekers is explained by weak economic conditions, oppression, and terror. Hatton (2016) shows a significant and positive relation between the stock of immigrants and the flows of asylum applications. Civil liberties are positively correlated and significant, and in the presence of these variables, the effect of civil war (measured by the number of battle-related casualties) is not significant. When looking at refugees, previous cross-sectional analyses have found genocide, civil war, repression, and political regime transitions as the primary driving factors fueling these stocks, whereas nonviolent political movements and economic and demographic factors exert less significant explanatory power (Schmeidl 1997; Moore and Shellman 2004). Moore and Shellman (2006) show civil wars and high levels of government insurgency, together with high levels of government oppression, as having
significant and negative effects on the proportion of refugees to displaced people. Melander and Öberg (2007) suggest that the geographical scope of the conflict and the extent to which urban centers are affected by lethal violence explain a significant part of the variation in the number of forced migrants, while the intensity of the armed conflict is not significant. Moore and Shellman (2007) show that violent behavior of combatants in an origin country force people to seek refuge abroad. They also document that refugees do not distinguish among destinations by the action of these actors in countries of asylum, with the only exception represented by the presence of genocidal activity in potential host countries. Hoeffler (2013) provides evidence that international and civil wars do result in more migrants and refugees, with a stronger effect on refugees.
In this analysis, we assess the relationship between armed conflicts and organized violence with new asylum applications and refugee stocks both in and outside of Europe. A large number of aggregate-level studies have examined the effects of armed conflict and organized violence on forced migration, mostly finding a significant relationship between these variables. However, significant variation in international migration streams from countries experiencing intrastate armed conflict, violence, and repression is still unexplained. By using the most recent available data on conflicts, we explore the relationship between these factors and international forced migration. We focus on different dimensions of the severity of the fighting (i.e., the intensity of the conflict) and the geographical extension of the battle.
When analyzing the determinants of new asylum applications, we find that all dimensions of conflicts are significant drivers of new asylum applications, thus confirming previous results on the association between conflict and asylum flows. Our results also show that economic conditions in the country of origin and the presence of migrant communities in the destination country are the most relevant drivers of new asylum applications, even in the presence of high-intensity conflicts. Additionally, when focusing on asylum claims lodged in European countries, we show that past asylum recognition rates positively correlate with new asylum applications. We also provide evidence illustrating the relationship between refugee stocks and conflict, showing that conflicts tend to be positively associated with refugee stocks. Economic conditions in the origin country, the presence of previous migrant communities at the destination, and geographical factors are the drivers exerting a sizable influence on creating refugee stocks.
2. Facts and figures
2.1 New asylum applications
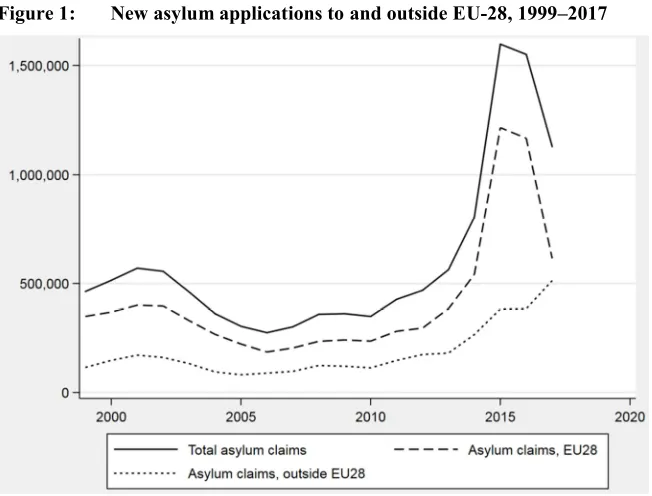
Since 2010 the number of individuals lodging an asylum application in Europe has started to rise. Between 2014 and 2015, there was a steep increase in the number of new asylum applications registered in the EU-28, followed by a decrease observed since 2016. The year 2017 show a marked decline in asylum applications in the EU, from around 1.1 million new applications in 2016 to 0.7 million in 2017. Figure 1 shows the global flow of asylum seeker applications lodged in and outside the EU-28 for the period 1999–2017.4 According to these estimates, Europe accounts for the largest share
of the total number of new asylum applications registered.
Figure 1: New asylum applications to and outside EU-28, 1999–2017
Source:Authors’ calculation based on UNHCR data.
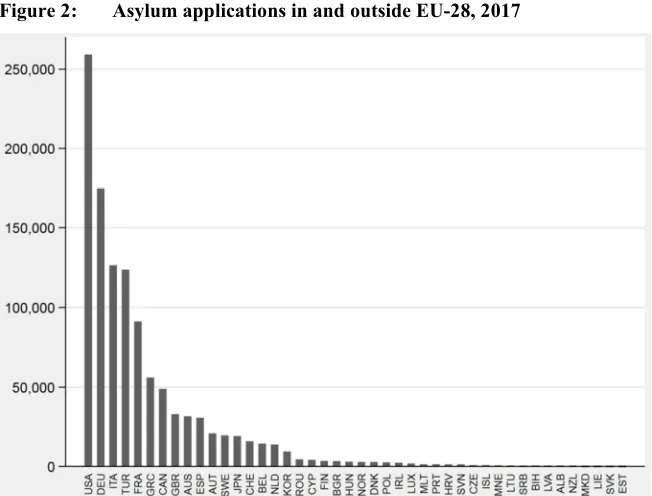
Figure 2 displays how these applications were lodged in 2017 over 44 destinations. In 2017, the United States received the highest number, in absolute terms, of new asylum applications. Specifically, the United States has seen an increase of almost 30% in new asylum applications between 2016 and 2017, mainly due to the increasing number of people from South and Central America seeking asylum in the country. Germany, which received the highest number of new applications in 2016 worldwide, saw a decrease of about 73% between 2016 and 2017. This substantial decrease can be attributed to the closure of a route through the Balkans commonly used to reach the country at the peak of the refugee crisis in 2015 and to an EU migration agreement with Turkey in 2016 (UNHCR 2018).
Figure 2: Asylum applications in and outside EU-28, 2017
Source: Authors’ calculation based on UNHCR data.
2.2 Refugee stocks
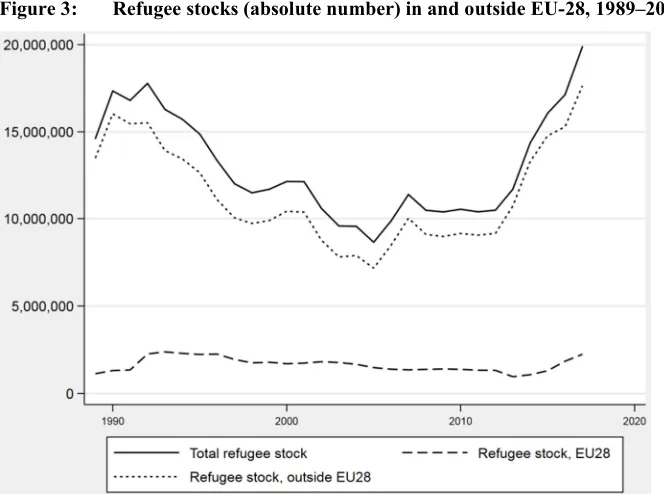
trends of refugee population (stocks) in and outside the EU-28 and for the period 1989– 2017.5
Figure 3: Refugee stocks (absolute number) in and outside EU-28, 1989–2017
Source: Authors’ calculation based on UNHCR data.
In 2017, more than 70% of the total refugee population lived in non-European hosting countries. At the end of 2017, Turkey hosted the most refugees with almost 3.5 million from Syria.6 Pakistan hosted the second largest number of refugees in 2017
(about 1.4 million, with an increase of 3% with respect to the previous year7) and was
5 According to UNHCR, refugees include individuals recognized under the 1951 Convention Relating to the Status of Refugees, its 1967 protocol, and the 1969 Organization of African Unity Convention Governing the Specific Aspects of Refugee Problems in Africa; those recognized in accordance with the UNHCR Statute; individuals granted complementary forms of protection; and those enjoying temporary protection. The refugee population also includes people in refugee-like situations from 2007. UNHCR statistics on refugees include Palestinians living outside the areas of operation of the United Nations Relief and Works Agency (UNRWA) and exclude those living inside the areas of the UNRWA.
6 At the end of 2017, large populations of refugees from Syria were also residing in Lebanon, Jordan, Germany, Iraq, Egypt, and Sweden (UNHCR 2018).
followed by Uganda, which hosts refugees mainly from South Sudan, Congo, Burundi, Somalia, and Rwanda. The number of refugees registered in Lebanon, the fourth largest refugee-host country, remained unchanged from 2016. Iran ranked fifth among the world’s refugee host countries at the end of 2017, followed by Germany, where the refugee population increased by 45% (UNHCR 2018).8
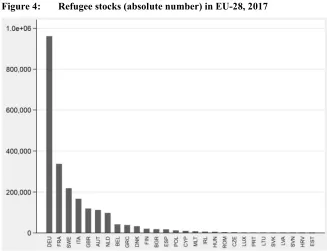
The distribution of the refugee population across the 28 European countries is displayed in Figure 4. In 2017 the highest refugee numbers were recorded in Germany, France, Sweden, Italy, and the United Kingdom. The recent increase in the refugee population in Germany was mainly due to positive decisions on the applications of asylum seekers already under examination and arrivals for resettlement (UNHCR 2018).
Figure 4: Refugee stocks (absolute number) in EU-28, 2017
Source: Authors’ calculation based on UNHCR data.
2.3 Where people are fleeing from
The overall number of new asylum applications and refugees in the EU-28, from the main countries of origin, are shown in Table A-1 in the Appendix. Asylum claims from Syria dominate the global statistics over the whole period in addition to the last few years. Throughout the last decade, as well as for 2017, the major sources of asylum applications in the EU-28 came from Syria, Afghanistan, and Iraq. The most important African sources of new applicants and refugees are the Democratic Republic of Congo, Somalia, Nigeria, and Eritrea.
The intensification of organized violence and conflicts offers a clear explanation for the surge of new asylum applications in Europe from Syria, Afghanistan, and Iraq. However, some countries affected by conflict are both receivers as well as senders of asylum seekers and refugees. Figure 5 shows the evolution of the refugee population of the 2017 top six sending countries to the EU-28.
Figure 5: Refugee stocks in EU-28 by country of origin (countries with the highest total numbers in 2017)
3. Empirical implementation
This section describes the model and data we employ in the empirical analysis.
3.1 Model and data
We estimate panel data models using data disaggregated by the origin country of the asylum seekers (or refugees) and the destination country receiving the application (or hosting the refugee). For asylum seekers, we use UNHCR monthly data on new asylum applications lodged in 44 destination countries, including the EU-28 member states, from 172 (non-European) origin countries for the period 1999–2017.9 Precisely, these data refer to new applications received by the destination countries, excluding repeated and reopened applications.10
Regarding refugees, we use UNHCR data on refugees (including refugee-like situations11), available for the years 1989–2017. The data have information on the population of refugees from about 220 origin countries hosted in 181 destination countries. Annual refugee stocks data reflect not only the number of new individuals granted refugee status but also those already recognized as in need of protection.12
Additionally, we use the residence permits database from Eurostat, available for the period 2008–2017 for all the European countries serving as destinations. These data can be used as a proxy for the flows of new refugees and individuals granted some form of protection.13
9 The country of origin usually refers to place of origin/habitual residence of the asylum claimant. The origin-destination dyads contain the number of applications equal to zero (around 4% of the observations are equal to 0 in the model for the 44 destinations; the number 0 represents around 3% of the total sample in the model for the 28 European destinations).
10 It should be noted that UNHCR provides monthly data on new asylum applications. Since we sum monthly data to have the annual value, possible issues of double-counting may arise if, for instance, an individual submits his asylum application twice in a given year. Double-counting may also arise when individuals submit their applications in two different EU countries (e.g., an asylum seeker in Italy who applies in Sweden and then Germany). We try to mitigate this issue by dropping applications from EU-28 countries lodged in another EU-28 country from our sample (precisely, we dropped 4,799 observations corresponding to the 9% of the total sample from the original data).
11 For the definition of refugees, see Footnote 5.
12 It should be noted that the change of stocks between two periods could be affected by measurement error due to return migration and demographic factors (Ramos 2016). Hence, analyzing stocks data through gravity models is more problematic than analyzing flows. Therefore, the results based on refugee stocks data should be interpreted as robustness checks.
Following the literature on gravity models of migration (Beine, Bertoli, and Fernández-Huertas Moraga 2016; Bertoli and Fernandez-Huertas Moraga 2013), we use the following log-linearized equation with panel data model:
ln( ) = + + + + + + ,
where o indicates the country of origin of the asylum seekers/refugees, d the destination, and t the year. is the ratio between asylum flows (or refugee stocks) from a given origin country to a given destination in a specific year, and the population of the origin country in the same year. Data on the annual total population at the origin country are from the World Bank. The control variable refers to the drivers relative to the origin countries, among them conflict, political terror scale, democracy, and the economic conditions. is the potential destination country-specific pull factors of these international migrations streams. is the time-variant and time-invariant dyadic controls.
The model is estimated using least squares (OLS) dummy variables (year dummies and origin country and destination dummies and ); therefore, all specifications include destination and origin countries fixed effects and have robust standard errors adjusted for clustering at the country-pair level.14
3.2 Conflict and organized violence measures
We use data from the Uppsala Conflict Data Program (UCDP) Georeferenced Event Dataset Global version 18.1 (2017), which reports information on events of organized violence (incidents of lethal violence at a given time and place) according to three types of violence: state-based armed conflicts, non-state conflicts, and one-sided violence. State-based armed conflicts include all conflicts fought over political issues, between and within states, where the confrontation is between the government and a rebel group. UCDP defines state-based armed conflict as a contested incompatibility that concerns government and territory, where the use of armed force between two parties results in at least 25 battle-related deaths in one calendar year.15 Second, non-state conflicts include
all incidents where the use of armed forces between two (formally or informally)
14 Given the presence of a high number of zeros in the observed residence permits variable (around 40% of the total sample), we estimate the model on flows of residence permits using a Poisson pseudo-maximum likelihood (Santos Silva and Tenreyro 2006, 2011).
organized groups results in at least 25 battle-related deaths in a year.16 Lastly, the
one-sided violence category involves lethal violence used by a state (or a formally organized group) against unarmed civilians, identified as the target of the violent attacks.17
We use battle-related deaths as a proxy of the intensity of the conflict.18 The binary
indicator of whether there is conflict or peace in a specific year is the presence of 25 or more battle deaths. We assign a value of 0 if there is peace in a given year and a value of 1 if the lethal events satisfy the UCDP definition of minimum 25 battle-related deaths. The 25 to 1,000 battle deaths dummy indicates the intensity of the armed conflict, and it is equal to 1 if the country reports between 25 and 999 battle deaths in a specific year, and 0 otherwise. The 1,000 or more battle deaths variable is equal to 1 if a country has experienced a conflict with more than 1,000 battle deaths in a specific year and 0 otherwise.19
We think that a critical source of the variation in migration could be explained by the extent to which the territory is affected by organized violence; the larger the area affected by combat, the more people are likely to feel in danger. Therefore, the intensity of conflict measured by the area of the combat might change threat perceptions and insecurity and hence increase the extent of emigration. In our analysis, we calculate the ‘area’ indicator, which indicates the extent to which a country is affected by lethal violence in a state-based armed conflict. Since all events in the UCDP dataset are geo-referenced at the village level, we measure the area associated with every event of a state-based armed conflict on an annual basis and by country.20 Our area measure is the
sum of all conflict zones expressed as percentages of the area of the country (km2) in
which UCDP records lethal events. We recoded the variable as a categorical variable,
16 This category includes, for instance, the confrontations between the Islamic State and Taliban in Afghanistan or the battles over the drug market by cartels in Mexico.
17 This category includes, among others, the killing of civilians in 1998 by the Afghan Taliban government and the massacre perpetrated across northern Uganda by the Ugandan rebel group the Lord’s Resistance Army.
18 This measure includes military and civilian deaths related to battlefield fighting, guerrilla activities, and all kinds of bombardments.
19 The empirical literature refers to conflicts with more than 25 deaths per battle as civil conflicts, while those with more than 1,000 deaths per battle in a given year as civil wars (Blattman and Miguel 2010). While most datasets offer binary indicators to show the presence of conflicts and civil wars, the UCDP dataset provides the number of battle-related casualties, thus allowing for continuous measurement. Our results are consistent when we use both binary indicators of the intensity of the fight and continuous measurement of violence. The corresponding results are presented in Tables 1 and 2.
ranging from 0 to 2 (0 = no conflict or area ≤0.1, 1 if area >0.1 and ≤0.25, and 2 if area >0.25).21
Even if our analysis mainly focuses on the lethal violence generated in state-based armed conflicts, to get a more comprehensive picture of the most recent global violence landscape, we examine all the categories of organized violence separately.22 Results
from UCDP data show a very complex landscape of violence, with growing forms of organized violence, and some societies living simultaneously with multiple forms of violence. The number of casualties due to one-sided violence and non-state conflicts in the origin country’s territory during a specific year (as a share of its population) are our measures of the intensity of these types of organized violence.
In the last few decades, lethal violence has mainly been driven by domestic political violence (state-based armed conflict); however, a still significant proportion of deaths occurred outside of war zones. Regarding the intensity of state-based armed conflicts, the year 2014 was the most violent in the entire post–Cold War period, with the highest number of casualties; this extraordinary increase in fatalities was mainly produced by the escalation of the conflicts in Syria, Iraq, Afghanistan, and Nigeria and by the expansion of the Islamic State (Melander, Pettersson, and Lotta 2016). Since 2014, there has been a decrease both in the number of casualties in state-based armed conflicts and the number of conflicts.23 Figure 6 shows the evolution of the total
number of casualties by the type of organized violence for the period 1989–2017. In 1994, the vast majority of deaths (500,000 civilian deaths) occurred in the Rwandan genocide (one-sided violence). See Appendix for a description of the most recent regional trends for all forms of organized violence.
21 We measure the intersecting areas only once, thus the resulting conflict zones have no overlap. We use GRASS GIS as geo-computation software and the Python Pandas Library as data analysis tools.
22 UCDP defines and records these three types of violence as mutually exclusive.
Figure 6: Battle-related deaths in organized violence, 1989–2017
Source: Authors’ elaboration using UCDP data.
3.3 Control variables
As additional controls, we include in our analysis those variables that have been found to influence forced migration in previous studies (Hatton 2005, 2009, 2011; Neumayer 2004, 2005; Thielemann 2004; Vink and Meijerink 2003). We use the political terror scale (PTS) as an additional measure of one-sided violence and in accordance with the empirical research on asylum flows (Davenport, Moore, and Poe 2003; Moore and Shellman 2004). This index measures the intensity of terror and human rights abuse committed by the state, and it ranges from 1 (no terror) to 5 (terror expanded to the whole population).24 The democracy index is from the Polity IV database and measures the level of institutionalized democracy in the origin country and the extent of civil
liberties granted to citizens in their daily lives.25 Futhermore, the control of corruption
index is a governance indicator that captures all forms of corruption and the extent to which public power is exercised for private gain. Data are from the World Bank, and the index ranges from approximately –2.5 to 2.5. To control for the effects of poverty and economic insecurity, we include the gross domestic product per capita (GDP per capita) in the sending country.26 The economic attractiveness of the destination country
is captured by the employment rate, expressed as the proportion of a country’s working-age population that is employed. Data are from the World Bank. As further controls, we use the World Bank indicators of the annual population growth and the percentage of 15- to 19-year-old males of the total population.
To capture bilateral relationships between countries, we use both time-invariant and time-varying factors. Specifically, migration costs are proxied by the variables distance, language, and colony. The variable (log) distance measures the kilometers between one capital city to the other; the language dummy measures the presence of a common official language, and it equals to unity in case of common language; colony is a dummy picking up post-1945 colonial ties and indicates if a country has been a former colony of a destination country. All those dummies are time-invariant and are taken from theCentre d’Etudes Prospectives et d’Informations Internationales dataset. Moreover, we include the (lagged) stock of total migrants from the same origin country of those individuals asking for asylum (or having the refugee status) to control for network effects.27 The migrant stocks from a given origin country residing in a given
destination are from the United Nations Department of Economic and Social Affairs. As an additional control variable of the bilateral relationship between the origin country and a destination within the EU, we use the total recognition rate of asylum application claims (Hatton 2004, 2009; Neumayer 2005; Keogh 2013; Toshkov 2014; Vink and Meijerink 2003; Toshkov and de Haan 2013).28 We measure this variable as
the share of the first-instance positive decisions on the total number of decisions at first instance (including recognition for humanitarian status) with data from Eurostat. In this analysis, we use the recognition rate as a proxy for the destination country’s propensity to recognize claims of individuals from a given origin country. To partially address the issue of reverse causality between asylum applications and the recognition rate, we use
25 We recoded the original variable as a dummy variable, and we assigned the value of 1 to countries with at least 4 (on the scale of 0 to 10) and 0 otherwise. The democracy dummy received yearly value of 0 in the recoding during interruption or transition cases.
26 Data are taken from the World Bank and are at purchaser’s prices and in constant 2010 US dollars. 27 We use the natural log of the migration stock to reduce its distributional spread. Similarly, in our analysis, GDP per capita is log transformed.
the recognition rate lagged by one year, as already done by Holzer and Schneider (2002) and Neumayer (2004).
4. Findings
4.1 Estimates of new asylum flows
Table 1 reports estimation results for the model on asylum applications. Columns 1 to 3 show the results for 44 destination countries, whereas Columns 4 and 5 restrict the sample to 28 European member states as destinations. Starting with Column 1, we use the definition of at least 25 battle-related deaths caused by a (lagged) conflict.29 Column 2 adds a more strict definition of conflict, using the two conflict incidence measures. In this specification, we include the dummy 25 to 1,000 battle deaths to check whether people left their country before the situation had escalated into a conflict of more than 1,000 deaths in a given year, as well as the dummy indicating more than 1,000 battle-related deaths in a conflict zone. Column 3 adds the area affected by high-intensity conflicts. Columns 4 and 5 display results for 28 destination European countries, with Column 4 recalling the specifications of Column 3 of Table 1 for comparison purposes.
The PTS is one of the most critical source country variables affecting asylum applications in our regressions. The PTS is positively associated with new asylum claims and statistically significant at 1% in all specifications in Table 1. Regression results show a positive cross-lagged relation between the origin country exposure to conflict violence and new asylum seekers from that origin country (Column 1 of Table 1). In Column 2, we find a positive and significant relation between low-intensity conflicts and the number of people applying for asylum. However, this association is low when compared with the asylum claims of applicants from countries affected by conflict with more than 1,000 battle-related casualties. Therefore, the higher the severity of lethal events in the country of origin, the higher the flows of those seeking asylum are. Conflict area significantly influences new applications of asylum seekers in the predicted way. Indeed, results (Columns 3 and 4) suggest the greater the geographic extent of the fighting in high-intensity conflicts, the higher the dependent variable is toward each destination sample.30
29 In all specifications, we include the variables on conflicts lagged by one year to account for the time lag between conflicts and the concrete application for asylum.
Table 1: OLS regressions: Estimates of new asylum flows Dep. variable:
, ,
,
44 destinations 28 European destinations
(1) (2) (3) (4) (5)
Political terror scale (or) 0.169*** 0.156*** 0.149*** 0.135*** 0.0873*** (0.137 – 0.200) (0.125 – 0.187) (0.118 – 0.181) (0.0973 – 0.172) (0.0371 – 0.137) 25+ battle deaths (or) 0.139***
(0.0734 – 0.205)
25–1,000 battle deaths (or) 0.0810** 0.0562* 0.0743* 0.0463 (0.0166 – 0.145) (–0.00779 – 0.120) (–0.00417 – 0.153) (–0.0461 – 0.139) 1,000+ battle deaths (or) 0.363*** 0.249*** 0.267*** 0.187**
(0.251 – 0.475) (0.136 – 0.362) (0.133 – 0.401) (0.0203 – 0.354) Area of conflict (or) 0.564*** 0.563*** 0.246
(0.408 – 0.719) (0.381 – 0.746) (–0.0955 – 0.587) Democracy (or) –0.162*** –0.178*** –0.142*** –0.187*** –0.203***
(–0.255 – –0.0688) (–0.269 – –0.0862) (–0.234 – –0.0506) (–0.293 – –0.0814) (–0.331 – –0.0759) Control corruption (or) –0.0145 –0.0269 –0.0477 –0.0240 0.154
(–0.139 – 0.110) (–0.150 – 0.0967) (–0.171 – 0.0755) (–0.173 – 0.125) (–0.0678 – 0.376) Log migrant stock (lag dyad) 0.339*** 0.339*** 0.340*** 0.319*** 0.339***
(0.303 – 0.376) (0.303 – 0.375) (0.303 – 0.376) (0.280 – 0.357) (0.296 – 0.383) Log GDP per capita (or) –1.004*** –0.969*** –1.026*** –1.159*** –1.486***
(–1.202 – –0.806) (–1.167 – –0.772) (–1.223 – –0.830) (–1.389 – –0.929) (–1.866 – –1.105) Employment rate (dest) 0.0461*** 0.0457*** 0.0457*** 0.0435*** 0.0654***
(0.0317 – 0.0604) (0.0314 – 0.0601) (0.0315 – 0.0600) (0.0279 – 0.0591) (0.0454 – 0.0853) Common language (dyad) 0.220*** 0.220*** 0.219*** 0.475*** 0.381***
(0.0551 – 0.384) (0.0550 – 0.384) (0.0546 – 0.384) (0.248 – 0.703) (0.139 – 0.622) Log distance (dyad) –0.773*** –0.773*** –0.774*** –0.107 0.0129
(–0.930 – –0.617) (–0.930 – –0.617) (–0.930 – –0.617) (–0.350 – 0.136) (–0.252 – 0.278) Colony (dyad) 0.144 0.146 0.145 0.153 0.182
(–0.120 – 0.408) (–0.118 – 0.410) (–0.119 – 0.409) (–0.129 – 0.436) (–0.118 – 0.482) Population growth (or) –0.0557** –0.0535** –0.0323 –0.0362 –0.0750**
(–0.0986 – –0.0128) (–0.0964 – –0.0106) (–0.0746 – 0.0101) (–0.0880 – 0.0155) (–0.145 – –0.00487) Young male pop. (or) 0.0483** 0.0461** 0.0483** 0.0694*** 0.0360
(0.00837 – 0.0882) (0.00633 – 0.0859) (0.00864 – 0.0879) (0.0212 – 0.118) (–0.0357 – 0.108) Recognition rates (lag) (dyad) 11.66***
(8.759 – 14.55) Constant –9.404*** –9.706*** –9.769*** –9.406*** –8.639***
(–11.41 – –7.397) (–11.71 – –7.700) (–11.77 – –7.772) (–12.19 – –6.627) (–12.34 – –4.944) Observations 27,057 27,057 27,057 19,154 10,004 R-squared 0.703 0.704 0.705 0.712 0.744 Adjusted R-Squared 0.701 0.701 0.702 0.708 0.739 Country (or, dest) dummies YES YES YES YES YES Year dummies YES YES YES YES YES
Note: 95% confidence intervals level are in parentheses, and robust standard errors are clustered at the country-pair level. *** p<0.01, ** p<0.05, * p<0.1. Specifications (1) to (4) are estimated for the period 1999–2017. Specification (5) is estimated for the period 2008–2017.
shown in Columns 1 through 5, a significant and negative association with the dependent variable. The presence of democratic institutions at the origin country, resulting in the general respect of human rights and the rule of law, is highly (negatively) influential on new asylum seekers. On the other hand, the perception of a less corrupt system in the country of origin is not significantly associated with filing asylum applications.31 Overall, these results confirm that threats stemming from
political terror, human rights violations, and civil wars are positively associated with asylum flows. Our results are in line with the existing empirical evidence that is used to predict asylum applications (Hatton 2009; Neumayer 2005; Moore and Shellman 2007). Economic conditions, both in destination and origin countries, significantly influence the flows of new asylum seekers. Increasing GDP per capita at the country of origin is significantly related to lower asylum claims for all destinations. The (log) coefficient of the GDP has a negative and 1% significant effect in all specifications: A 1% increase in GDP per capita tends to reduce our dependent variable by about 1%. The economic attractiveness of a destination country, captured by employment rates, acts as a pull for asylum claims. Countries with better economic and labor opportunities are more attractive. Both economic and conflict-related variables are significant in all specifications, suggesting that individuals seeking asylum escape from adverse and unfavorable conditions related to war, violence, and weak economic conditions.
In the destination country, the presence of previous migrant communities is a key pull factor attracting new asylum applications. The presence of migrant stock is significant at 1% for all specifications, with a positive relation to our dependent variable. Therefore, these estimations suggest that members from the same community who have already moved to another country can reduce the risks, costs, and complexity of migration by providing support and assistance. Our results confirm the migration networks effect as a critical pull factor for new asylum applications (Davenport, Moore, and Poe 2003; Neumayer 2004; Hatton 2009; Keogh 2013).
Geographical distance between capital cities tends to discourage applications for asylum (Columns 1 through 3 of Table 1). However, distance is no longer a significant factor associated with new asylum applications when we restrict the sample to EU-28 destinations. The presence of a former colonial link does not affect the dependent variable,32 whereas the existence of the same official or predominant spoken language
in the origin and destination countries facilitates asylum applications in all specifications. The common language variable has a higher association with asylum applications in the model restricted to European destinations. This result could be
31 Only few studies have analyzed the relationship between corruption and migration. Results show that corruption leads to migration, especially for highly skilled migrants. However, in the case of low-skilled migrants from low- and middle-income countries, the effect of corruption decreases once a certain level of corruption is reached (Cooray and Schneider 2014).
primarily driven by Africa- and Latin America–specific migration patterns to France, Spain, Italy, and the United Kingdom (Columns 4 and 5). Linguistic proximity therefore exerts a significant effect in shaping the incentives to migrate internationally and has an additional effect beyond its influence through diasporas; familiarity with languages could lower the cost of adapting to a new country (Toomet 2011). In line with previous empirical evidence, the historical migration patterns and a common spoken official language (but not colonial legacies) suggest that some destination countries are more attractive than others (Neumayer 2004).
The composition and age structure of the population may also explain asylum application patterns since some segments of the population are more likely to migrate than others. Specifically, we find that the higher the share of the young males aged 15 to 19 years old in the country of origin, the higher number of asylum claims there are (Columns 1 through 4 in Table 1). Therefore, young cohorts are much more willing to migrate than old groups. Rapid population growth is significantly correlated with lower forced emigration (Columns 1, 2, and 5). One possible reason for this negative association might be that population growth is concentrated in the least developed countries, where poverty limits the mobility of citizens, including forced migration.33
Another critical dyadic component of the asylum destination choice within Europe is the recognition rate. Column 5 of Table 1 adds past recognition rates of asylum applications as a proxy for the destination country’s propensity to accept applications of asylum seekers from a given origin country.34 We look at decisions, either positive or
total, including all kinds of categories of protection (i.e., humanitarian, subsidiary, temporary, and Geneva Convention protection). As expected, the recognition rate of applications from a given origin country positively influences the rate of inflows of new claims from that origin country to a specific European destination. As found in Neumayer (2004), a higher recognition rate in the previous year is associated with a higher share of asylum seekers the following year.
33 See European Commission (2018).
4.2 Estimates of new asylum flows and different forms of organized violence
We examine all the categories of organized violence separately to get a more accurate picture of the recent worldwide violence landscape.35 Regression results by type of
organized violence are reported in Table 2. Our findings show that the number of total casualties generated by civil wars, non-state based violence, and one-sided violence against unarmed civilians (on the population at the country of origin) is positively associated to new asylum applications. The higher the number of deaths caused by any form of organized violence, the higher the number of first asylum applications. These results suggest that people not only flee terror and war but also violence and insecurity emerging from non-conflict-affected areas and perpetrated by different criminal actors.
Column 1 and 4 of Table 2 report fixed-effects results on new asylum applications with the continuous measure of casualties in the battlefield. Overall, these results confirm findings presented in Table 1. Political terror and conflicts are primary explanatory variables of new asylum applications in all destination countries, with a positive and significant coefficient. Column 2 and 5 report the results of the association between non-state violence and asylum applications, which suggest a significant and positive association. Column 3 and 6 explore the impact of one-sided violence (committed by state and non-state actors).36 Our results suggest that the intensity of
state and non-state violence is positively associated with the increasing number of asylum claims. Most of the countries with lethal events of one-sided violence also produce external forced migration.
35For the impact of organized crime on international security, see De Boer and Rosetti (2015); Bosetti, Cockayne, and De Boer (2016); Briscoe (2015). For the interaction between organized violence and war, see the analysis of Lacher (2012) for Mali, and Goodhand (2008) for Afghanistan.
Table 2: OLS regressions: Estimates of new asylum flows, by type of organized violence
Dep. variable:
, ,
,
Conflict Non-stateviolence One-sidedviolence Conflict Non-stateviolence One-sidedviolence 44 Dest 44 Dest 44 Dest 28 Dest 28 Dest 28 Dest
(1) (2) (3) (4) (5) (6)
Political terror scale (or) 0.0947*** 0.0335 0.101*** 0.0639* –0.0107 0.0864*** (0.0409 – 0.149) (–0.0291 – 0.0961) (0.0484 – 0.153) (–0.00345 – 0.131) (–0.0876 – 0.0663) (0.0210 – 0.152) (log) Conflict deaths/origin pop 0.0633*** 0.0623***
(0.0428 –
0.0839) (0.0384 –0.0862)
(log) Non-state deaths/origin pop 0.0545*** 0.0689*** (0.0314 –
0.0776) (0.0402 –0.0976)
(log) One-sided deaths/origin pop 0.0555*** 0.0442*** (0.0335 –
0.0776) (0.0184 –0.0700) Democracy (or) –0.0893 –0.132 –0.0297 –0.170** –0.166 –0.0639
(–0.241 – 0.0626) (–0.308 – 0.0443) (–0.176 – 0.116) (–0.337 – –0.00169) (–0.367 – 0.0357) (–0.226 – 0.0978) Control corruption (or) –0.153 0.193 0.120 –0.125 0.163 0.176
(–0.349 –
0.0430) (–0.104 –0.490) (–0.108 –0.348) (–0.352 –0.102) (–0.160 –0.485) (–0.0890 –0.441) Log migrant stock (lag dyad) 0.389*** 0.424*** 0.403*** 0.386*** 0.434*** 0.404***
(0.333 –
0.446) (0.356 –0.493) (0.337 –0.469) (0.324 –0.449) (0.360 –0.509) (0.327 –0.481) Log GDP per capita (or) –0.588*** –0.653*** –0.573*** –0.690*** –0.977*** –0.747***
(–0.898 – –0.278) (–1.046 – –0.260) (–0.929 – –0.217) (–1.071 – –0.310) (–1.460 – –0.493) (–1.189 – –0.305) Employment rate (dest) 0.0545*** 0.0477*** 0.0541*** 0.0494*** 0.0482*** 0.0483***
(0.0326 – 0.0765) (0.0192 – 0.0762) (0.0309 – 0.0774) (0.0255 – 0.0734) (0.0179 – 0.0786) (0.0228 – 0.0737) Common language (dyad) 0.349*** 0.230 0.349*** 0.374** 0.448** 0.474***
(0.113 –
0.586) (–0.0532 –0.513) (0.116 –0.581) (0.0598 –0.687) (0.0946 –0.801) (0.169 –0.778) Distance (dyad) –0.900*** –1.048*** –1.189*** –0.324 –0.240 –0.484**
(–1.173 –
–0.627) (–1.418 ––0.678) (–1.463 ––0.914) (–0.754 –0.106) (–0.853 –0.374) (–0.958 ––0.0106) Colony (dyad) –0.202 0.168 –0.1000 –0.185 0.0376 –0.135
(–0.597 – 0.193) (–0.228 – 0.564) (–0.472 – 0.272) (–0.562 – 0.193) (–0.376 – 0.451) (–0.498 – 0.229) Population growth (or) –0.198*** –0.0991*** –0.156*** –0.200*** –0.0974** –0.154***
(–0.284 –
–0.111) (–0.169 ––0.0296) (–0.240 ––0.0712) (–0.300 ––0.101) (–0.177 ––0.0182) (–0.250 ––0.0574) Young male pop. (or) 0.0607** –0.122* 0.105** 0.0630* –0.138* 0.123**
(0.00492 –
0.116) (–0.248 –0.00380) (0.0245 –0.185) (–0.00630 –0.132) (–0.297 –0.0203) (0.0212 –0.224) Constant –9.960*** –1.756 –8.201*** –8.707*** –5.434 –7.907***
(–13.07 –
–6.848) (–6.752 –3.240) (–11.66 ––4.742) (–13.31 ––4.106) (–12.28 –1.415) (–13.26 ––2.555) Observations 10,127 5,913 9,020 7,295 4,180 6,424 R-squared 0.709 0.754 0.728 0.715 0.764 0.729 Country (or, dest) dummies YES YES YES YES YES YES Year dummies YES YES YES YES YES YES
4.3 Estimates of refugee stocks
Table 3 shows results of refugee stocks. In this set of analyses, as the dependent variable we use the stock of refugees from a given country of origin (or last residence) residing either in any of the EU-28 member states or the 181 receiving countries with available data, over the total population in the country of origin, in natural logarithm. The period covered by these data is 1989–2017. It should be noted that while for asylum we use data on new applications (i.e., flows), UNHCR data on refugees and refugee-like situations are taken from stocks. As previously mentioned, annual stock data reflect the number of not only new individuals granted refugee status but also those already recognized as in need of protection.
Table 3: OLS regressions: Estimates of refugee stocks Dep. variable:
, ,
,
(1) (2) (3) (4) (5) (6)
181 Dest 181 Dest 181 Dest 28 Dest 28 Dest 28 Dest
Political terror scale (or) 0.0998*** 0.0978*** 0.0967*** 0.119*** –0.0247 –0.0348 (0.0699 –
0.130) (0.0683 –0.127) (0.0670 –0.126) (0.0838 –0.155) (–0.0595 –0.0101) (–0.141 –0.0709) 25+ battle deaths (or) 0.134***
(0.0699 – 0.198)
25–1,000 battle deaths (or) 0.124*** 0.121*** 0.108*** 0.0546 –0.119 (0.0591 – 0.190) (0.0551 – 0.186) (0.0302 – 0.185) (–0.0195 – 0.129) (–0.280 – 0.0415) 1000+ battle deaths (or) 0.173*** 0.159*** 0.143** 0.0830 0.151
(0.0780 –
0.268) (0.0628 –0.256) (0.0293 –0.257) (–0.0487 –0.215) (–0.114 –0.416) Area of conflict (or) 0.0716 0.0902 –0.307* 0.123
(–0.0680 –
0.211) (–0.0705 –0.251) (–0.659 –0.0442) (–0.258 –0.504) Democracy (or) 0.0179 0.0148 0.0199 0.0463 0.107** –0.287*
(–0.0669 – 0.103) (–0.0697 – 0.0993) (–0.0644 – 0.104) (–0.0538 – 0.146) (0.00868 – 0.206) (–0.617 – 0.0440) Control corruption (or) –0.127* –0.128* –0.131* –0.106 0.0780 –0.623*
(–0.260 –
0.00642) (–0.261 –0.00474) (–0.264 –0.00218) (–0.266 –0.0549) (–0.0965 –0.253) (–1.272 –0.0274) Log migrant stock (lag dyad) 0.429*** 0.429*** 0.429*** 0.411*** 0.393*** 0.494***
(0.392 –
0.466) (0.392 –0.466) (0.392 –0.466) (0.367 –0.455) (0.347 –0.439) (0.383 –0.605) Log GDP per capita (or) –0.495*** –0.491*** –0.497*** –0.451*** –0.739*** –0.921
(–0.709 – –0.281) (–0.704 – –0.277) (–0.712 – –0.283) (–0.707 – –0.195) (–1.026 – –0.452) (–2.099 – 0.258) Employment rate (dest) –0.0306*** –0.0307*** –0.0306*** –0.0301*** –0.0579*** 0.0566*
(–0.0442 –
–0.0170) (–0.0443 ––0.0171) (–0.0442 ––0.0170) (–0.0448 ––0.0155) (–0.0760 ––0.0398) (–0.00144 –0.115) Common language (dyad) 0.114 0.114 0.114 0.257* 0.273* 0.628**
(–0.0632 –
0.291) (–0.0631 –0.291) (–0.0632 –0.291) (–0.0264 –0.541) (–0.00877 –0.555) (0.0616 –1.194) Log distance (dyad) –0.152** –0.152** –0.152** 0.265** 0.257* –1.298***
(–0.284 – –0.0200) (–0.284 – –0.0200) (–0.285 – –0.0201) (0.0169 – 0.514) (–0.00279 – 0.517)
Table 3: OLS regressions: Estimates of refugee stocks Dep. variable:
, ,
,
(1) (2) (3) (4) (5) (6)
181 Dest 181 Dest 181 Dest 28 Dest 28 Dest 28 Dest
Colony (dyad) 0.221 0.221 0.222 0.265 0.349* –0.876*** (–0.0857 – 0.528) (–0.0854 – 0.528) (–0.0853 – 0.528) (–0.0992 – 0.630) (–0.00367 – 0.701)
(–1.525 – – 0.227) Population growth (or) 0.0584*** 0.0589*** 0.0614*** 0.0678** 0.0174 –0.257*
(0.0155 –
0.101) (0.0160 –0.102) (0.0184 –0.104) (0.0141 –0.121) (–0.0377 –0.0725) (–0.547 –0.0339) Young male pop. (or) 0.0531*** 0.0524*** 0.0523*** 0.0453** 0.00747 0.115*
(0.0149 –
0.0912) (0.0143 –0.0906) (0.0141 –0.0905) (0.000603 –0.0900) (–0.0495 –0.0645) (–0.0152 –0.246) Recognition rates (lag) (dyad) 15.18***
(11.64 – 18.71)
Constant –12.64*** –12.69*** –12.69*** –12.61*** –7.063*** 13.15** (–14.57 –
–10.72) (–14.61 ––10.76) (–14.62 ––10.77) (–15.41 ––9.819) (–10.29 ––3.832) 24.50)(1.804 – Observations 33,754 33,754 33,754 23,493 11,932 20,743 R-squared 0.753 0.753 0.753 0.755 0.801 0.497 Country (or, dest) dummies YES YES YES YES YES YES Year dummies YES YES YES YES YES YES
Note: 95% confidence intervals level are in parentheses, and robust standard errors are clustered at the country-pair level. *** p<0.01, ** p<0.05, * p<0.1. While specifications (1) to (4) are estimated for the period 1989–2017, specification (5) is estimated for the period 2008–2017 and specification (6) is estimated for the period 2008–2017 with a PPML estimator on Flows of Residence Permits.
The exposure to conflict (lagged by one year) is positive and significantly related to stocks of refugees (Column 1 in Table 3). Higher values of the PTS (Columns 1 through 4) and presence of low- and high-intensity conflicts (Columns 2 through 4) are positively and significantly linked to refugees, with the effect of the more extreme political events (high-intensity conflict) found to be slightly higher in comparison to low-intensity violence; the geographic spread of previous conflicts is not significantly associated with the relative number of refugees. The lack of democracy does not appear to be a key push factor since it is significant only in Columns 5 and 6 (and with opposite signs); this is perhaps because “severe autocracies manage to control their borders more tightly and make emigration more difficult” (Hoeffler 2013). The control of corruption in the exercise of public power is slightly associated with lower stocks of refugees.
from the destination country the fewer refugees we observe. Former colonial relationships do not in themselves explain refugee patterns. We find a high correlation between (lagged) recognition rates and refugee stocks in the EU-28 (Column 5).
Column 6 displays the results on first residence permits (flows) issued to non-EU citizens. The dependent variable is the total number of residence permits from an origin country to a European destination. As previously mentioned, we use a Ppml estimator due to the presence of zeros in approximately 40% of the country dyads. Our measures of conflict-related violence and the proportion of territory affected are not significantly associated with new resident permits granted in Europe.
5. Conclusions
In this paper we conducted an econometric exploration of the factors associated with new asylum applications and growing refugee stocks in and outside Europe by using data disaggregated by the origin country of asylum seekers (or those granted the refugee status) and by the destination receiving the asylum claims (or hosting refugees). Results show that the relative number of recent asylum applications is explained by the intensity of the fight and the geographical spread of lethal violence in state-based armed conflicts. By using the most recent available data with information on direct battle-related casualties, we find a strong and positive association between new asylum applications and conflicts with the highest concentration of lethal violence in the country of origin. By analyzing geographic information of all events of lethal violence in high-intensity conflicts, we find that the proportion of the territory affected is a key factor in explaining the magnitude of new asylum applications. Therefore, the severity of conflict measured by the area of the combat might change threat perceptions and hence increase the magnitude of forced migration. Importantly, we have also provided evidence that past conflicts and their intensity exert influence on the size of the refugee population. Other forms of organized violence and political terror exert their influence on the number of new asylum applications, showing that people also flee violence and insecurity emerging from non-conflict-affected areas. Overall, these results suggest that future research on the determinants of forced international migration should consider both the intensity of all violence types but also the effects that different forms of organized violence may have depending on the location, goals, criminal actors involved, and economic and social relationship to the populations.
at the EU-28, we confirm that destination country policies, as measured by the recognition rates, are significantly associated with encouraging higher numbers of asylum applications.
Overall, our findings suggest that besides exposure to insecurity, organized violence, war, and terror, other drivers exert a substantial role in explaining forced international migration. Namely, individuals tend to escape from unfavorable economic and political conditions, and they are strongly attracted by the presence of previous migrant communities in the destination country and a common spoken language.
6. Acknowledgements
We thank two anonymous referees for their helpful suggestions. We are grateful to Fabrizio Natale, Alfredo Alessandrini, Marco Scipioni, Nikolaos Stilianakis, Daniela Ghio, and Erofili Grapsa for comments and suggestions.
Corrections:
References
Allansson, M., Melander, E., and Themnér, L. (2017). Organized violence, 1989–2016.
Journal of Peace Research 54(4): 574–587.doi:10.1177/0022343317718773.
Balch-Lindsay, D., Enterline, A.J., and Joyce, K.A. (2008). Third-party intervention and the civil war process. Journal of Peace Research 45(3): 345–363.
doi:10.1177/0022343308088815.
Beine, M., Bertoli, S., and Fernández-Huertas Moraga, J. (2016). A practitioners’ guide to gravity models of international migration.The World Economy 39(4): 496– 512.doi:10.1111/twec.12265.
Bertoli, S. and Fernández-Huertas Moraga, J. (2013). Multilateral resistance to migration. Journal of Development Economics 102: 79–100. doi:10.1016/j. jdeveco.2012.12.001.
Blattman, C. and Miguel, E. (2010). Civil war.Journal of Economic Literature 48(1): 3–57.doi:10.1257/jel.48.1.3.
Bosetti, L., Cockayne, J., and de Boer, J. (2016). Crime-proofing conflict prevention, management, and peacebuilding: A review of emerging good practice. Tokyo: United Nations University Centre for Policy Research (Occasional Paper 6).
http://collections.unu.edu/eserv/UNU:5850/OC_06_Crime_proofing_Conflict. pdf.
Briscoe, I. (2015). A violent compound: Competition, crime, and modern conflict. Oslo: Norwegian Peacebuilding Resource Centre (NOREF Report).
Cooray, A. and Schneider, F. (2014). Does corruption promote emigration? An empirical examination. Bonn: Institute for the Study of Labor (IZA World of Labor 192).doi:10.15185/izawol.192.
Davenport, C., Moore, W., and Poe, S. (2003). Sometimes you just have to leave: Domestic threats and forced migration, 1964–1989. International Interactions
29(1): 27–55.doi:10.1080/03050620304597.
European Commission (2018). Many more to come? Migration from and within Africa. Luxembourg: Joint Research Centre. https://ec.europa.eu/jrc/sites/jrcsh/files/ africa_policy_report_2018_final.pdf.
Goodhand, J. (2008). Corrupting or consolidating the peace? The drugs economy and post-conflict peacebuilding in Afghanistan. International Peacekeeping 15(3): 405–423.doi:10.1080/13533310802058984.
Hatton, T.J. (2004). Seeking asylum in Europe. Economic Policy 19(38): 6–62.
doi:10.1111/j.1468-0327.2004.00118.x.
Hatton, T.J. (2009). The rise and fall of asylum: What happened and why?Economic
Journal 119(535): F183–F213.doi:10.1111/j.1468-0297.2008.02228.x.
Hatton, T.J. (2016). Refugees, asylum seekers, and policy in OECD countries.
American Economic Review 106(5): 441–445.doi:10.1257/aer.p20161062.
Hoeffler, A. (2013). Out of the frying pan into the fire? Migration from fragile states to fragile states. Paris: OECD (OECD Development Co-operation Working Paper 9).doi:10.1787/5k49dffmjpmv-en.
Holzer, T. and Schneider, G. (2002).Asylpolitik auf Abwegen: Nationalstaatliche und
Europäische Reaktionen auf die Globalisierung der Flüchtlingsströme. Opladen:
Leske und Budrich.
Keogh, G. (2013). Modelling asylum migration pull force factors in the EU 15. The
Economic and Social Review44(3): 371–399.
Lacher, W. (2012). Organized crime and conflict in the Sahel-Sahara region. Washington, D.C.: Carnegie Endowment for International Peace.
Melander, E. and Öberg, M. (2007). The threat of violence and forced migration: Geographical scope trumps intensity of fighting. Civil Wars 9(2): 156–173.
doi:10.1080/13698240701207310.
Melander, E., Pettersson, T., and Lotta, T. (2016). Organized violence, 1989–2015.
Journal of Peace Research53(5): 727–742.doi:10.1177/0022343316663032.
Moore, W.H. and Shellman, S.M. (2004). Fear of persecution: Forced migration, 1952– 1995. Journal of Conflict Resolution 48(5): 723–745. doi:10.1177/0022002 704267767.
Moore, W.H. and Shellman, S.M. (2006). Refugee or internally displaced person? To where should one flee? Comparative Political Studies 39(5): 599–622.
Moore, W.H. and Shellman, S.M. (2007). Whither will they go? A global study of refugees’ destinations, 1965–1995.International Studies Quarterly51(4): 811– 834.doi:10.1111/j.1468-2478.2007.00478.x.
Neumayer, E. (2004). Asylum destination choice: What makes some West European countries more attractive than others?European Union Politics 5(2): 155–180.
doi:10.1177/1465116504042444.
Neumayer, E. (2005). Asylum recognition rates in Western Europe: Their determinants, variation, and lack of convergence.Journal of Conflict Resolution 49(1): 43–66.
doi:10.1177/0022002704271057.
Ramos, R. (2016). Gravity models: A tool for migration analysis. Bonn: Institute for the Study of Labor (IZA World of Labor 239).doi:10.15185/izawol.239.
Santos Silva, J.M.C. and Tenreyro, S. (2006). The log of gravity.Review of Economics
and Statistics 88(4): 641–658. doi:10.1162/rest.88.4.641.
Santos Silva, J.M.C. and Tenreyro, S. (2011). Poisson: Some convergence issues.Stata
Journal 11(2): 207–212.doi:10.1177/1536867X1101100203.
Schmeidl, S. (1997). Exploring the causes of forced migration: A pooled time-series analysis, 1971–1990.Social Science Quarterly 78(2): 284–308.
Thielemann, E.R. (2004). Why asylum policy harmonisation undermines refugee burden-sharing. European Journal of Migration and Law 6(1): 47–65.
doi:10.1163/1571816041518769.
Thielemann, E.R. (2006). The effectiveness of governments’ attempts to control unwanted migration. In: Parsons, C.A. and Smeeding, T.M. (eds.).Immigration
and the transformation of Europe. Cambridge: Cambridge University Press:
442–472.doi:10.1017/CBO9780511493577.017.
Toomet, O. (2011). Learn English, not the local language! Ethnic Russians in the Baltic States.American Economic Review101(3): 526–531.doi:10.1257/aer.101.3.526.
Toshkov, D.D. (2014). The dynamic relationship between asylum applications and recognition rates in Europe (1987–2010).European Union Politics 15(2): 192– 214.doi:10.1177/1465116513511710.
Toshkov, D.D. and de Haan, L. (2013). The Europeanization of asylum policy: An assessment of the EU impact on asylum applications and recognition rates.
Journal of European Public Policy 20(5): 661–683. doi:10.1080/13501763.
UN High Commissioner for Refugees (UNHCR) (2018). Global trends: Forced displacement in 2017. Geneva: UNHCR. https://www.refworld.org/docid/ 5b2d1a867.html.
Vink, M. and Meijerink, F. (2003). Asylum applications and recognition rates in EU member states 1982–2001: A quantitative analysis. Journal of Refugee Studies
16(3): 297–315.doi:10.1093/jrs/16.3.297.
Appendix: Descriptive statistics
Table A-1: Total numbers of asylum seekers and refugees by top-20 sending countries into EU-28
Asylum seekers, 1999–2017 Refugee stocks, 2017
Syria 1,038,819 Syria 786,641 Afghanistan 736,573 Afghanistan 220,100 Iraq 651,271 Iraq 204,305 Serbia and Kosovo 558,309 Eritrea 124,765 Russian Federation 362,703 Somalia 96,065 Pakistan 302,584 Iran 81,358 Nigeria 263,405 Russian Federation 52,342 Iran 252,282 Turkey 38,071 Somalia 244,605 Sri Lanka 36,012 Turkey 218,083 Pakistan 34,196 Eritrea 190,363 Nigeria 28,722 Albania 179,917 Serbia and Kosovo 27,527 Bangladesh 146,771 Sudan 26,309 China 140,740 Dem. Rep. of the Congo 22,197 Dem. Rep. of the Congo 127,927 Mali 18,052 Georgia 125,027 Guinea 16,971 Algeria 115,220 Bangladesh 13,521 Sri Lanka 111,625 Gambia 12,829 India 107,756 Ethiopia 11,852 Armenia 100,757 Cambodia 11,413
Source: Authors’ elaboration using UNHCR data.
Regional trends by type of organized violence, 1989–2017
Figure A-1: Casualties in state-based armed conflicts by regions, 1989–2017
Source: Author’s elaboration using UCDP data.
The most common type of non-state conflict in the last few years was between rebel groups and militias in Syria, and drug cartels in Mexico (Melander, Pettersson, and Lotta 2016). In 2016–2017, the majority of non-state conflicts took place in Africa, while the Middle East experienced a slight decrease in the last year. America is in second place, with violence mostly driven by the cartels war in Mexico; in Asia, the trend was mainly driven by violent events in Syria, Afghanistan, Myanmar (Burma), and Pakistan.
Figure A-2: Casualties in non-state conflicts by regions, 2000–2017
Source: Authors’ elaboration using UCDP data.
Figure A-3: Casualties in one-sided violence by regions, 2000–2017