VOLUME 39, ARTICLE 47, PAGES 1291
,
1304
PUBLISHED 18 DECEMBER 2018
https://www.demographic-research.org/Volumes/Vol39/47/ DOI: 10.4054/DemRes.2018.39.47
Descriptive Finding
Higher acceptance rates of asylum seekers lead
to slightly more asylum applications in the
future
Hannes Weber
© 2018 Hannes Weber.
This open-access work is published under the terms of the Creative Commons Attribution 3.0 Germany (CC BY 3.0 DE), which permits use, reproduction, and distribution in any medium, provided the original author(s) and source are given credit.
1 Introduction 1292
2 Data and measures 1293
3 Results 1295
4 Conclusion 1301
Higher acceptance rates of asylum seekers lead to
slightly more asylum applications in the future
Hannes Weber1
Abstract
BACKGROUND
There is much discussion about whether high acceptance rates of asylum applications lead to a greater inflow of asylum seekers to Europe. To date, little is known about this relationship before and after the peak of the so-called refugee crisis of 2015. While Syrian and Iraqi inflows decreased after 2015, African asylum seekers became more numerous, their numbers tripling between 2008 and 2018.
OBJECTIVE
We study the two-way relationship between the number of asylum applications from Africans and African refugee acceptance rates in Europe.
METHODS
We compile quarterly data from 2008 to 2018 on 1,488 country dyads of 48 African and 31 European countries and estimate fixed effects panel models with different lags of the variables of interest.
RESULTS
We find robust evidence for a positive effect of acceptance rates on the number of subsequent asylum applications in the respective countries. However, this effect is rather small in size. Conversely, more applications can prompt authorities to accept fewer asylum seekers, but evidence for this effect is much weaker.
CONCLUSIONS
Higher acceptance rates lead to a greater number of asylum seekers, but formal protection rates cannot explain the substantial increase in asylum applicants from Africa to Europe that has continued since the ‘refugee crisis’ of 2015. Besides informal practices, which can play a role, the self-reinforcing nature of migration is a major driver of the current increase in inflows.
1 Mannheimer Zentrum für Europäische Sozialforschung (MZES), Universität Mannheim, Germany.
CONTRIBUTION
This is the first study to analyze country-to-country flows of asylum seekers on a fine-grained timescale (quarters) focusing on recent developments before and after the ‘refugee crisis’ in Europe.
1. Introduction
Immigration to Europe has been the main concern for Europeans for several years. When asked about the most important issues facing the European Union (EU), immigration has been mentioned more often than any other issue in all Eurobarometer surveys since 2015 (European Commission 2018). Specifically, the high inflow of asylum seekers from other parts of the world that peaked during the so-called ‘refugee crisis’ of 2015 is one of the dominant topics in public discourse in most EU member states. While much attention has been given to refugees from civil wars in Syria, Iraq, and Afghanistan, the number of asylum applications by African citizens in Europe almost tripled between 2010 (78,000) and 2016 (200,000) (Eurostat 2018a). Moreover, while the number of asylum applications from the Middle East decreased after the peak in 2015, inflows from Africa continued to increase in subsequent years.
In the medium and long run, it is certainly plausible to expect that migration from Africa will dominate future immigration to Europe. Most of the world’s population growth in the 21st century will take place in Africa and fertility rates are still much
higher there compared with all other world regions (Shapiro and Hinde 2017). Furthermore, it is now agreed that future progress in socioeconomic development will most likely lead to more rather than fewer emigrants from Africa (see, e.g., de Haas 2007).
However, there are several uncertainties regarding the existing state of research. First, previous studies mostly covered periods of low asylum migration to Europe, which was particularly the case throughout the 2000s. As Toshkov (2014: 210) notes, “the relative stability [in asylum flows] as such already implies little effect of national policy changes.” This is of course not the case anymore, but little has been learned so far about whether the recent increase in asylum inflows was fueled by changes in acceptance rates. Moreover, data analyzed in previous studies often was not or was only partly disaggregated by asylum seekers’ countries of origin (e.g., Toshkov 2014). This is also an obvious problem because recognition rates in Europe drastically differ by country of origin. For instance, between 2008 and 2018 81.2% of Eritreans applying for asylum in Europe were accepted as refugees or received subsidiary protection, while this applies to only 4.2% of Algerians (Eurostat 2018b). By not differentiating between countries of origin, changes in the national composition of asylum seekers over time might lead to over- or underestimation of the effect of acceptance rates. Finally, virtually all previous research relied on yearly data. However, a lot can happen within one year with regard to, for example, political violence in countries of origin or changes in the acceptance rates in European countries.
2. Data and measures
We compiled a dataset consisting of aggregated numbers of asylum applications from 48 African countries of origin (essentially, all countries except small island states and the Republic of Congo for reasons of data availability) in 31 European countries (the 28 EU member states as of 2018, plus Norway, Iceland, and Switzerland) between the first quarter of 2008 and the first quarter of 2018 (from Eurostat 2018a). Observations are thus country dyads (n = 48 * 31 = 1,488) with quarters as time units (T = 41) ranging from “Algeria–Austria 1/2008” to “Zimbabwe–United Kingdom 1/2018,” resulting in a total sample size of N = 61,008. The distribution of asylum applications is heavily skewed, which is why we took the log of this variable. Since this kind of data is often misinterpreted in the form of the ecological fallacy (this is the case in, e.g., Neumayer 2005a and Moore and Shellman 2007), we emphasize at this point that we cannot make inferences from aggregate data about, for example, whether or not individuals from a specific country were rightfully granted protection (or were rejected).
decisions on asylum applications from a specific country of origin in a specific receiving country within a given quarter. As robustness checks, we also calculate two aggregated indicators, because bilateral flows are often zero for many country pairs. On the one hand, we measure how many sending-country nationals were accepted across all of Europe within a given quarter, because high acceptance rates in, say, Sweden or Germany might encourage more people to come to Europe who then formally apply for asylum in Italy or Spain. On the other hand, we calculate the share of accepted applications from all African countries in the respective receiving country, which might be of importance for asylum seekers who have little experience from compatriots in the receiving country (due to few applications in the past) but rely on evidence from other sending countries. Since these are percentage values that are bounded 0–1, we apply the logit-transformation with logit(x) = ln(x/(1–x)) (adding and subtracting very small numbers to 0 and from 1 respectively).
As control variables we consider the quarterly unemployment and GDP growth rates in the destination countries (Eurostat 2018c), as well as the quarterly number of incidents of violent conflict in the country of origin (aggregated by country and quarter from the Armed Conflict Location and Event Data Project (ACLED): see Raleigh et al. 2010). Of course, there are a large number of other conceivable variables that have been shown to affect asylum flows: for example, geographic distance and population size. However, we are interested here in explaining short-term changes in asylum flows and acceptance rates which cannot possibly be affected by time-constant factors (distance, colonial past, etc.) or slowly changing and highly path-dependent variables (total GDP, population size, etc.) (see, e.g., Halaby 2004: 523).
Our approach is thus to eliminate time-constant heterogeneity between country pairs by estimating fixed effects panel models that apply the within-country transformation to create unit fixed effects for the 1,488 country dyads and time fixed effects for the 41 quarters. We add lags of the dependent as well as the independent variables of interest to the models to examine the temporal dynamics of how acceptance rates affect asylum inflows and vice versa. A lagged dependent variable for asylum flows models the self-reinforcing nature of migration that is well established in theory using terms such as migration networks, social capital, or “cumulative causation” (Massey et al. 1993). We use the plm package (Croissant and Millo 2008) for R (R Core Team 2018) to estimate panel models. Since a small amount of missing data exists especially for acceptance rates, we use Amelia II (Honaker, King, and Blackwell 2011) for multiple imputation, run all models in ten different datasets, and average the results.
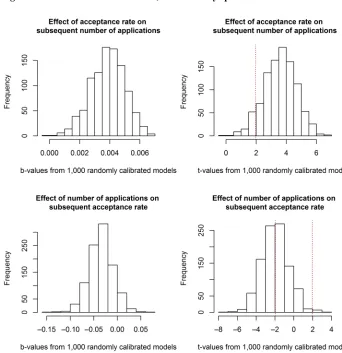
commonly implemented in techniques such as random forests. This can guard against a problem that is acute in quantitative studies: That is, researchers often investigate the same question using identical data but come to different conclusions because of slightly different (but a priori equally plausible) models and controls (see Schrodt 2014). Our algorithm proceeds as follows: (1) Randomly select one of the multiply imputed datasets; (2) Randomly select several countries of origin and countries of destination and drop them from the dataset; (3) Randomly select one of the three time-variant control variables and add it to the equation; (4) Estimate the model with unit and period fixed effects and save the coefficients of interest (e.g., t-value for the effect of lagged asylum flows on recognition rates); (5) Repeat (1)–(4) 1,000 times and plot the distribution of the obtained coefficients.
3. Results
Figure 2 shows normalized aggregate time series of inflows to Europe and acceptance rates. Between 2015 and 2018 the average acceptance rate was indeed somewhat higher (41.8%) compared with the period 2008–2012 (30.1%). However, the number of inflows increased considerably and there is no obvious visual evidence of a surge in acceptance rates preceding the upward slope of asylum flows. Disaggregating these trends, Figure 3 picks out examples of high (Somalia), low (Algeria), and medium but increasing acceptance rates (Nigeria). Clearly, the rise in Algerian asylum applications had nothing to do with the formal acceptance rate, which had remained very low throughout the previous decade. The acceptance rate for Somalis was high but rather stable over time and so were the inflows. For Nigerians, by contrast, the acceptance rate was higher during 2013–2018 compared with the earlier period (2008– 2012) and asylum applications were also higher on average, although there were strong fluctuations.
Table 1: The two-way relationship between asylum applications and acceptance rates, 2008–2018 (quarterly panel models)
Dependent variable
Asylum applications Acceptance rate
(1) (2)
Asylum applications (t–1) 0.300*** –0.056**
(0.009) (0.020)
Asylum applications (t–2) 0.146*** –0.015
(0.013) (0.022)
Asylum applications (t–3) 0.092*** 0.035
(0.011) (0.024)
Asylum applications (t–4) 0.084*** 0.012
(0.008) (0.020)
CO acceptance rate in CD (t–1) 0.004*** 0.066***
(0.001) (0.006)
CO acceptance rate in CD (t–2) 0.003** 0.040***
(0.001) (0.007)
CO acceptance rate in CD (t–3) 0.002 0.026***
(0.001) (0.006)
CO acceptance rate in CD (t–4) 0.003* 0.014**
(0.001) (0.005)
Violent conflicts in CO (t–1) 0.013*** 0.190***
(0.003) (0.019)
Unemployment rate in CD (t–1) –0.003** –0.026***
(0.001) (0.008)
GDP growth rate in CD (t–1) 0.004 0.051***
(0.002) (0.011)
Time fixed effects Yes Yes
Country fixed effects Yes Yes
Observations 55,056 55,056
R2 0.239 0.016
Notes:CO = country of origin, CD = country of destination. Asylum applications and violent conflicts are logged, acceptance rate is logit-transformed. Data sources: see text. *p<.05, **p<.01, ***p<.001.
of the acceptance rate on subsequent asylum flows.2 Note that these are regressions
within country dyads, not between. This means that if, say, more Nigerians are accepted as refugees in Germany, then slightly more Nigerians will apply for asylum in Germany in the following quarter.3 By contrast, the effect of the number of asylum applications
on subsequent acceptance rates is negative: That is, more applications are usually followed by a slightly lower acceptance rate.
Among the other variables in the model, violent conflict in the source country leads to more people seeking refuge in Europe and also positively affects the acceptance rate in the destination. Rising unemployment in the receiving country, by contrast, is associated with fewer refugees targeting the respective country and also with a lower acceptance rate by the government, although these effects are weak in scale.
Figure 4 shows the results of robustness tests assessing whether these results are sensitive to the inclusion or exclusion of certain countries or variables. As is evident in the upper panel, the positive effect of the acceptance rate on subsequent asylum flows is robust and statistically significant at p<.05 in 92.5% of all randomly specified models. The substantive effect size is small, however, averaging b = 0.045 for the untransformed indicator, indicating that a 10% increase in the acceptance rate is on average followed by a 0.5% increase in the number of applications. By contrast, in only 52.3% of all models can a negative and significant effect of receiving more asylum applications be found on subsequent asylum acceptance rates. Thus, evidence for this reverse effect is much weaker and model dependency is a big issue here.
2 This effect can also be found if the acceptance rate of nationals from a given African country in all of
Europe is used, although it is weaker in scale. By contrast, the acceptance rate of all Africans in a given European country has no significant effect on subsequent flows into this country.
3 For many country dyads (646 out of 1,488), quarterly flows are always zero (e.g., Botswana‒Estonia). Since
Figure 4: Robustness tests with 1,000 randomly specified models
4. Conclusion
migration. The latter means that once a sizeable diaspora of asylum seekers has formed in a specific destination country, more asylum applications will usually follow from the respective group in the future, notwithstanding changes in acceptance rates or the economic context.
As a result, the number of asylum seekers from Africa tripled between 2008 and 2018 although the average acceptance rate increased only modestly (from around 30% to 40%). It is evident that while high acceptance rates might be associated with an increase in asylum seekers from some countries, for others the formal acceptance rates did not matter at all. This was the case, for instance, regarding Algerians, who came in ever greater numbers despite their acceptance rate stalling at just 4%.
References
Croissant, Y. and Millo, G. (2008). Panel data econometrics in R: The plm package.
Journal of Statistical Software 27(2): 1–43.doi:10.18637/jss.v027.i02.
De Haas, H. (2007). Turning the tide? Why development will not stop migration.
Development and Change 38(5): 819–841. doi:10.1111/j.1467-7660.2007.
00435.x.
European Commission (2018). Standard Eurobarometer 89: Wave EB89.1: TNS opinion and social at the request of the European Commission. Brussels: European Commission.doi:10.2775/00.
Eurostat (2018a). Asylum and new asylum applicants: Monthly data [electronic resource]. Luxembourg: Eurostat. http://ec.europa.eu/eurostat/tgm/table.do?
tab=table&init=1&language=en&pcode=tps00189&plugin=1 (accessed July 17,
2018).
Eurostat (2018b). First instance decisions on applications by citizenship, age and sex Quarterly data (rounded) [electronic resource]. Luxembourg: Eurostat.
http://ec.europa.eu/eurostat/web/asylum-and-managed-migration/data/database
(accessed July 17, 2018).
Eurostat (2018c). Quarterly national accounts [electronic resource]. Luxembourg: Eurostat. http://ec.europa.eu/eurostat/web/national-accounts/data/database
(accessed July 17, 2018).
Halaby, C.N. (2004). Panel models in sociological research: Theory into practice.
Annual Review of Sociology 30: 507–544. doi:10.1146/annurev.soc.30.012703.
110629.
Hatton, T.J. (2009). The rise and fall of asylum: What happened and why? The Economic Journal 119(535): F183–F213. doi:10.1111/j.1468-0297.2008.
02228.x.
Holzer, T., Schneider, G., and Widmer, T. (2000). The impact of legislative deterrence measures on the number of asylum applications in Switzerland (1986–1995).
International Migration Review 34(4): 1182–1216.
Honaker, J., King, G., and Blackwell, M. (2011). Amelia II: A program for missing data.Journal of Statistical Software 45(7): 1–47.doi:10.18637/jss.v045.i07. Keogh, G. (2013). Modeling asylum migration pull-force factors in the EU-15. The
Massey, D.S., Arango, J., Hugo, G., Kouaoucí, A., Pellegrino, A., and Taylor, J.E. (1993). Theories of international migration: A review and appraisal.Population and Development Review 19(3): 431–466.doi:10.2307/2938462.
Moore, W.H. and Shellman, S. (2007). Whither will they go? A global study of refugees’ destinations, 1965–1995.International Studies Quarterly 51: 811–834.
doi:10.1111/j.1468-2478.2007.00478.x.
Neumayer, E. (2005a). Bogus refugees? The determinants of asylum migration to Western Europe. International Studies Quarterly 49(3): 389–410.doi:10.1111/
j.1468-2478.2005.00370.x.
Neumayer, E. (2005b). Asylum recognition rates in Western Europe: Their determinants, variation, and lack of convergence.Journal of Conflict Resolution
49(1): 43–66.doi:10.1177/0022002704271057.
R Core Team (2018). R: A language and environment for statistical computing [electronic resource]. Vienna: R Foundation for Statistical Computing.
http://www.R–project.org (accessed July 12, 2018).
Raleigh, C., Linke, A., Hegre, H., and Karlsen, J. (2010). Introducing ACLED: An armed conflict location and event dataset special data feature. Journal of Peace Research 47(5): 651–660.doi:10.1177/0022343310378914.
Schrodt, P.A. (2014). Seven deadly sins of contemporary quantitative political analysis.
Journal of Peace Research 51(2): 287–300.doi:10.1177/0022343313499597. Shapiro, D. and Hinde, A. (2017). On the pace of fertility decline in sub-Saharan
Africa. Demographic Research37(40): 1327–1338.doi:10.4054/DemRes.2017.
37.40.
Toshkov, D.D. (2014). The dynamic relationship between asylum applications and recognition rates in Europe (1987–2010). European Union Politics 15(2): 192–