Vol. 9, No. 4, 2017 Article ID IJIM-01001, 7 pages Research Article
Comparison Between Different Methods of Feature Extraction in BCI
Systems Based on SSVEP
S. Sheykhivand ∗, T. Yousefi Rezaii †, A. Naderi Saatlo ‡§, N. Romooz ¶
Received Date: 2016-07-09 Revised Date: 2017-10-11 Accepted Date: 2017-10-22
————————————————————————————————–
Abstract
There are different feature extraction methods in brain-computer interfaces (BCI) based on Steady-State Visually Evoked Potentials (SSVEP) systems. This paper presents a comparison of five methods for stimulation frequency detection in SSVEP-based BCI systems. The techniques are based on Power Spectrum Density Analysis (PSDA), Fast Fourier Transform (FFT), Hilbert- Huang Transform (HHT), Cross Correlation and Canonical Correlation Analysis (CCA). The results demonstrate that the CCA and FFT can be successfully applied for stimulus frequency detection by considering the highest accuracy and minimum consuming time.
Keywords: BCI; CCA; Cross Correlation; FFT; Fuzzy; HHT; PSDA; SSVEP.
—————————————————————————————————–
1
Introduction
B
Cthat allow the people to interact with theI systems provide a non-muscular channel environment from brain activity signal measure-ment [1]. Several methods have been devel-oped for measuring brain activity such as Elec-troencephalography (EEG), magnetoencephalog-raphy (MEG), functional resonance imaging, etc. As EEG is non-invasive technique that can be recorded by placing electrodes on the scalp, the BCI systems have been used it widely. By ana-lyzing EEG signals we can extract features which∗Faculty of Electrical and Computer Engineering, Uni-versity of Tabriz, Tabriz, Iran.
†Faculty of Electrical and Computer Engineering, Uni-versity of Tabriz, Tabriz, Iran.
‡Corresponding author. [email protected], Tel: +98(44)32759180
§Department of Electrical-Electronics Engineering, Ur-mia Branch, Islamic Azad University, UrUr-mia, Iran.
¶Department of Electrical-Electronics Engineering, Ur-mia Branch, Islamic Azad University, UrUr-mia, Iran.
represent users intention and varied status of hu-man brain [2].
The different electrophysiological control sig-nals satisfy user intention by means of monitor-ing brain activity, such as SSVEPs, Slow Cor-tical Potentials (SCPs), Sensorimotor Rhythms (mu and beta Rhythms) and P300. In 1973-1977 Vidal determined direction of eye gaze by employing SSVEP, and thus using this technique they could direct a cursor to side of user wished. VEPs are brain activity modulation that occurs after receiving a visual stimulation in the visual cortex. VEPs may be classified into Transient Visual Evoked Potentials (TVEPs) and Steady-State Visual Evoked Potentials (SSVEPs) accord-ing to frequency of visual stimulations. TVEPs occurs in reaction to visual stimuli below 6 Hz and SSVEPs in frequencies above 6 Hz. SSVEP ap-proach provides highest information transmission rate (ITR), less training time and more safety of user.
In this paper, BCI based on SSVEP is studied.
Over more than 30 years of studies, Birbaumer and Rockstroh demonstrated that the people can learn how control SCPs and direct object of de-sired direction. SCPs belong to the part of the EEG signals that shifts in EEG last a second to several seconds below 1 Hz. Negative SCPs are associated to when of movement and positive, SCPs are usually associated with reduction of ac-tivity [3]. In 1994, Wolpaw and Mefal achieved to control independent mu and beta Rhythm and used it to control cursor in two dimensions [4].
Gido Hakvoort and his colleagues studied com-parison of PSD and CCA detection methods for BCI systems based on SSVEP. The results show that the CCA method performs better than the PSDA method significantly when using harmonic frequencies by attention to PSDA method has dif-ficulties detecting harmonic frequencies, the CCA method is able to detect harmonic frequencies [5]. Xiaogang Ruan and his colleagues applied HHT to decompose signal to independent com-ponents to obtain the intrinsic mode function (IMF), then analyzing the signal from ICA based on HHT. Their experiments show that the pro-posed method is appropriate in feature extraction and the noise can be removed. Wang compared Minimum Energy Combination for SSVEP detec-tion, the experiment results illustrated that CCA has higher accuracy and higher SNR than MEC [6,7].
Currently, there exists several methods of fea-ture extraction from signal that we survey them in the paper, such as 1) FFT method which is based on frequency analysis, although the most widely used it but it has several disadvantages such as spectral leakage and poor performance at low level signals. 2) The PSDA method which is often used as a method of SSVEP detection that is elated to signal processing in frequency domain. 3) Canonical correlation Analysis which is considered as multivariable statistical method that obtains the maximum similarity between two data sets, hence by this method can find informa-tion of interest in brain signal is hidden in highly noisy environment. 4) Hilbert- Huang transform which is time- frequency analysis due to signal that is decomposed to several time- series signals in different frequency bands. 5) Cross correla-tion which is statistical method that is measure of similarity of two sets of signals in signal pro-cessing. In this study we did not survey MEC and
ICA, because these methods need more than one signals and in dataset we have just one signals.
In this paper presents a comparison of five methods for stimulation frequency detection in SSVEP-based BCI systems. The techniques are based on Power Spectrum Density Analysis (PSDA), Fast Fourier Transform (FFT), Hilbert-Huang Transform (HHT), Cross Correlation and Canonical Correlation Analysis (CCA). The re-sults demonstrate that the CCA and FFT can be successfully applied for stimulus frequency de-tection by considering the highest accuracy and minimum consuming time.
2
METHODS
2.1 Dataset
In the experimental step, AVI SSVEP dataset of EEG signal are used. The set contains data from four healthy subjects (one woman and three man) being exposed to flickering targets in or-der to trigger SSVEP responses in different fre-quency (6, 6.5, 7, 7.5, 8.2, 9.3, 10, 12Hz). All data are recorded using three electrodes (Oz, Fpz, and Pz). The signal electrode is placed at Oz while reference is set at Fz and ground at Fpz using the standard 10-20 system for electrode placement. Reference and ground can be set to other posi-tions such as earlobes and mastoids. The only processing applied on the data is an analog notch filter at the mains frequency (50Hz).
2.2 Cross Correlation
Cross Correlation is statistical tools applied for relationship between two random variables or two sets of data. Correlation refers to any of a broad class of statistical relationships involving depen-dence. The value of correlation is between 1 and 1. If we have a series of n measurements of X
and Y written as Xi and Yi where i = 1,2,...,
n, then the sample correlation coefficient can be used to estimate the population Pearson correla-tion between X and Y. The sample correlation coefficient is written:
corr(X, Y) = ∑n
i=1
(
Xi−X¯) ∑ni=1(Yi−Y¯)
√∑n
i=1
(
Xi−X¯)2∑in=1(Yi−Y¯)2
In equation (2.1), X and Y are SSVEP re-sponses and artificial sinusoidal signals in several frequencies (6, 6.5, 7, 7.5, 8.2, 9.3, 10, 12Hz). Where ¯X and ¯Y are the means of X and Y re-spectively, which are zero, because the signals do not have DC terms.
In order to calculate cross correlation, we con-sidered X and Y as fixed and moving signals. We moveY for 86 time and calculated maximum of cross correlations between X and Y among all 86 variable vector. Fig. 1 shows maximum cross correlation for several samples in SSVEP response of stimuli frequency 10Hz andY in sev-eral frequencies which according to Fig. 1 most amounts in any samples belong to cross correla-tion betweenX and Y associated with flickering frequency (10Hz).
Figure 1: Max of Cross Correlation between X and Y in different frequencies for 3 samples in stim-uli frequency 10Hz. for 3 samples in stimstim-uli fre-quency 10Hz.
2.3 Canonical Correlation Analysis
Canonical Correlation Analysis (CCA) is intro-duced as a statistical multivariable technique that obtains the maximum similarity between two datasets. A variable in one set is the recorded multiple electrode signalsY and the second set is SSVEP information matrixX.
Y (t) =
y1(t) y2(t)
y3(t) y4(t)
y5(t) y6(t)
=
sin(2πf t)
cos(2πf t)
sin(4πf t)
cos(4πf t)
sin(6πf t)
cos(6πf t) (2.2)
Consider their linear combinations asx=XTWx
and y = YTWy respectively, and Wy which can
be found by CCA which maximizes the correla-tionρf betweenx andy, by solving the following equation we have:
M AXρ(X, Y) = E [
xTy]
√
E[xTx]E[yTy] (2.3)
The maximum ofρwith respect toWxand , is the
maximum canonical correlation. The frequency corresponding to the largest coefficient is the one of SSVEP. From Table 1, it can be observed that maximum of canonical correlation is between X
and Y in the same frequency (10Hz) [7].
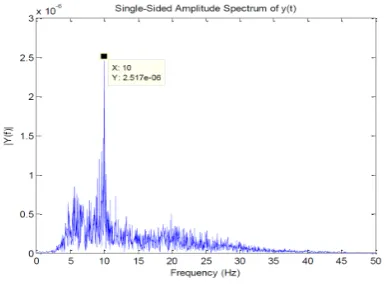
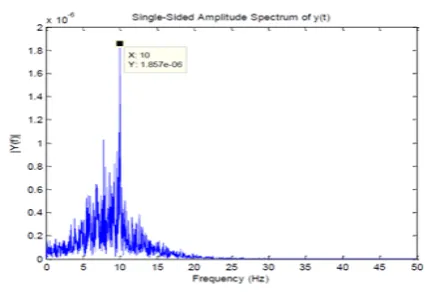
Figure 2: Frequency domain diagram of SSVEP response in stimuli frequency 10Hz.
2.4 Fast Fourier Transform
Fourier analysis converts a signal from its orig-inal domain (time) to a representation in the frequency domain. Feature extraction can be achieved in frequency domain. In most cases in BCI systems based on SSVEP is applied FFT for feature extraction, therefore in frequency spectral the largest peak is created in stimuli frequency and we can identify flicking frequency by that. In Fig. 2, the largest value related to 10Hz is shown where this frequency is flicking frequency.
2.5 Power Spectrum Density
The power spectrum density of signal is widely used in BCI based on SSVEP detection.
Table 1: Canonical correlation between SSVEP responses in stimuli frequency 10Hz and Y in different fre-quencies (Hz).
Y 6 6.5 7 7.5 8.2 9.3 10
M AXρ(X, Y) 0.05 0.07 0.06 0.03 0.02 0.12 0.32
Figure 3: Power Spectrum Density of SSVEP response in stimuli frequency 10Hz.
2.6 Hilbert-Huang Transform
For first time, Norden E Huang proposed Hilbert-Huang Transform (HHT) in 1998 [6]. As we know, the natural physical processes are mostly nonlinear and no stationary. Firstly, HHT decomposes non stationary signal into a series of narrowband signal by the empirical mode decomposition (EMD), and the signal is intrinsic mode function (IMF). Secondly, the Hilbert transform is applied to the IMF. The HilbertHuang transform (HHT) is a way to decompose a signal into so-called intrinsic mode functions (IMF) along with a trend. For∀(t)∈R
the EMD is given as follows: Firstly, determine
x(t) of all extreme points, respectively, with a cubic spline curve points to a minimum point value and a maximum point value obtained by fitting the envelope curve emax(t) and lower envelope curveemin(t). Secondly, calculate the average between (t) and emin(t):
µ(τ) = (emax(τ) +emin(τ))/2 (2.4)
The new signal ofc(t) is obtained as (third step):
c(t) =x(t)−m(t) (2.5)
Ifc(t) does not satisfy the definition of IMF, c(t) is substituted with x(t) repeating steps one to third; otherwisec(t) is as separated IMF, and
cal-culate the residual signal r(t):
r(t) =x(t)−c(t) (2.6)
According to the results in Fig. 4, we can get 11
Figure 4: Signal decomposed by HHT IMF1 to IMF4.
Figure 5: Frequency domain diagram of SSVEP response in stimuli frequency 10Hz by HHT.
decomposed signals from IMF1 to IMF4. In Fig. 5, we can identify flicking frequency by finding the largest peak which is created in frequency domain of IMF2 by HHT.
3
Simulation
results
of
pro-posed method
cho-Figure 6: Accuracy for detection all of stimuli frequencies.
Figure 7: Time Consumption for different meth-ods.
sen for extracting stimulus frequency in brain-computer interfaces (BCI) based on SSVEP sys-tems. The concluded results from using these methods allowed improvement of detection in the stimulation Frequency. The simulation results in Fig. 6illustrated that FFT method for detection stimuli frequencies consist of 6, 6.5 and 7 Hz and FFT for detection stimuli frequencies consist of 7.5 and 9.3 Hz are best.
In the above experiments, five methods were used to extract the appropriate feature, and the computation time is shown in Fig. 7. The average time of 0.19 s for FFT, 0.3 for PSD, 0.2 for HHT, 1 for Cross Correlation and 0.6 for CCA are ob-tained. Therefore FFT and CC methods consume the minimum and maximum time respectively.
In addition, to extract features in BCI systems based on SSVEP is applied frequency analysis such as FFT and PSD, time- frequency analysis based on Hilbert- Huang transform and statisti-cal analysis includes Cross Correlation and CCA in order to compare them. According to Fig. 8, for first user, FFT and PSD have most, for
sec-Figure 8: Accuracy of all of methods users (top left- user1, top right- user 2, down left- user 2 and down right- user4).
ond user CCA method has highest accuracy and HHT method is least, for third user CCA and Cross Correlation have most accuracy and HHT has least accuracy and fourth user FFT and PSD have highest accuracy and HHT, FFT and PSD has least accuracy.
4
Conclusion
In this study five methods for stimulation fre-quency detection in BCI systems based on SSVEP have been presented. The techniques were based on the methods of PSDA, FFT, HHT, CC and CCA. The results demonstrate that the CCA and FFT can be successfully applied for stimulus frequency detection by considering the highest accuracy and minimum consuming time.
References
[1] G. Schalk, J. Mellinger, A practical guide to brain computer interfacing with BCI2000: General-purpose software for brain-computer interface research, data ac-quisition, stimulus presentation, and brain monitoring, Springer Science and Business Media, (2010).
[3] L. F. Nicolas-Alonso, J. Gomez-Gil, Brain computer interfaces, a review, Sensors 12 (2012) 1211-1279.
[4] D. J. McFarland, J. R. Wolpaw, Braincom-puter interfaces for communication and con-trol,Communications of the ACM 54 (2011) 60-66.
[5] G. Hakvoort, B. Reuderink, M. Obbink, Comparison of psda and cca detection meth-ods in a ssvep-based bcisystem.
[6] X. Ruan, K. Xue, M. Li, Feature extrac-tion of ssvep-based brain-computer interface with ica and hht method, in: Intelligent Control and Automation (WCICA), 2014 11th World Congress on, IEEE, (2014) 2418-2423.
[7] W. Nan, C. M. Wong, B. Wang, F. Wan, P. U. Mak, P. I. Mak, M. I. Vai, A com-parison of minimum energy combination and canonical correlation analysis for ssvep de-tection, in: Neural Engineering (NER),2011 5th International IEEE/EMBS Conference On, IEEE, (2011) 469-472.
[8] C. Yucelbas, S. Ozsen, S. Gunes, S. Yosunkaya, Effect of some power spectral density estimation methods on automatic sleep stage scoring using artificial neural networks, IADIS International Journal on Computer Science and Information Systems
8 (2013) 119-131.
[9] C. F. Lin, C. H. Chung, A chaos-based visual encryption mechanism in integrated ecg/eeg medical signals, in: Advanced Communica-tion Technology, 2008. ICACT 2008. 10th International Conference on, IEEE, 3 (2008) 1903-1907.
[10] C. F. Lin, W. T. Chang, C. Y. Li, A chaos-based visual encryption mechanism in jpeg2000 medical images,Journal of Medical and Biological Engineering 27 (2007) 144-149.
[11] K. Ravi, R. Palaniappan, C. Eswaran, S. Phon-Amnuaisuk, Data encryption using event-related brain signals, in: Conference on Computational Intelligence and Multime-dia Applications, International Conference on, IEEE, 1 (2007) 540-544.
[12] C. F. Lin, B. S. Wang, 2d chaos-based vi-sual encryption mechanism in eeg signals, in: Parallel and Distributed Processing with Ap-plications (ISPA), International Symposium on, IEEE, (2010) 470-473.
[13] S. Parveen, S. Parashar, Technique for pro-viding security in medical signals, in: Mul-timedia, Signal Processing and Communica-tion Technologies (IMPACT), International Conference on, IEEE (2011) 68-71.
[14] C. F. Lin, S. H. Shih, J. D. Zhu, Chaos based encryption system for encrypting electroen-cephalogram signals,Journal of medical sys-tems 38 (2014) 49-56.
[15] G. Kenfack, A. Tiedeu, Chaos-based encryp-tion of ecg signals: experimental 10 results,
Journal of Biomedical Science and Engineer-ing 7 (2014) 368-380.
[16] C. K. Chen, C. L. Lin, C. T. Chiang, S. L. Lin, Personalized information encryption us-ing ecg signals with chaotic functions, Infor-mation Sciences 193 (2012) 125-140.
Sobhan Sheykhivand received B.Sc. degree in Electronic En-gineering from Islamic Azad University of Urmia, Urmia, Iran, in 2016. He is currently M.Sc. Student in Biomedical engineering at University of Tabriz, Tabriz, Iran. His current research interest includes biomedical signal processing, data compression and compressed sensing.
signal processing, pattern recognitionstatistical learning and adaptive filters.
Ali Naderi Saatlo received his B.Sc. degree in Communication Engi-neering from Urmia Azad Univer-sity, in 2005, the M.Sc. degree in Electrical Engineering from Urmia University, Urmia, Iran in 2008, and the Ph. D in Electronics En-gineering from Istanbul Technical University, Is-tanbul, Turkey in 2014. Since 2011, he has been a faculty member of electrical engineering depart-ment of Urmia Azad University. His research in-terests are analog and digital integrated circuit design for fuzzy applications, fuzzy sets and sys-tems, high performance analog circuits, and dig-ital signal processing. He is the author or co-author of about 30 papers published in scientific journals or conference proceedings.