Medical Journal of the Islamic Republic of Iran (MJIRI)
Med J Islam Repub Iran. 2019(19 Oct);33.112. https://doi.org/10.34171/mjiri.33.112
______________________________
Corresponding author: Dr Gholamreza Ghaedamini Harouni, [email protected]
1.Social Welfare Management Research Center, University of Social Welfare and
Rehabilitation Sciences, Tehran, Iran
2.Social Welfare Management Department, University of Social Welfare and
Rehabilitation Sciences, Tehran, Iran
↑What is “already known” in this topic:
In the previous studies, the well-being of households in Tehran’s municipal districts was estimated as a one-dimensional concept.
→What this article adds:
In the present study, well-being was assessed by a multidimensional approach, which included material and psychological dimensions.
Spatial pattern of well-being in Tehran: The north-south gap
Seyed Hossein Mohaqeqi Kamal1, Gholamreza Ghaedamini Harouni*1, Mehdi Basakha2
Received: 28 Jul 2018 Published: 19 Oct 2019
Abstract
Background: Human well-being is a core global issue. Thus, achieving and sustaining higher levels of well-being is a challenge for citizens, governments, and international organizations worldwide. The present study aimed at describing the well-being status of residents of Tehran municipal districts. To achieve this, a composite well-being index was constructed for 22 municipal districts of Tehran (Tehran Well-being Index; TWI).
Methods: This cross sectional study was conducted from May to October 2017 in Tehran using the data collected in the second round of Urban Health Equity Assessment and Response Tool (Urban HEART) Project of Tehran (2012-2013). The statistical population of this study was 22 municipal districts of Tehran and a sample of 34 700 households (118 000 individuals) selected using multistage cluster sampling. TWI was developed through the Organization for Economic Cooperation and Development (OECD) methodology of constructing composite indicators. Then, 22 municipal districts were categorized based on TWI scores. All data were analyzed using SPSS v.18. In addition, a cartogram was applied using GIS software to classify well-being status among Tehran municipal districts.
Results: Factor analysis results showed that the Kaiser-Meyer-Olkin (KMO) value was 0.691 and 2 factors (material well-being and psychological well-being) explained 74.13% of the total variances. Furthermore, the best and worst performances were found in districts 6 and 17, respectively. District 6 had the best and district 17 the worst material well-being status. Also, districts 6 and 19 had the best and worst psychological well-being status, respectively.
Conclusion: In general, the well-being status of the municipal districts of Tehran can be divided into 5 main categories: (a) prosperous (districts 1, 2, 3, 5, and 6); (b) fairly prosperous (districts 4, 21, and 22); (C) moderately prosperous (districts 7, 8, and 13); (d) less prosperous (9, 10, 11, 14, and 12); and (e) deprived zone (districts 12, 15, 16, 17, 18 and 19).
Keywords: Social welfare, Urban spatial distribution, Social class, Index, Socioeconomic factors
Conflicts of Interest: None declared
Funding: None
*This work has been published underCC BY-NC-SA 1.0 license.
Copyright© Iran University of Medical Sciences
Cite this article as:Mohaqeqi Kamal SH, Ghaedamini Harouni Gh, Basakha M. Spatial pattern of well-being in Tehran: The north-south gap. Med J Islam Repub Iran. 2019 (19 Oct);33:112. https://doi.org/10.34171/mjiri.33.112
Introduction
Well-being is an essential global issue, and achieving a better well-being is an important challenge for individuals, governments, and organizations around the world.
Nevertheless, there is no unanimous definition of the concept of well-being. It is sometimes described as a men-tal state in terms of "happiness" (1). However, well-being refers to a wider concept encompassing happiness as well
as other dimensions, such as family relationships, physical and mental health, environment, education, housing, in-come, leisure activities etc. (2).
The definition provided by the World Health Organiza-tion (WHO) emphasizes the importance of well-being: “Health is a state of complete physical, mental, and social well-being and not merely the absence of disease or
Measuring well-being in Tehran
mity.” (3). Comparative studies, measures of develop-ment, policy decisions, cost–benefit analyses, and poverty and inequality studies constantly refer to well-being eval-uations (4).
Well-being is a broad concept that encompasses numer-ous domains, which can be divided into 2 major areas: objective and subjective well-being; a diverse range of scales have been developed to measure both areas (5). Objective well-being is typically defined and measured based on human basic needs, such as health, education, economics, environment, while subjective well-being re-fers to satisfaction with public life and happiness and is typically assessed using self-report scales (6).
The concept of well-being is traditionally measured us-ing objective indicators, such as education and income. However, these dimensions are merely considered as proxies to the subjective quality of life of individuals. Viewing people from the lifetime well-being perspective is becoming increasingly significant in well-being evalua-tions. Subjective well-being is analyzed using measures of happiness and life satisfaction. Some of the previous well-being studies have only focused on the objective dimen-sions of this concept, others have only examined its sub-jective dimensions, and few have focused on both aspects at the same time (5). The Stiglitz-Sen and Fitoussi’s (7) report on economic performance and social progress refers to 8 key dimensions of well-being: (1) standards of mate-rial living (consumption, income, and wealth); (2) health condition; (3) education; (4) personal activities, including career; (5) political voice and governance; (6) social communications and interactions; (7) environment (cur-rent and future conditions); and (8) security (physical and economic) (7).
Therefore, the concept of well-being cannot be summa-rized in the form of a single dimension or indicator (tradi-tionally, the single dimension of economy), as it is a mul-tidimensional concept that covers a wide range of do-mains. The Human Development Index (HDI) was the starting point for introducing and using multidimensional indices to assess well-being (8). The General Well-being Index introduced by former UK Prime Minister, David Cameron, can be regarded as another composite indicator of well-being. Recent years have seen a significant in-crease in the number and variety of composite well-being indices, such as the Canadian Index of Well-being (9), the Women's Well-being Index (10), and the OECD's Interac-tive Better Life Index (11).
Composite indicators are increasingly recognized as ap-plied tools in the policy analysis. Nowadays, the use of composite indicators is increasing in the world (12). Ban-dura's study (13) has referred to 160 cases of these indica-tors. Composite indicators provide a simple and under-standable comparison of the performance of countries or communities and can be used to describe complex and diverse issues in environmental, social, economic, and technological fields (12). Use of a composite well-being index covering various dimensions of a good life can pro-vide a comprehensive and detailed analysis of well-being that ultimately improves the assessment of social policies. Considering what was mentioned above, this study aimed
to investigate the well-being of the residents of Tehran’s municipal districts using a composite well-being index.
Review of the studies conducted on well-being among the Iranian population have shown that many studies in this area are single-dimensional and more concerned with the psychological well-being of individuals (more specifi-cally using the Ryff and Keyes’ questionnaire) (14-16). In addition, most studies have been performed in a limited geographic scope with small sample sizes. However, the present study aimed to evaluate well-being in the urban districts of Tehran as the second most populated city in the Middle East.
Methods
Data
This cross sectional study was conducted from May to October 2017 in Tehran using the data collected in the second round of Urban Health Equity Assessment and Response Tool (Urban HEART) Project of Tehran (2012-2013). The statistical population included all households in the 22 municipal districts of Tehran. The households were selected using a multistage cluster sampling method. The sampling frame was a comprehensive map of Tehran in 2011 presenting Tehran’s districts and neighborhoods separately. In the first and second stages of sampling, 22 districts and 368 neighborhoods in Tehran were consid-ered as the strata, respectively. In the third stage, a cluster sampling method was used in which each block was re-garded as a cluster. A systematic, 2-dimensional sampling was utilized to select blocks in the neighborhoods via GIS maps (17). A total of 34 700 households were included in the analysis. The data were obtained from an informed person inside the family (In most cases, the mother). The details on the sampling method used in the present study have been described elsewhere (18). The inclusion criteria were as follow: informed consent to participate in the study and residing in Tehran for at least 1 year. The households returning incomplete questionnaires and those not willing to continue their participation were excluded. In the first step, the Tehran Well-Being Index (TWI) was developed based on the method of constructing composite indices (11). In the second step, well-being and its dimen-sions were assessed using the new index among the households of Tehran.
Measure
The OECD methodology of constructing composite in-dicators was used to develop the Tehran Well-Being Index (TWI). This method includes the following steps: defining the theoretical framework, variable selection, imputation of missing data, multivariate analysis (factor analysis method), standardization of variables (using Z- score), weighting (equal weighting), and aggregation (linear ag-gregation) (12).
After factor analysis, as a multivariate analysis, the var-iables of the TWI need to be normalized. In this study, the Z-score method was used to standardize scores on the same scale, for which the following equation was used:
Z=
Where Xi is the input variable and and Std. are the mean and standard deviation of the given input, respec-tively. This method converts the variables to the same scale with a mean of zero and a standard deviation of 1. After standardization, the variables were aggregated using the equal weighting technique. In addition, the study vari-ables were aggregated using the linear aggregation method (12).
Theoretical framework
The social indicator approach was applied for conceptu-alization of human well-being. According to this ap-proach, human well-being is viewed as a multidimension-al concept consisting of different dimensions, including health, environment, education, leisure activities, housing conditions, and the possible combinations between these variables (2). Furthermore, empirical evidence in this field (for instance, the OECD’s Better Life Index and the Cali-fornia Women's Well-Being Index) refer to the following dimensions as components of human well-being: material well-being, family, education, housing conditions, social relationships, subjective well-being, etc.
Data selection
Variables were selected based on the following criteria: First, theoretical and empirical basics related to well-being were investigated. The purpose of this study was to identi-fy the dimensions, components, and indicators of well-being. Then, the results of the theoretical and empirical research were presented to a panel of experts. The panel members (including the study team) were asked to deter-mine the domains and components of well-being. Finally, according to the available data, a total of 24 variables were selected as the initial indicators of the TWI; then, the final number of variables was determined after performing a factor analysis. The 19 initial variables included car ownership, computer ownership, freezer ownership, home ownership rate, college graduation rate, literacy rate among people over 6 years of age, high school dropout rate, domestic violence, level of psychological health, expenditure on culture, basic insurance coverage, percent-age of households living below the poverty line, distance from the bus station, distance from the metro station, use of trash bags, access to waste disposal tanks, municipali-ties’ sense of responsibility toward households’ problems, employment rate, and annual savings. All these variables are at the district level. The mean of the variables at the
individual level, such as car ownership, was considered at the district level. Also, the aggregated data were analyzed at the district level.
Missing-data imputation
Since this study was conducted with aggregated, sec-ondary data, there was no missing data.
Analysis
First, an explanatory factor analysis with princi-pal component analysis (PCA) and Varimax rotation was performed to evaluate the possibility of data reduction and to obtain a statistical basis to combine the individual indi-cators. Then, the final individual indicators were standard-ized using Z-scores. In this method, the variables are con-verted to a common scale with a mean of zero and a standard deviation of 1. After standardization, the varia-bles were aggregated using the equal weighting technique. The data were analyzed using exploratory factor analysis, Kaiser–Meyer–Olkin (KMO) test, and Bartlett’s test. The analyses were performed using SPSS version 18. In addi-tion, a cartogram was designed using the GIS software to classify households in Tehran’s municipal districts. The significance level was set at p<0.05. The ethical approval was obtained from the Ethics Committee at the University of Social Welfare and Rehabilitation (USWR).
Results
Factor analysis was performed on 19 initial variables to determine the final number of variables for the TWI and its dimensions. Of the 19 variables analyzed, 3 were elim-inated due to low KMO values, and at each step, only 1 variable with the lowest association with other variables was removed from the data set. After removing these 3 variables (household savings, basic insurance coverage, and municipality’s sense of responsibility, respectively), the KMO values became greater than 0.5, and factor anal-ysis became statistically possible. In the next step, the factor analysis was performed with the remaining 16 vari-ables. At this step, 5 variables (distance from the bus sta-tion, distance from the metro stasta-tion, use of trash bags, access to waste disposal tanks, and employment rate) were excluded from the study due to conceptual inconsistencies (eg, not being related to the concept of well-being or load-ed on unrelatload-ed factors), therefore, a total of 11 variables were selected as the final variables of the TWI.
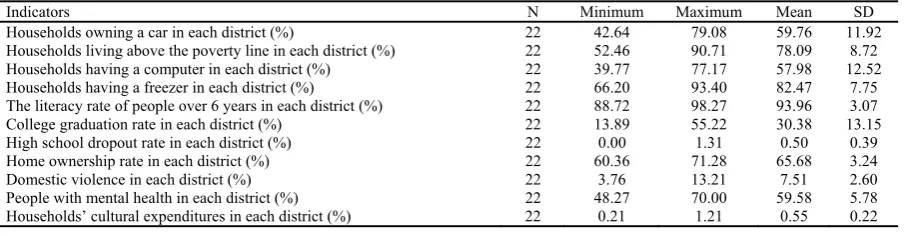
According to Table 1, on average, 59.76% of the
house-Table 1. Descriptive statistics of Tehran well-being indicators
Indicators N Minimum Maximum Mean SD
Households owning a car in each district (%) 22 42.64 79.08 59.76 11.92
Households living above the poverty line in each district (%) 22 52.46 90.71 78.09 8.72
Households having a computer in each district (%) 22 39.77 77.17 57.98 12.52
Households having a freezer in each district (%) 22 66.20 93.40 82.47 7.75
The literacy rate of people over 6 years in each district (%) 22 88.72 98.27 93.96 3.07
College graduation rate in each district (%) 22 13.89 55.22 30.38 13.15
High school dropout rate in each district (%) 22 0.00 1.31 0.50 0.39
Home ownership rate in each district (%) 22 60.36 71.28 65.68 3.24
Domestic violence in each district (%) 22 3.76 13.21 7.51 2.60
People with mental health in each district (%) 22 48.27 70.00 59.58 5.78
Households’ cultural expenditures in each district (%) 22 0.21 1.21 0.55 0.22
Measuring well-being in Tehran
holds in Tehran own a car, varying from 42.64% (district 16) to 79.08% (district 22). In addition, the average home ownership rate is 65.68%, varying from 60.36% (district 10) to 71.28% (district 2). Descriptive statistics of the well-being indicators among Tehran’s households are shown in Table 1.
The results of factor analysis are presented below.
First step: Analysis of the possibility of performing
fac-tor analysis on the facfac-tors: According to a KMO value of 0.691, the research data can be reduced to several funda-mental underlying factors. In addition, the Bartlett’s test results (249.3, df = 55, p< 0.001) indicated that the corre-lation matrix between variables was not an identity matrix. Therefore, data reduction was possible, and 11 indicators were aggregated in a well-being index.
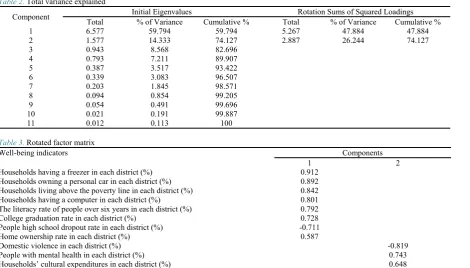
Second step: Identifying the contribution of each factor
in explaining the total distribution (variance) of the varia-bles: The percentage of the total variance was explained by each factor. This issue was understood through the following table, titled “total variance explained”, which shows eigenvalues and the percentage of variance and cumulative variance explained by the factors (Table 2).
According to Table 2, the cumulative percentage of the first 2 factors is 74.13%. In other words, the 9 other fac-tors can only explain 25.87% of the total variance.
Third step: Identifying the matrix of correlation
be-tween variables and factors and categorizing the variables in the factors: To categorize the variables based on factor loadings, the results in the table presenting the rotated factor matrix should be used. This table shows the matrix of correlation between variables and factors after rotation, in which the correlation coefficient varies between -1 and +1. According to this table, the classification was done based on the factor loadings of individual variables (Table
3).
Based on the results of factor analysis, 8 variables (freezer ownership, computer ownership, car ownership, being above the poverty line, literacy, college education, high school dropout, and home ownership) were loaded on material well-being, according to the general content of these variables. Other variables of domestic violence, mental health, and expenditure on culture were loaded on psychological well-being. In summary, based on the re-sults of the factor analysis, data reduction was possible, so the 11 abovementioned variables could be aggregated into a composite well-being index; and secondly, these 2 fac-tors, together, could explain 74.13% of the total variance.
Of the 11 variables, high school dropout and domestic violence were not in line with the concept of well-being. Therefore, when the indicators were aggregated, they re-ceived a negative sign. In other words, their value was deducted from the value of some other variables. The al-gebraic formula for the aggregation of the TWI is present-ed below:
Formula 1: Algebraic formula of the Tehran
Well-Being Index (TWI)
The Tehran Well-being Index (TWI) = a1 (Z Freezer) +
a2 (Z Car) + a3 (Z Upper. poverty) + a4 (Z Literacy rate) + a5 (Z Computer) + a6 (Z College education) + a7 (Z Ownership) + a8 (Z Psychological health) + a9 (Z Ex-penditure on culture) - a10 (Z Dropout) - a11 (Z Domestic Violence).
Formula 2: Algebraic formula of the material
well-being sub-index
The material well-being subindex = a1 (Z Freezer) + a2
(Z Car) + a3 (Z Upper. poverty) + a4 (Z Literacy rate) + a5 (Z Computer) + a6 (Z College education) + a7 (Z Ownership) – a8 (Z Dropout).
Table 2. Total variance explained
Rotation Sums of Squared Loadings Initial Eigenvalues
Component
Cumulative % % of Variance
Total Cumulative %
% of Variance Total 47.884 47.884 5.267 59.794 59.794 6.577 1 74.127 26.244 2.887 74.127 14.333 1.577 2 82.696 8.568 0.943 3 89.907 7.211 0.793 4 93.422 3.517 0.387 5 96.507 3.083 0.339 6 98.571 1.845 0.203 7 99.205 0.854 0.094 8 99.696 0.491 0.054 9 99.887 0.191 0.021 10 100 0.113 0.012 11
Table 3. Rotated factor matrix
Well-being indicators Components
1 2
Households having a freezer in each district (%) 0.912
Households owning a personal car in each district (%) 0.892
Households living above the poverty line in each district (%) 0.842
Households having a computer in each district (%) 0.801
The literacy rate of people over six years in each district (%) 0.792
College graduation rate in each district (%) 0.728
People high school dropout rate in each district (%) -0.711
Home ownership rate in each district (%) 0.587
Domestic violence in each district (%) -0.819
People with mental health in each district (%) 0.743
Households’ cultural expenditures in each district (%) 0.648
Formula 3: Algebraic formula of the psychological well-being subindex
The psychological well-being subindex = a1 (Z
Psycho-logical health) + a2 (Z Expenditure on culture) - a3 (Z Domestic Violence).
Where “as” are weights assigned to each indicator of
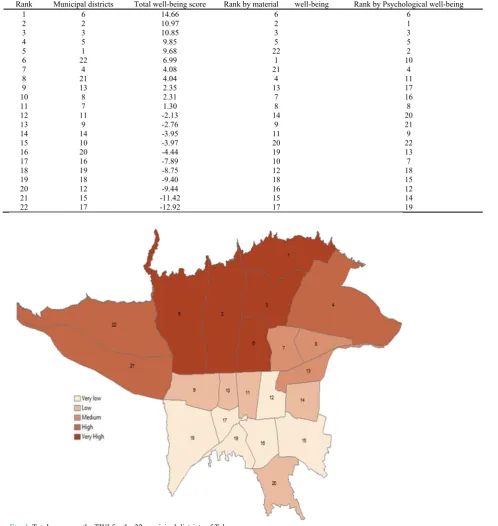
well-being, which are equal in this study. After aggregat-ing the indicators, the TWI was formulated, and the score for each of the 22 municipal districts of Tehran was calcu-lated. The total TWI score is equal to the mean of stand-ardized score across all indicators, and higher scores
indi-cate greater well-being. The minimum and maximum scores on the TWI could be −44 to +44, respectively. Ta-ble 4 and Figure 1 show the scores for households in dif-ferent districts of Tehran. In Figure 1, the darker the color, the higher theTWI score.
As shown in Table 4, districts 6, 2, and 3 had the high-est well-being scores and districts 17, 15, and 12 the low-est well-being scores. In addition, districts 6, 2, and 3 and districts 6 and 1 had the highest objective and subjective well-being scores, respectively.
Table 4. Well-being and its dimensions in different districts of Tehran
Rank Municipal districts Total well-being score Rank by material well-being Rank by Psychological well-being
1 6 14.66 6 6
2 2 10.97 2 1
3 3 10.85 3 3
4 5 9.85 5 5
5 1 9.68 22 2
6 22 6.99 1 10
7 4 4.08 21 4
8 21 4.04 4 11
9 13 2.35 13 17
10 8 2.31 7 16
11 7 1.30 8 8
12 11 -2.13 14 20
13 9 -2.76 9 21
14 14 -3.95 11 9
15 10 -3.97 20 22
16 20 -4.44 19 13
17 16 -7.89 10 7
18 19 -8.75 12 18
19 18 -9.40 18 15
20 12 -9.44 16 12
21 15 -11.42 15 14
22 17 -12.92 17 19
Fig. 1. Total scores on the TWI for the 22 municipal districts of Tehran
Measuring well-being in Tehran
Discussion
The present study had the following objectives: (1) de-veloping the Tehran Well-being Index (TWI) and (2) as-sessing the well-being of the residents of 22 districts of Tehran via the TWI.
According to the results, there was a considerable ine-quality in well-being across different districts of Tehran. The northern districts had the highest scores and the southern districts the lowest scores on the TWI. District 6 had the highest scores on the TWI in both the objective and subjective dimensions. District 6 is located in the cen-ter of Tehran and has the highest licen-teracy rate among the 22 districts, with a 93.1% literacy rate. Conversely, dis-trict 17 had the lowest scores on the TWI and objective well-being. This district is located in the south of Tehran and is considered to be the most densely populated district in Tehran. It seems that some policies, such as equal dis-tribution of opportunities and resources and providing the necessary infrastructure, can help close the north-south gap.
Ghaedamini et al (19) examined the health status of the residents of different districts of Tehran using the Com-posite Health Index and found that districts 13, 10, and 17 had the best health status and district 8 the worst health status. In addition, in terms of physical health, districts 13, 17, and 1 had the best status and district 8 the worst status. In terms of mental health, districts 3, 6, and 1 had the best status and districts 8 and 12 the worst status. This differ-ence can be attributed to different variables examined by the 2 studies. In other words, Ghaedamini et al. considered health mostly in terms of physical, psychological, and social dimensions, while the present study focused on material well-being, education, housing, psychological status, and domestic violence.
In the study conducted by Firoozabadi and Imani Ja-jarmi (20), the 22 municipal districts of Tehran were di-vided into 3 categories of less developed districts (districts 12,18,9,17,16,19, and 10), moderately developed districts (districts 14, 7, 20, 8, 15, 11, 21, and 13), and developed districts (districts 22, 6, 4, 5, 1, 2, and 3), based on eco-nomic development indicators (employment rate, gross household expenditures, employment rate in women, household growth rate, and ratio of employed population to the total population). The results of Firouzabadi and Jajarmi's study (20) are more consistent with those of the present study. However, some differences might be related to focusing on different dimensions or different study years.
According to Table 1, it seems that the objective well-being indicators were higher than those of psychological indicators. According to Maslow's hierarchy of needs, the achievement of higher needs becomes possible when physiological needs have been adequately met. Therefore, authorities in the urban areas are suggested to carefully plan for the psychological needs of the populations in terms of promoting cultural values and improving leisure activities. On the other hand, provision of some objective needs, such as housing, is very costly and requires a lot of resources. According to the Iranian Statistics Center
(2018), housing costs account for 30% to 34% of total expenses of households in Tehran (21).
Some of the study limitations included the lack of ac-cess to some data about well-being, such as data on leisure time and entertainment, and the lack of participation of all stakeholders in the process of selecting and weighting variables. The strength of the study was the use of subjec-tive variables of well-being in developing the TWI.
Conclusion
In general, the well-being of the households in the mu-nicipal districts of Tehran can be divided into 5 main cat-egories: (a) prosperous (districts 1, 2, 3, 5, and 6); (b) fair-ly prosperous (districts 4, 21, and 22); (c) moderatefair-ly prosperous (districts 7, 8, and, 13); (d) less prosperous (districts 9, 10, 11, 14, and 12); and (e) deprived (districts 12, 15, 16, 17, 18, and 19).
Acknowledgments
We would like to thank all those who helped us with this research.
Conflict of Interests
The authors declare that they have no competing interests.
References
1. Diener E. Assessing subjective well-being: Progress and opportunities. Soc Indic Res. 1994;31(2):103-157.
2. Islam SM, Clarke M. The relationship between economic development and social welfare: A new adjusted GDP measure of welfare. Soc Indic Res. 2002;57(2):201-229.
3. Organization WH. Constitution of the World Health Organization as adopted by the International Health Conference. World Health Organization: New York. 1948.
4. Fleurbaey M. Beyond GDP: The quest for a measure of social welfare. J Econ Lit. 2009;47(4):1029-75.
5. McGillivray M, Clarke M. Understanding human well-being. 2006: United Nations University Press.
6. Sarvimäki A. Well-being as being well—A Heideggerian look at well-being. Int J Qual Stud Health Well-being. 2006;1(1):4-10. 7. Stiglitz J, Sen A, Fitoussi JP. The measurement of economic
performance and social progress revisited. Reflections and overview. Commission on the Measurement of Economic Performance and Social Progress, Paris, 2009.
8. United Nations Development Programme, Human development report. 2012, New York: Oxford University Press.
9. Michalos AC, Smale B, Labonté R, Muharjarine N, Scott K, Moore K, et al. The Canadian Index of Wellbeing technical report 1.0. 2011, University of Waterloo: Waterloo.
10. Mohaqeqi Kamal SHM, Basakha M, Ghaedamini Harouni G. Women’s Well-Being in Iran: Territorial Analysis Using a Multidimensional Approach. Soc Indic Res. 2018;137(3):1061-1072. 11. Organisation for Economic Co-operation and Development. OECD
Better Life Index. 2007 Accessed November 2017); Available from: http://www.oecdbetterlifeindex.org.
12. Nardo M, Saisana M. Handbook on constructing composite indicators: Methodology and user guide. 2008; Available from: http://www.olis.oecd.org/olis/2005doc.nsf/.
13. Bandura R. A survey of composite indices measuring country performance: 2008 update. New York: United Nations Development Programme, Office of Development Studies (UNDP/ODS Working Paper), 2008.
14. Aubi S, Teimory S, Nayyeri M. Hardiness, quality of life and well-being. Dev Psychol. 2010;6(24): 353-360.
15. Golparvar M, Ahmadi A, Javadian Z. Relationships Between Spiritual Capital Components with Spiritual and Psychological Well-Being. Psychol Res. 2015;17(2):30-52.
16. Abdollah Tabar H, Kaldi A, Mohagheghi Kamal H, Setare Forouzan A, Salehi M. A Study of Social Well-being among Students. Soci Welfare. 2008;8(30 and 31):171-190.
17. Rashedi V, Asadi-Lari M, Delbari A, Fadayevatan R, Borhaninejad V, Foroughan M. Prevalence of diabetes type 2 in older adults: Findings from a large population-based survey in Tehran, Iran (Urban HEART-2). Diabetes Metab Syndr. 2017;11 Suppl 1:S347-s350. 18. Asadi-Lari M, Vaez-Mahdavi MR, Faghihzadeh S, Cherghian B,
Esteghamati A, Farshad AA, et al. Response-oriented measuring inequalities in Tehran: second round of Urban Health Equity Assessment and Response Tool (Urban HEART-2), concepts and framework. Med J Islam Repub Iran. 2013;27(4):236-48.
19. Ghaedamini Harouni G, Sajjadi H, Rafiey H, Mirabzadeh A, Vaez-Mahdavi M, Kamal SHM. Current status of health index in Tehran: A multidimensional approach. Med J Islam Repub Iran. 2017;31:29. 20. Firouzabadi S, Imani Jajarmi H. Social capital and socio-economic
development in Tehran's 22 municipal districts. Soc Welfare. 2007; 6(23):197-224.
21. Iran, S.C.o. Iran Statistical Yearbook. 2018.