R E S E A R C H A R T I C L E
Open Access
Study of the association between gait
variability and physical activity
Daniela Ciprandi
1,2, Filippo Bertozzi
2, Matteo Zago
1,3, Claudia Lucia Pimenta Ferreira
1, Giuseppe Boari
4,
Chiarella Sforza
1and Christel Galvani
5*Abstract
Background:Gait variability can be considered an indirect measure of gait stability, in particular regarding temporal or spatial variability assessment. Physical activity, such as walking, is advised for the elderly and can be improved by gait stability. The aim of this study was to investigate the associations between gait stability and physical activity in women of different age ranges.
Methods:Forty-two healthy women of different age ranges (18-40 yrs. and 65-75 yrs.) were recruited in the study. To assess physical activity, the subjects wore a multi-sensor activity monitor for a whole week, inferring the time spent in moderate to vigorous physical activity (MVPA). MVPA were analysed in bouts of at least 10 subsequent minutes (MVPAbouts) and in overall minutes (MVPAtot). A kinematic analysis was performed with an optoelectronic system to calculate gait variability - expressed as standard deviation (SD) and coefficient of variability (CV) of step width, stride length, stance and swing time (during treadmill walking at different speeds).
Results:Elderly women, with high walking speed (5 km/h), and moderate step width variability (CV = 8–27%), met the recommended levels of physical activity (MVPAtotand MVPAbouts). Furthermore, gait variability, adjusted for age and number of falls, was significantly and negatively associated with MVPAtotonly at 3.5 km/h, and with MVPAbouts only at 4 km/h.
Conclusions:In a population of healthy elderly women, gait variability was significantly and negatively associated with the level of physical activity. Healthy elderly women, with moderate gait variability (step width variability), and high preferred walking speed, seem to be able to meet the recommended levels of physical activity.
Keywords:Gait stability, Treadmill walking, Daily activity, Older adults
Background
With age, structural and functional deterioration occurs in most physiological systems, despite the absence of suspected diseases. The term“elderly”applies to individ-uals aged 65 yrs. or older [1].
Regular physical activity, including aerobic exercise and muscle-strengthening activity, is essential for healthy ageing. Regular physical activity increases average life ex-pectancy, because of its positive influence on chronic disease development, as it reduces age-related biological changes and their associated effects on health and well-being, and maintains functional capacity [2]. Remarkable
evidence shows how physical activity reduces the risk of falls and injuries from falls, prevents or mitigates func-tional limitations, and is an effective therapy for many chronic diseases [3]. Older populations are generally less physically active than younger adults [2]. Although older adults may spend the same amount of time per day in exercise and lifestyle physical activities as younger nor-mally active adults do, the most popular types of phys-ical activities among older adults are significantly less demanding (walking, gardening, golf, low impact aerobic activities) than the ones performed by young adults [2].
Walking is an easily performable and a healthy form of physical activity which can be carried out at light, moderate or vigorous intensity. Walking is a convenient and daily type of exercise, requiring a significant amount of metabolic energy. Furthermore, it is the most commonly reported * Correspondence:[email protected]
5Applied Exercise Physiology Laboratory, Department of Psychology,
Università Cattolica del Sacro Cuore, Vle Suzzani 279, I-20162 Milan, Italy Full list of author information is available at the end of the article
activity in adults who meet physical recommendations [4]. The public health benefits of walking go beyond its direct physiological benefits. Walking is often a group activity that results in social interaction, which also has effects on health as indicated by evidence revealing that low social inter-action is associated with increased mortality [5]. Walking is a complex motor task generally performed automatically by healthy adults; however, walking is often no longer per-formed automatically by the elderly. Significant changes occur in gait across the life span, particularly after the age of 70. When walking, older adults require more attention concerning motor control than younger adults. Walking can result in falls, often with serious consequences. Gait im-pairments are one of the greatest risk factors for falls [6, 7]. Therefore, it is essential to identify individuals with an unstable gait in order to provide preventive and effective strategies.
Variability can be considered an indirect measure of gait stability, in particular with regard to variability of temporal or spatial measures [8]. Variability tends to increase with age [9, 10] and has been related to future impaired mobil-ity [11]. Increased gait variabilmobil-ity was further associated with many factors that are related to fall risks, such as strength, balance, and gait, but also with vitality, mental status, and quality of life. Variability was also strongly cor-related with self-reported and performance-based mea-sures of functional status [10].
Previous studies on walking in elderly adults have mainly focused on factors that influence variability. Egerton et al. [12] have recently tried to determine if temporal-spatial gait characteristics are associated with free-living ambulatory physical activity in relatively-healthy older people. Elhadi et al. [13] hypothesised that some biomechanical factors might contribute to lack of walking in older adults. However, only a small number of studies have examined the association between gait stability and the level of physical activity main-tained by general older population.
Aim of the study
The aim of this study was to compare treadmill walking at different speeds in younger and older women, in order to understand whether there is an association between gait parameters, and, particularly, gait stability, and physical activity levels (PAL).
Methods
ParticipantsTwenty-one young women and twenty-one
older women (22.6±2.9 yrs.; 68.3±3.3 yrs., respectively) were recruited in the study. Informed consent was ob-tained from all participants enrolled in the study. The inclusion criteria were: young women aged between 18 to 40, and older women aged between 65 to 75, physic-ally healthy and presenting no medical conditions that
could prevent carrying out functional assessments or ac-tivities of daily living. Exclusion criteria included any current history of acute or chronic diseases or illnesses that would influence the regular outcome of the study. Anthropometric data are reported in Table 1.
Study design An observational study was conducted for
three days to ensure sufficient rest between trials. The research included a medical screening on the first day, as well as a quality of life questionnaire, in addition to anthropometric measurements, a maximal cardiorespira-tory test and the evaluation of preferred walking speed. After one week, the resting metabolic rate was evaluated and participants wore an activity monitor for one week. After seven days, gait parameters and energy cost of walking were collected.
Materials and procedure Before starting the project,
each subject underwent a complete medical examin-ation; anthropometric measurements and number of falls in the previous year were recorded. Each subject completed a generic 36-item quality of life questionnaire, the Short Form 36v2 (SF-36v2). This questionnaire in-cluded 36 items grouped into eight scales: physical func-tioning (PF), bodily pain (BP), role-physical (RP), general health (GH), vitality (VT), social functioning (SF), role-emotional (RE) and mental health (MH). A score ran-ging from 0 to 100 was calculated for each scale. The Physical Component Summary (PCS) and the Mental Component Summary (MCS) were global scores ob-tained from the above mentioned eight scales by using calculation algorithms provided by the authors [14].
The resting metabolic rate (RMR) was measured through indirect calorimetry (Fitmate, Cosmed, Italy). A 1min test was conducted, with the first discarded 5-min. The test site was physically comfortable, and partic-ipants rested between 10 and 20 min before being assessed [15]. The average value of the last 10 min was
Table 1Anthropometric measurements in Older Adults and Younger Adults
Older Adults Young Adults
Measurements M SD M SD p-value Power ES
Height (m) 1.57 .07 1.62 .07 .0139 .713 −.7
Weight (kg) 64.5 9.1 59.1 5.9 .0287 .595 .7
BMI (kg/m2) 26.1 3.0 22.5 2.6 .0001 .992 1.3
WC (cm) 87.2 9.4 72.0 6.1 <.0001 1.000 2.0
HC (cm) 98.7 9.4 93.0 5.5 .0213 .646 .8
WHR (cm/cm) .88 .05 .77 .05 <.0001 1.000 1.2
WHtR (cm/cm) .56 .06 .44 .04 <.0001 1.000 2.4
Data are presented as mean (M), standard deviation (SD);p-value and power (one-way ANOVA); effect size (ES)
BMIbody mass index,WCwaist circumference,HChip circumference,WHR
considered for further analysis. The RMR was expressed in kcal/day and was then converted into MJ/day.
The sleep heart rate (SHR) was evaluated with the ac-tivity monitor used to gauge physical acac-tivity during the free-living observation period, and was calculated as the highest value of the 30 lowest minute-by-minute heart rate readings during the 24-h period. At least three nights were taken into consideration [16, 17].
Preferred walking speed (PWS) was assessed with Poli-femo Radio Light and Racetime 2 (Microgate, Italy) equipped with two photocells and a chronometer. Sub-jects were instructed to walk three times along a linear 14 m section at a comfortable walking pace. The PWS was calculated as the average time to walk the middle 10 m of 14 m [18, 19].
Maximal oxygen consumption (VO2max) was evaluated
during a modified Balke treadmill test [20] to exhaus-tion, with breath-by-breath indirect calorimetry (Quark CPET, Cosmed, Italy). Before the test, all the subjects performed a warm up of 12 min, 2 min for each speed from 3 km/h to 5.5 km/h, increased by 0.5 km/h. During the modified Balke treadmill test, an established speed was maintained (4 km/h for older adults and 5.5 km/h for young adults); the test was started by setting the clination at 0%; the inclination was subsequently in-creased by 2% after 1 min and by 1% every minute thereafter. In order to calculate the VO2max, all data were
reduced to 30 s averages, and the mean value of the last minute of the test was taken into consideration. Max-imal heart rate (HRmax) was considered as the highest
value at the end of the test.
Assessment of gait variability via biomechanical measures of foot kinematics provides a viable option for a quantita-tive evaluation of gait stability. Participants’ gait was re-corded at 120 Hz with a 9-camera three-dimensional optoelectronic motion capture system (BTS Spa, Milano, Italy), calibrated according to the manufacturer’s guidelines before the trials. Twenty-three body landmarks (right and left tragion, acromion, olecranum, radius styloid process, anterosuperior iliac spines, great trochanter, femoral lateral epicondyle, lateral malleolus, heel, toe, glabella, spinous process of the 7th cervical vertebra, sacrum) were posi-tioned on each participant by the same expert operator to reduce variability. Three additional markers were posi-tioned on the treadmill base. The protocol comprised 1 min standing on the treadmill: in this phase, the subject was captured in a standing position for 5 s to provide refer-ence for orthostatic position. Each subject had to walk un-interruptedly for 6 min without any support on a motor driven treadmill (TMX425C, Trackmaster, Cosmed, Italy) at six different speeds (3.0 - 3.5 - 4.0 - 4.5 - 5.0 - 5.5 km/h) resting 5 min between speeds. This rest period was added to allow metabolic values to reach basal conditions. Gait parameters and energetic measures were collected
simultaneously. A portable breath-by-breath gas analysis system (K4b2, Cosmed, Italy) was used to store data, later downloaded and analysed with appropriate software. After filtering data (6 point smoothing), mean oxygen consump-tion (VO2) and heart rate (HR) were calculated for every
speed considering the average 3 min from the 3rd to the 6th minute. In order to analyse the individual HR/VO2
cor-relation, HR values were plotted on VO2values. Regarding
biomechanical acquisitions, gait cycles were captured for 30 s, from the 3rd to the 4th minute of each speed test. Marker coordinates were tracked based on a previously cre-ated biomechanical model. Customised software within Matlab (The MathWorks Inc., Natick, MA, USA) was de-veloped for data processing. Marker coordinates were fil-tered with a 15 Hz, low-pass 2nd order Butterworth filter. Each gait cycle (GC) was time-normalised to a standard 100 value sequence. Standard gait parameters (e.g. stride length, step width and stance/swing phase duration) were computed. Mean stride length and width, and stance and swing time for each individual were determined from all strides (right and left). Only values on the right side were considered as they did not statistically differ from those on the left one (Student’s t-test). Magnitude of variability was computed using both standard deviation (SD) - assessing the magnitude of stride length and width deviations - and stance and swing time with respect to the corresponding mean value, and coefficient of variation (CV), the percent-age of the standard deviation compared to the mean: [(SD/ mean) × 100].
minutes spent in sedentary intensity, the minutes of sleep were subtracted from the numerical value of mi-nutes spent at an intensity of <1.5 METs provided by the AH software. MPA and VPA were summed to obtain the total amount of time that participants spent in moderate and vigorous physical activity (MVPA ≥3 METs). Since PA guidelines [3] recommend to accumulate MVPA in bouts of at least 10 min, MVPA was also analysed in bouts of at least 10 consecutive minutes (MVPAbouts).
Physical activity intensity was assessed through the AH using individual calibration, as suggested by Rennie et al. [26]. Individual calibration was completed by recording the following in the AH software: resting metabolic rate, sleep heart rate, maximal oxygen consumption, maximal heart rate, HR/VO2relationship.
Statistical analysis Statistical analysis was carried out with the commercial software package STATVIEW 5.0. Normal distribution was verified and data were pre-sented as the mean ± standard deviation. Statistical sig-nificance was set atp< .05.
Differences between younger adults (YA) and older adults (OA) were evaluated using a one-way ANOVA, with height as a covariate in stride length analysis. Two-way ANOVA was used to assess any significant differences in measured parameters 1) between groups (OA vs YA), 2) among speeds, and 3) interaction between the two subject groups and the different speeds. If the ANOVA indicated significant differences, the post-hoc Bonferroni method was used to perform multiple pair-wise comparisons be-tween subject groups and test speeds. A one-way ANOVA was applied to analyse differences between MVPAtot and
MVPAbouts. Agreement between MVPA (tot or bouts) and
ACSM guidelines (an average of 30 min per day) was computed using the One-Sample Sign Test. Cohen’s d ef-fect size (ES) was also determined.
The Pearson correlation test was used to study the correl-ation between gait variables and physical activity outcome measures. The first Principal component (1PC) was used to summarise data of gait SD and CV of stride length, step width, stance and swing time, given that gait variability data (SD or CV) are linked to a unique latent variable. Two backward stepwise regression analysis models were employed to examine the associations between 1PC (CV) and MVPAtotor MVPAbouts. The first model studied the
bi-variate association between CV and MVPAtotand CV and
MVPAbouts(Unadjusted model); the second controlled for
age and number of falls (Adjusted model).
Results
Differences between older adults and young adults
As expected, statistically significant (p< .05) differences, with a medium, large and huge effect size, were detected
between the two groups regarding mean height, weight, body mass index (BMI), waist circumference (WC), hip circumference (HC), waist to hip ratio (WHR) and waist to height ratio (WHtR) (see Table 1). All subjects were classified as having a healthy weight [27].
No significant differences in MCS and PCS scores were found between groups; nevertheless, YA obtained a signifi-cantly higher (p< .001) PF score, a subscale of PCS, than OA. Both VO2max and HRmax were significantly higher
(p< .001), with a huge effect size, in YA compared to OA. The number of falls was significantly different (p< .05) be-tween the two groups, with a medium effect size. No stat-istical differences were observed between groups in terms of preferred walking speed, sleep heart rate and resting metabolic rate (Table 2). Older women, with high pre-ferred walking speed (5 km/h), met the recommended levels of physical activity (MVPAtotand MVPAbouts).
Table 3 shows the minutes of physical activity, in par-ticular time spent in SED, LIGHT, MOD, VIG, MVPAtot
and MVPAbouts, for OA and YA. MVPAtotwas significantly
(p= 0.0026) higher than MVPAbouts. Only the time spent
in VIG physical activity was significantly higher (p< .05), with a large effect size, for YA when compared with OA.
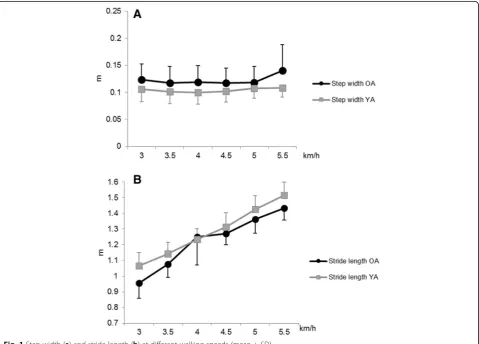
A statistical difference was found in step width (p < .05), with small and medium effect size, between the age groups. Stride length was significantly higher (p< .05), with medium, large and huge effect size, in YA than in OA (Fig. 1).
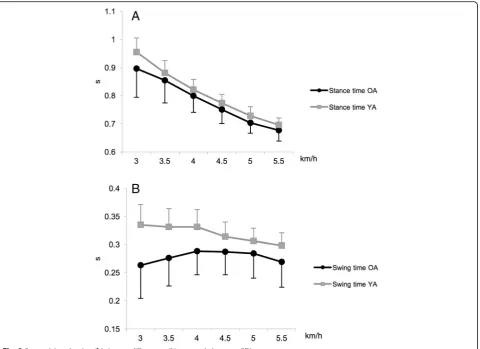
Swing and stance time measured in relation to the six speeds are shown in Fig. 2. Swing and stance time were significantly higher (p< .05), with a small, medium, large and huge effect size, in YA than in OA. Walking speed variability, expressed in terms of SD and CV, of the OA was not significantly different from the YA.
Table 2Preferred walking speed, quality of life and physiological measurements in Older Adults and Younger Adults
Older Adults Young Adults
Measurements M SD M SD p-value Power ES
MCS 48.4 9.7 47.1 7.2 .6232 .076 .2
PCS 53.3 6.8 56.9 5.4 .0664 .438 −.6
PCS (PF) 52.9 4.9 56.8 1.1 .0009 .956 −1.1
PWS (km/h) 4.8 0.5 5.0 0.7 .2461 .198 −.4
Falls (n) .5 1.0 .0 .0 .0250 .619 .7
VO2max(ml/kg/min) 26.9 5.1 39.3 4.7 <.0001 1.000 −2.6
HRmax(bpm) 162.3 6.4 194.7 8.1 <.0001 1.000 −4.6
RMR (MJ/die) 5.5 .9 5.9 1.2 .2046 .229 −.4
SHR (bpm) 59.4 4.8 58.1 8.3 .5294 .093 .2
Data are presented as mean (M), standard deviation (SD); p-value and power (one-way ANOVA); effect size (ES)
MCSmental component summary,PCSphysical component summary,PF
Speed differencesStep width did not significantly differ between speeds, while stride length significantly in-creased with speed (p< .05) (Fig. 1). Stance time signifi-cantly decreased with the increasing of speed (p < .0001), while swing time did not significantly in-crease for any speed (Fig. 2).
Significant differences in stance and swing time stand-ard deviations were found among speeds (p< .05). Stride
length variability, step width variability, stance variability and swing variability, identified as (SD) ± standard devi-ation, for all speeds, are illustrated in Fig. 3a.
Stride length, stance and swing time coefficients of variation were significantly (p < .001) influenced by speed. Stride length variability, step width variability, stance variability and swing variability, expressed as (CV) ± standard deviation, for all speeds, are shown in Fig. 3b.
With respect to CV, step width variability appeared to be larger than all the other gait parameters. Low step width variability can be considered by CV < 8% (lowest 5% of data); moderate step width variability can be mea-sured by CV = 8–27% (middle 90% of data); high step width variability can be considered by CV > 27% (high-est 5% of the data). Older women, with moderate step width variability, met the recommended levels of phys-ical activity (MVPAtotand MVPAbouts).
Regression summary A significant, moderate and positive
correlation was found between preferred walking speed and both MVPAtot (r = .324, p = .0360) and MVPAbouts
(r = .376, p = .0135), whereas no significant correlations
Table 3Sedentary and physical activity behavior
Older Adults Young Adults
Measurements M SD M SD p-value Power ES
SED (min) 685.9 116.8 730.3 111.7 .2150 .221 −.4
LIGHT (min) 223.5 104.0 201.2 67.1 .4143 .122 .3
MOD (min) 61.2 63.4 55.0 46.4 .7179 .064 .1
VIG (min) .2 .7 5.8 10.3 .0166 .686 −.8
MVPAtot(min) 61.4 63.7 60.8 52.2 .9727 .050 .01
MVPAbouts(min) 29.4 41.7 28.0 29.3 .8950 .052 .04
Data are presented as mean (M), standard deviation (SD);p-value and power (one-way ANOVA); effect size (ES)
SEDsedentary time,LIGHTlight physical activity,MODmoderate physical activity,VIGvigorous physical activity,MVPAtotmoderate and vigorous physical activity total,MVPAboutsmoderate and vigorous physical activity in bouts
were found between any gait parameters (stride length, step width, stance and swing time) and physical activity level. Significant, moderate and negative correlations were found between 1PC (CV) and both MVPAtot (p < .05) and
MVPAbouts(p < .05) for each speed, whereas no significant
correlations were found either between 1PC (SD) and MVPAtot or between 1PC (SD) and MVPAbouts. For this
reason, only 1PC (CV) was considered in gait variability measures. 1PC (CV) was significantly (p < .05) and nega-tively associated with MVPAtot at all speeds, while 1PC
(CV) was significantly (p < .05) and negatively associated with MVPAbouts only at 3.5, 4, 4.5, 5 km/h (Unadjusted
model). 1PC (CV) remained a significant (p< .05) indicator of MVPAtotalso after adjusting for age, and number of falls,
only at 3.5 km/h and of MVPAboutsonly at 4 km/h
(Ad-justed model). In all models, 1PC (CV) clarified less than 20% of the variance (Table 4).
Discussion
In this research, treadmill walking at different speeds in two groups of younger and older adults was assessed in terms of gait parameters and, particularly, of gait stability in order to study its association with physical activity levels.
The main findings of this research were that, (1) OA were as active as YA, despite being less suitable for car-diorespiratory fitness; (2) VIG physical activity was sig-nificantly higher in YA than in OA; (3) MVPAtot was
significantly higher than MVPAbouts; (4) OA presented a
different walking pattern than YA, although age related differences in walking variability were not significant; (5) gait stability, expressed as CV, influenced the level of physical activity maintained, when expressed as MVPAtot
and MVPAbouts, for both OA and YA.
Physical activity in older adults is crucial for the pre-vention of diseases, sustaining independence and im-proved quality of life. Maintaining sufficient physical activity levels in older people is an important goal. Therefore, it is essential to identify gait characteristics of people at risk of future decline of PAL, or to identify possible interventions in order to help older people re-main sufficiently physically active [12].
Direct measures of physical activity are generally consid-ered more accurate, are not prone to response and recall biases, and are often used to validate indirect measures of physical activity [28]. Accelerometry yields an objective measurement of physical activity, and has been applied in
large population-based studies of adults and older people monitoring overall physical activity, intensity-specific physical activity and time spent as sedentary time [29]. The Actiheart was developed to overcome the limitations of using solely HR or ACC data to predict physical
activity. The addition of a physiological variable (HR) should provide a more precise evaluation of physical activ-ity than using accelerometry data only, with respect to a wide range of activities [30]. Variability of conventional spatio-temporal parameters, such as standard deviation
Fig. 3Gait variability expressed as SD (a) and CV (b) (mean + SD)
Table 4Backward stepwise regression analysis between 1PC (CV) and MVPAtotand MVPAbouts
Model 1 Unadjusted Model 2 Adjusted
MVPAtot MVPAbouts MVPAtot MVPAbouts
Speed β R2 p β R2 p β R2 p β R2 p
3 −3.289 .106 .0356a −1.789 .082 .0664 −3.355 .142 .1158 −1.839 .127 .1560
3.5 −4.345 .154 .0102a −2.333 .116 .0274a −4.325 .187 .0470a −2.322 .157 .0871
4 −3.758 .120 .0246a −2.730 .166 .0075a −3.547 .139 .1233 −2.594 .189 .0452a
4.5 −3.793 .116 .0272a −2.184 .101 .0406a −3.523 .131 .1458 −1.979 .121 .1732
5 −5.269 .152 .0108a −2.648 .100 .0411a −4.965 .159 .0830 −2.374 .117 .1888
5.5 −4.162 .110 .0319a −2.176 .079a .0722 −3.892 .119 .1808 −1.921 .096 .2740
a
Statistically significant
and coefficient of variation, offers a viable method for a quantitative evaluation of gait stability. The kinematic ana-lysis system is one of the most specific and accurate methods to study gait variability [8, 9].
The study populations were composed of healthy and physically-active young and older adults, with high pre-ferred walking speed and a good quality of life. Most in-dividuals (52% of the elderly and 62% of the adults) reached recommended levels of physical activity if MVPAtotare considered. Moreover, only 24% of the
eld-erly achieved recommended levels of physical activity, compared to 43% of the adults, if MVPAbouts are taken
into account. In this case, most subjects failed to accu-mulate the health recommendations of 30 min of MVPA on 5 or more days per week. A closer focus on the range of moderate intensity activity achieved by older vs. youn-ger adults may be useful, particularly in light of the de-bate about the extent of intensive activity beneficial to older adults [31]. There were no significant differences between groups regarding the minutes spent in seden-tary activity, light activity and moderate activity. Older adults performed significantly less vigorous activities than the younger counterparts. In particular, no signifi-cant differences were detected between the time spent in MVPA when accumulated in bouts of at least 10 con-secutive minutes, or when overall minutes of MVPA were considered. The absence of difference between age groups in overall activity is consistent with the finding of another study [32]. Furthermore, young and older adults showed similar preferred walking speeds, in accordance with Kang & Dingwell [33]. The average PWS of the eld-erly in this study is high when compared with literature data collected from women aged 65–75 yrs. [34]. In addition, according to the Almeida et al. classification [35] (in which“fallers” are those having suffered two or more falls in the previous year and “nonfallers” those having suffered either no falls or only one fall in the pre-vious year), all young adults and 18 older adults can be classified as “nonfallers”, while only 3 older adults were classified as a“faller”.
The present results support the previous findings of a stride length impairment in elderly people [36], showing a decrease in stride length in older populations at almost all speeds. Indeed, in the present study, stride length ranges from 1.07 to 1.52 m in younger populations and from 0.96 to 1.43 m in older populations, respectively. A slowing of gait is also commonly reported in elderly in-dividuals. According to Daley & Spinks [36], older adults over 67 years of age spend significantly longer time in the stance phase and significantly less time in the swing phase than younger adults. The present results do not confirm these data, showing that young adults spend more time in both stance and swing phases compared to elderly people. Presumably, our subjects did not need to
modify their stance phase in order to obtain increased postural stability; as a matter of fact, they are still able to avoid a decline in speed of walking, typical of elderly.
Gait variability has become an important indicator in assessing human motor performance. According to the lit-erature, the treadmill was used to collect a high number of consecutive gait cycles to investigate gait variability [37]. Furthermore, Owings et al. suggested that, compared to variability of spatial and temporal step kinematics, treadmill walking may be an acceptable representation of overground walking [38]. Increased gait variability is a risk factor for falls in older adults. In previous studies, a greater variability has been found in older adults for stride length [33] or step width [38, 39], regardless of differences in speed. Our results do not support these findings, be-cause walking speed variability in older adults did not sig-nificantly differ from that of younger adults. Our data are consistent with those reported by Grabiner et al. [39] demonstrating that walking speed conditions influenced gait variables variability. Step width variability was larger than stride length variability when considering CV. In agreement with the literature, the present results suggest that for healthy young and older adults, gait variability of spatial parameters is a more important indicator of loco-motion control than gait variability of temporal parame-ters, and step width variability is the most sensitive descriptor of locomotion control [38]. Our cut-off values are very close to the classification of Brach et al.: low step width variability (step width variability CV < 7%; lowest 5% of sample), moderate step width variability (step width variability CV = 7–30%; middle 90% of sample), and high step width variability (step width variability CV > 30%; highest 5% of the sample). However, Brach et al. found that extreme step width variability (i.e. either too much or too little) was associated with a history of falls in older adults, walking at, or close to, normal walking speed [40].
Hence, it would be interesting to study the impact of gait stability on physical activity participation. Egerton et al. [12] found that shorter step length, shorter step time, shorter swing time and higher ca-dence were associated with lower activity. Therefore, their results did not support the view that a worsen-ing gait, analysworsen-ing gait asymmetry, caused a decline in the level of physical activity maintained by rather healthy older people. They could not evaluate gait variability, recommending examining the relationship between gait variability and physical activity in future research. Our study showed that gait variability (CV), at different speeds (3.5 or 4 km/h), was significantly and negatively associated with the level of physical activity (MVPAtot and MVPAbouts). Our models
The limitations of the study include: 1) the small sam-ple size; 2) a poor population heterogeneity; 3) the ab-sence of men in the sample selected; 4) self-selected women (selection bias); 5) only ‘young old’ elderly (65-75 yrs.). Our findings cannot unfortunately be general-ised across the general older adult population, yet they may be useful with respect to healthy women aged be-tween 65 and 75. Gait performance varies after the age of 75 and, in particular, after 80 [41], and it differs be-tween men and women at the highest speeds [42]. Fu-ture research is required for a better understanding of the association between gait stability and the level of physical activity in a wide population range, including men and less healthy and older women.
Conclusions
In a population of healthy elderly women (65-75 yr), gait variability was significantly and negatively associated with the level of physical activity. Healthy older women, with moderate gait variability (step width variability), and high preferred walking speed, seemed to meet the recommended levels of physical activity. As a practical application, these findings should be taken into account in the design of interventions aimed to improve overall activity.
Abbreviations
ACC:Movement monitor signals; AH: Actiheart; BMI: Body mass index; BP: Bodily pain; CV: Coefficient of variation; GC: Gait cycle; GH: General health; HC: Hip circumference; HR: Heart rate; HRmax: Maximal heart rate;
MCS: Mental component summary; MET: Metabolic equivalent of task; MH: Mental health; MPA: Moderate physical activity; MVPA: Moderate and vigorous physical activity; MVPAbouts: Moderate and vigorous physical activity
bouts; MVPAtot: Moderate and vigorous physical activity total; OA: Older
adults; PAL: Physical activity level; PC: Principal component; PCS: Physical component summary; PF: Physical functioning; PWS: Preferred walking speed; RE: Role-emotional; RMR: Resting metabolic rate; RP: Role-physical; SED: Sedentary; SF: Social functioning; SF-36v2: Short Form 36v2;
SHR: Sleeping heart rate; VO2: Oxygen consumption; VO2max: Maximal oxygen
consumption; VPA: Vigorous physical activity; VT: Vitality; WC: Waist circumference; WHR: Waist to hip ratio; WHtR: Waist to height ratio; YA: Young adults
Acknowledgements
Not applicable.
Funding
No funding was received for this study from National Institutes of Health (NIH), Wellcome Trust, Howard Hughes Medical Institute (HHMI), or any others.
Availability of data and materials
The datasets used and/or analysed during the current study available from the corresponding author on reasonable request.
Authors’contributions
All authors have contributed to the scientific work: (1) in the conception and design of the study, or acquisition of data, or analysis and interpretation of data, (2) in drafting the article or revising it critically for important intellectual content. Its publication has been approved by all co authors.
Ethics approval and consent to participate
All procedures performed in studies involving human participants were in accordance with the ethical standards of the institutional and/or national research committee and with the 1964 Helsinki declaration and its later amendments or comparable ethical standards. An ethical approval has been obtained from the institutional review board.
Consent for publication
Not applicable.
Competing interests
The authors declare that they have no competing interests.
Publisher’s Note
Springer Nature remains neutral with regard to jurisdictional claims in published maps and institutional affiliations.
Author details
1Movement Analysis Laboratory, Department of Biomedical Sciences for
Health, Università degli Studi di Milano, via Mangiagalli 31, I-20133 Milan, Italy.2Exercise and Sport Science Degree Course, Faculties of Education and Medicine and Surgery, Università Cattolica del Sacro Cuore, Vle Suzzani 279, I-20162 Milan, Italy.3Movlab, Movement and Posture Analysis Lab, Department of Electronics, Information and Bioengineering, Politecnico di Milano, via Golgi 39, I-20133 Milan, Italy.4Department of statistical science, Faculty of economics, Università Cattolica del Sacro Cuore, Largo Gemelli 1, I-20123 Milan, Italy.5Applied Exercise Physiology Laboratory, Department of Psychology, Università Cattolica del Sacro Cuore, Vle Suzzani 279, I-20162 Milan, Italy.
Received: 21 March 2017 Accepted: 1 November 2017
References
1. American College of Sports Medicine. Older adults. In: Pescatello LS, Arena R, Riebe D, Thompson PD, editors. ACSM’s guidelines for exercise testing and prescription 9th edition. Philadelphia: Lippincott Williams & Wilkins; 2013. p. 204–11.
2. Chodzko-Zajko WJ, Proctor DN, Ma FS, Minson CT, Nigg CR, Salem GJ, et al. Exercise and physical activity for older adults. Med Sci Sports Exerc. 2009;41: 1510–30.
3. Nelson ME, Rejeski WJ, Blair SN, Duncan PW, Judge JO, King AC, et al. Physical activity and public health in older adults: recommendation from the American College of Sports Medicine and the American Heart Association. Med Sci Sports Exerc. 2007;39:1435–45.
4. Besser LM, Dannenberg AL. Walking to public transit: steps to help meet physical activity recommendations. Am J Prev Med. 2005;29:273–80. 5. Lee IM, Buchner DM. The importance of walking to public health. Med Sci
Sports Exerc. 2008;40:512–8.
6. Bridenbaugh SA, Kressig RW. Laboratory review: the role of gait analysis in seniors’mobility and fall prevention. Gerontology. 2011;57:256–64. 7. Maki BE. Gait changes in older adults: predictors of falls or indicators of fear.
J Am Geriatr Soc. 1997;45:313–20.
8. Hamacher D, Singh NB, Van Dieen JH, Heller MO, Taylor WR. Kinematic measures for assessing gait stability in elderly individuals: a systematic review. J R Soc Interface. 2011;8:1682–98.
9. Gouelle A, Leroux J, Bredin J. Changes in gait variability from first steps to Adulthood : normative data for the gait variability index changes in gait variability from first steps to adulthood. J Mot Behav. 2016;48(3):249–55. 10. Hausdorff JM, Rios DA, Edelberg HK. Gait variability and fall risk in
community-living older adults: a 1-year prospective study. Arch Phys Med Rehabil. 2001;82:1050–6.
11. Brach J, Studenski S, Perera S, VanSwearingen J, Newman A. Gait variability and the risk of incident mobility disability in community-dwelling older adults. J Gerontol A Biol Sci Med Sci. 2007;62:983–8.
13. Elhadi MMO, Ma CZ, Wong DWC, Wan AHP, Lee WCC. Comprehensive gait analysis of healthy older adults who have undergone long-distance walking. J Aging Phys Act. 2016;11:1–26.
14. Jwj W, Sherbourne C. The MOS 36-item short-form health survey (SF-36). Med Care. 1992;30:473–83.
15. Compher C, Frankenfield D, Keim N, Roth-Yousey L. Best practice methods to apply to measurement of resting metabolic rate in adults: a systematic review. J Am Diet Assoc. 2006;106:881–903.
16. Melzer K, Schutz Y, Boulvain M, Kayser B. Pregnancy-related changes in activity energy expenditure and resting metabolic rate in Switzerland. Eur J Clin Nutr. 2009;63:1185–91.
17. Raffaelli C, Galvani C, Lanza M, Zamparo P. Different methods for monitoring intensity during water-based aerobic exercises. Eur J Appl Physiol. 2012;112:125–34.
18. Beauchet O, Annweiler C, Montero-Odasso M, Fantino B, Herrmann FR, Allali G. Gait control: a specific subdomain of executive function? J Neuroeng Rehabil. 2012;9:12.
19. Dal U, Erdogan T, Resitoglu B, Beydagi H. Determination of preferred walking speed on treadmill may lead to high oxygen cost on treadmill walking. Gait Posture. 2010;31:366–9.
20. Balke B, Ware RW. An experimental study of physical fitness of air force personnel. U S Armed Forces Med J. 1959;10:675–88.
21. Ja S, Zipunnikov V, Goldsmith J, Bai J, Simonsick EM, Crainiceanu C, et al. Assessing the physical cliff: detailed quantification of age-related differences in daily patterns of physical activity. J Gerontol A Biol Sci Med Sci Sci. 2014;69:973–9. 22. Ekelund U, Sardinha L, Anderssen S, Harro M, Franks P, Brage S, et al.
Associations between objectively assessed physical activity and indicators of body fatness in 9-to-10-y-old European children: a population-based study from 4 distinct regions in Europe (the European youth heart study). Am J Clin Nutr. 2004;80:584–90.
23. Barreira T, Kang M, Caputo J, Farley R, Renfrow M. Validation of the Actiheart monitor for the measurement of physical activity. Int J Exerc Sci. 2009;2:60–71. 24. Brage S, Brage N, Franks P, Ekelund U, Wareham N. Reliability and validity of the combined heart rate and movement sensor Actiheart. Eur J Clin Nutr. 2005;59:561–70.
25. Pate R, Pratt M, Blair S, Haskell W, Macera C, Bouchard C, et al. Physical activity and public health. A recommendation from the Centers for Disease Control and Prevention and the American College of Sports Medicine. JAMA. 1995;273:402–7.
26. Rennie K, Rowsell T, Jebb S, Holburn D, Wareham N. A combined heart rate and movement sensor: proof of concept and preliminary testing study. Eur J Clin Nutr. 2000;54:409–14.
27. Consensus document from Dietitian/ Nutritionists from the Nutrition Education Materials Online. Using body mass index. Queensland Government. 2013.
28. Kowalski K, Rhodes R, Naylor P, Tuokko H, Macdonald S. Direct and indirect measurement of physical activity in older adults : a systematic review of the literature. Int J Behav Nutr Phys Act. 2012;9:148.
29. Hansen BH, Holme I, Anderssen SA, Kolle E. Patterns of objectively measured physical activity in normal weight, overweight, and obese individuals (20-85 years): a cross-sectional study. PLoS One. 2013;8:1–8. 30. Crouter S, Churilla J, Bassett DJ. Accuracy of the Actiheart for the
assessment of energy expenditure in adults. Eur J Clin Nutr. 2008;62:704–11. 31. Davis MG, Fox KR. Physical activity patterns assessed by accelerometry in
older people. Eur J Appl Physiol. 2007;100:581–9.
32. Laudani L, Vannozzi G, Sawacha Z, della Croce U, Cereatti A, Macaluso A. Association between physical activity levels and physiological factors underlying mobility in young, middle-aged and older individuals living in a city district. PLoS One. 2013;8:e74227.
33. Kang HG, Dingwell JB. Separating the effects of age and walking speed on gait variability. Gait Posture. 2008;27:572–7.
34. Studenski S, Perera S, Patel K. Gait speed and survival in older adults. JAMA. 2011;305:50–8.
35. Almeida CWL, Castro CHM, Pedreira PG, Heymann RE, Szejnfeld VL. Percentage height of center of mass is associated with the risk of falls among elderly women: a case–control study. Gait Posture. 2011;34:208–12. 36. Daley MJ, Spinks WL. Exercise, mobility and aging. Sports Med. 2000;29:
1–12.
37. König N, Singh NB, von Beckerath J, Janke L, Taylor WR. Is gait variability reliable? An assessment of spatio-temporal parameters of gait variability during continuous overground walking. Gait Posture. 2014;39:615–7.
38. Owings TM, Grabiner MD. Step width variability, but not step length variability or step time variability, discriminates gait of healthy young and older adults during treadmill locomotion. J Biomech. 2004;37:935–8. 39. Grabiner PC, Biswas ST, Grabiner MD. Age-related changes in spatial and
temporal gait variables. Arch Phys Med Rehabil. 2001;82:31–5. 40. Brach JS, Berlin JE, VanSwearingen JM, Newman AB, Studenski SA. Too
much or too little step width variability is associated with a fall history in older persons who walk at or near normal gait speed. J Neuroeng Rehabil. 2005;26(2):21.
41. Agner S, Bernet J, Brülhart Y, Radlinger L, Rogan S. Spatiotemporal gait parameters during dual task walking in need of care elderly and young adults. A cross-sectional study. Z Gerontol Geriatr. 2015;48:740–6. 42. Barrett R, Noordegraaf MV, Morrison S. Gender differences in the variability
of lower extremity kinematics during treadmill locomotion. J Mot Behav. 2008;40:62–70.
• We accept pre-submission inquiries
• Our selector tool helps you to find the most relevant journal • We provide round the clock customer support
• Convenient online submission • Thorough peer review
• Inclusion in PubMed and all major indexing services • Maximum visibility for your research
Submit your manuscript at www.biomedcentral.com/submit