Contents lists available at www.innovativejournal.in
Asian Journal of Computer Science And Information Technology
Journal Homepage: http://innovativejournal.in/ajcsit/index.php/ajcsit
THE PREDICABILITY OF PERCEIVED ENJOYMENT AND ITS IMPACT ON THE
INTENTION TO USE MOBILE LEARNING SYSTEMS
Faisal Mubuke1, Cosmas Ogenmungu2, Geoffrey Mayoka. K 3, Ayub Kutosi Masaba4, Wesimika Andrew 5
ARTICLE INFO ABSTRACT
Corresponding Author: Faisal Mubuke
Makerere University Business School, Mbale Regional Campus [email protected] [email protected]
DOI:http://dx.doi.org/10.15520 /ajcsit.v6i8.51
Key Words: Perceived
Enjoyment, M-learning, Intention to Use, UTAUT
Although M-learning is spreading in the world, there is a lack of research addressing the impact of perceived enjoyment as one of the main predictors in enhancing students’ intention to use M-learning systems in Universities. This study focused on identifying the impact of Perceived enjoyment on influencing the intention to use M-learning in university environment. Study participants comprised 370 students from Makerere University and Kampala University, with several constructs related to Perceived enjoyment being measured. Results indicate, through Correlational analysis, that perceived enjoyment showed the great impact on the intention to use M-learning.
©2017, AJCSIT, All Right Reserved.
1.0 INTRODUCTION
Mobile learning is the latest educational technology phenomenon that employs the use of mobile computing device such as tablet PC, smart phone and other handheld devices to make learning flexible, portable, spontaneous, personal and above all exciting (Iqbal S & Qureshi, 2012). Bidin & Ziden (2013) asserts that one of the main reasons for increased attention paid towards M-learning is the increase in the number of mobile devices (such as mobile phones, PDAs, laptops, and iPads) as well as enhancements in the technological capabilities of these devices.
Pynoo et al (2011) further states that with decreasing costs these mobile devices are becoming accessible to more people. These mobile devices offer multiple features and capabilities such as making phone calls, recording audio/video, capturing pictures, storing data, and accessing the Internet. All of these functionalities can be used in an educational context.
Mobile applications and devices are changing the way that Universities conduct learning activities to provide information, deliver services and engage with the students (Abu-Al-Aish & Love, 2013). To keep up with the pace of change in technology, Universities have tried to develop and implement M-Learning information systems to support Distance learners particularly Makerere University is running distance education (DE) degree programmes managed by the Department of Distance Education to students scattered across Uganda (Kajumbula, 2009). However, Muyinda (2013) and Muyinda (2014) reveal that Universities in Uganda that have implemented M-learning such Makerere university, Kampala university among others have not registered the persistent and long term usage of these Learning systems, an indicator that
M-learning systems have not be continuously adopted and utilized by students. Muyinda (2013) states that at Makerere University, only 85 users of M-learning system were found to be active out of the thousand students. Similar scenario on E-learning usages was reported by Muyinda (2014) that 18 students were found to be active on the M-learning system installed at Kampala University. This low intention to use M-learning systems by students in these universities is attributed to student’s failure to appreciate and feel the enjoyment in the usage of M-learning system which means that the usage of such systems remains low yet maximum benefits can be realized from using M-learning system during and after its adoption (Huang, 2014). It’s upon the above background that the study aims to examine the impact of perceived enjoyment as one of the major predictor to student’s intention to use M-learning systems in Universities. Hence, this gives rise to the following research question: what is the impact of Perceived enjoyment in predicting student’s intention to use M-learning in Ugandan universities? Following this, a research objective is developed:
To examine the impact of Perceived enjoyment in predicting student’s intention to use M-learning in Ugandan universities
2.0 LITERATURE REVIEW 2.1 Perceived enjoyment
due to a possible sense of pressure during the process of learning (Wang & Li, 2012). Hence, in terms of mobile learning, it is reasonable to establish the impact of Perceived enjoyment onto the Intention to use M-learning systems.
2.2 Intention to use
Behavioral Intention to use is a measure of the likelihood that a person will adopt the application, where as the TAM uses actual usage to represent a self-report measure of time or frequency of adopting the application Bere (2014). However, it is not easy or practical to obtain an objective Measurement of an individual’s intention to engage in behavior.
Several researches have shown that both theoretical and empirical support exists for the powerful Correlation between intention to engage in a behavior and actual behavior (Al-Hujran, 2014; Park, 2012). To maintain Perceived enjoyment as a significant predictor of intention to use M-learning systems, we adopt behavioral intention as an individual’s intention to use M-learning’s systems. 2.3 The Relationship between perceived enjoyment and intention to use M-Learning
Huang (2014) study has shown that perceived enjoyment is a significant determinant of the behavioral intention to use mobile learning and mobile services. According to Vosloo (2012), it is necessary to make learning activities more enjoyable so as to promote learner’s intention to use mobile learning due to a possible sense of pressure during the process of learning. Venkatesh et al (2003) states that the rationale is that individuals who experience pleasure or enjoyment from using an information system are more likely to intend to use it extensively than those who do not.
If the user can experience enjoyment through the adoption of new technology, attitude toward adoption will be positive. A person will be more motivated to do or repeat an enjoyable activity that is enjoyable more as compared to the same activity which is not enjoyable (Jambulingam, 2013).
A study carried out by Wong (2015) it was revealed that Perceived Enjoyment had an impact on the intention to use M-learning systems. Therefore, it’s indicated that PE significantly affects intention to use learning systems via mobile devices. Prior studies of Zhou (2012) and Wu (2012) have empirically added PE to the UTAUT to predict user acceptance and adoption of a specific source, and found this construct has a positive effect on attitude towards using a specified system.
3.0 Research Design
This study adapted a quantitative research approach to collect data from students dispersed in two different universities. A self administered questionnaire was used to collect data from 370 respondents, who comprised of students of Makerere University, Kampala University. Purposive sampling was used to select students directly involved in using M-learning systems and simple random sampling was used to select the correspondents from the respective clusters in the universities.
A sample size of 370 respondents out of a population of 11, 363 Selected from two different universities in Uganda. The sample size of respondents was selected based on the table for determining sample size by Krejcie and Morgan (1970). Sample size break down
This sample is in line with Roscos’s 1970 rule of thumb that any sample between 30 and 500 is adequate.
Table 1 shows the study sample. Out of the above sample size, 232 questionnaires were returned.
Questionnaire Respondents
University Groups No of
Responden ts
Sampling Method
Makerere
University Students 220 Purposive Simple Random
Kampala
University Students 155 Purposive Simple Random
Total Sample Size for all
Universities 375
Table 1: sample size break down
3.1 Data Analysis Methods
Statistical Package for Social Scientist (SPSS) was used to analyze quantitative data that was collected using the questionnaires. Descriptive statistics was used to analyze data relating to background information using Mean, Percentages, Frequencies and Tables while Factor analysis method was used to analyze the strengths of the factors within the variables. Further to the above, Correlation analysis was used to analyze the effect of one perceived enjoyment onto Intention to use M-learning systems.
3.2 Measurement of the Variables
With the review of the existing literature, measurement of the variables was on the basis of the previous studies; Measurement items were improved to be consistent and suit the study. The respondents assessed variables such as Perceived enjoyment and students intention to adopt and use M-learning services on a five-point Likert-type scale, ranging from 5= strongly agree, 4= Agree, 3= Not Sure, 2= Disagree, 1= strongly disagree were used to determine respondents’ level of agreement / disagreement with questions / subject matters. Perceived enjoyment was measured by Systems Skill development and Systems Flexibility (Nassuora, 2012); Vosloo, 2012) as shown in the table below;
Table 2: Measurement of the Variables Variable Construct Source Perceived
Enjoyment Systems kill development, Systems Flexibility
Wang and Li (2012)
Intention to
Use Huang (2014); Abu-Al-Aish and Love (2013); Nassuora (2012); Vosloo (2012) 3.3 Reliability and Validity of the Questionnaire
Table 3: Validity and reliability results Variable Number
of Items Content Validity Index
Cronbach Alpha Coefficient Perceived
Enjoyment 10 0.778 0.897
Intention to
Use 5 0.867 0.898
Source: Primary data
According to Krishnaveni and Ranganath (2011,) the Cronbach Alpha Coefficient>0.7 and Content Validity Index>0.6 as seen in Table 3 indicate that the research instrument was valid and reliable.
4.0 FINDINGS
4.1 Background characteristics
The results in the table 4 below were generated to explore the distribution of the demographic characteristics of the respondents.
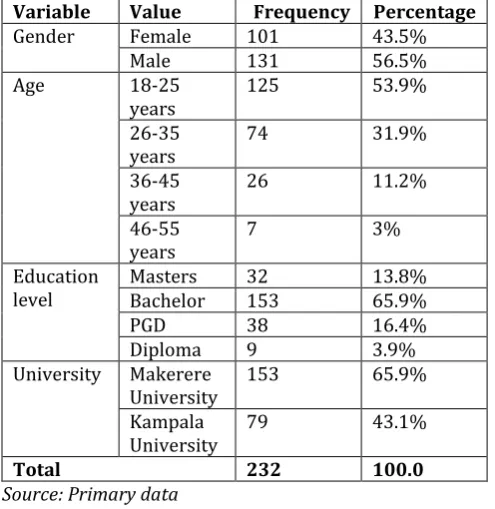
Table 4.2: Descriptive statistics of the sample in terms of frequencies and percentages
Variable Value Frequency Percentage
Gender Female 101 43.5%
Male 131 56.5%
Age 18-25
years 125 53.9%
26-35
years 74 31.9%
36-45
years 26 11.2%
46-55
years 7 3%
Education
level Masters Bachelor 32 153 13.8% 65.9%
PGD 38 16.4%
Diploma 9 3.9%
University Makerere
University 153 65.9%
Kampala
University 79 43.1%
Total 232 100.0
Source: Primary data
The demographic characteristics of the respondents indicate that 56.5% of the respondents were males whereas 43.5% were males. Hence we can conclude that the intention to adopt and use M-learning services is irrespective of their gender.
In terms of age, respondents aged between 18-25 years represented the largest part of thee sample of 53.9% whereas respondents between the age of 26-35 years represented 31.9% of the sample. In addition, respondents aged between 36-45 years represented 11.2 % of the sample and respondents aged 46-55 years represented 3% of the sample. We can conclude that students aged 18-25 have the highest intention to adopt and use M-learning followed by those aged 26-35 years.
In terms of institution distribution, 65.9% were from Makerere University and 43.1% were from Kampala University. Besides, respondents undertaking undergraduate degrees represented 65.9% of the sample, whereas respondents undertaking PGD studies represented 16.4% of the sample, respondents undertaking Master studies represented 13.8% and 3.9% were Diploma students. We can conclude that students undertaking
undergraduate degrees have the highest intention to use M-learning system.
4.2 Factor Analysis for Perceived Enjoyment
Factor analysis was carried out measure the strength of the items under the main variable.
4.2.1 Rotated Component Matrixa for Perceived enjoyment
Factor analysis was used to extract factors that measure perceived enjoyment of learning using the principal component analysis and varimax rotation methods as illustrated in table 4:
Table 5: Rotated Component Matrixa for Perceived enjoyment
Component
1 2
I believe that using M-learning will
be interesting to me .832
I believe that using M-learning
system will not be intimidating .785 I believe that M-learning will
stimulate my curiosity. .772
I will use the M-learning system for
different academic purpose .757 I believe M-learning will make me
become skilful at using a mobile
learning system .666
I believe that using M-learning will lead to my exploration of new
information technologies. .640 I believe that using M-learning
system will be flexible to interact
with .638
I believe the use of M-learning will
fit well with the way I like to study .546 I believe M- learning services will
be easy for me .891
I believe the use of M-learning service will be clear and
understandable .836
Eigen Values 4.177 2.645
% of variance 41.770 25.993
Cumulative variance % 41.7701 68.225 Extraction Method: Principal Component Analysis.
Rotation Method: Varimax with Kaiser Normalization. a. Rotation converged in 3 iterations.
Source: Primary data Key
1-
Systems Skill Development2-
Systems FlexibilitySystems Skill development. I believe M-learning will make me become skilful at using a mobile learning system (.666), I believe that using M-learning will be interesting to me (.832), I believe that using M-learning system will not be intimidating (.785), I believe that learning will stimulate my curiosity (.772), I will use the M-learning system for different academic purpose (.757), I believe that using M-learning will lead to my exploration of new information technologies (.640), I believe that using M-learning system will be flexible to interact with (.638), and I believe the use of M-learning will fit well with the way I like to study (.546).
Exploratory factor analysis was used to extract factors that measure facilitating conditions. Only values with a loading over 0.5 and Eigen values in excess of 1 were retained for analysis. Factor analysis yielded two components which were interpreted as systems skill development 41.770%) and systems flexibility (25.993%) explaining 68.225% of the variance in perceived enjoyment.
4.3 Correlations Analysis
The Pearson correlation analysis was carried out to ascertain the relationship between Perceived enjoyment and the intention to use M-learning systems.
Table 6: Correlation Analysis Study Variables Perceived
Enjoyment Intention to Use M-learning Perceived Enjoyment 1
Intention to Use .769** 1
**. Correlation is significant at the 0.01 level (2-tailed). Source: Primary data
4.3.1 Relationship between perceived enjoyment and the intention to use M-Learning
The correlation results showed a significant positive relationship between perceived enjoyment and the intention to use M-Learning (r =.769**, P<0.01). This implies that a high level of perceived enjoyment is associated with high levels of intention to use M-Learning. Similarly, a low level of perceived enjoyment is associated with a low level of intention to use M-Learning. In other words, an improvement in high level of perceived enjoyment is positively associated with an improvement in intention to use M-Learning. On the other hand, a decline in perceived enjoyment is associated with a decline in intention to use M-Learning.
4.4 Regression analysis
Table 7: Regression analysis for Perceived Enjoyment on the intention use M-learning systems
Model Unstandardized
Coefficients Standardized
Coefficients T Sig.
B Std. Error Beta
(Constant) 1.056 .358 2.729 .003
Perceived
Enjoyment . 286 . 139 . 192 2.051 .006
R = .729 R Square = .532 Adjusted R Square = .523 F statistics = 49.511 Sig. (F statistics ) = .000
a. Dependent Variable: Intention to Use Source: Primary data
The findings in table above showed that the intention to use M-learning systems in Ugandan Universities was significantly influenced by Perceived Enjoyment (beta = .192, p<0.01, Sig =.006), This implies that Perceived Enjoyment should therefore be highly considered by the University management and board members for better enhancement of students intention to adopt and use M-learning in Ugandan Universities
The regression analysis model as seen in table 4 was found to be significant and hence well specified, which means that; Perceived Enjoyment was found to be appropriately impacting student’s intention to use M-learning systems in Ugandan universities. The predictive power of the model was found to be 52.3% (Adjusted R Square = .523). This implies that Perceived Enjoyment account for 52.3% variation in impacting student’s intention to use M-learning systems in Ugandan Universities while the remaining 47.7% impacting
student’s intention to use M-learning systems is accounted for by other factors that are not part of this study. The Model specification was found to be fit and valid for this study (Sig<0.00).
DISCUSSION OF FINDINGS
The correlation results showed a significant positive relationship between perceived enjoyment and the intention to use M-Learning. This implies that a high level of perceived enjoyment is associated with high levels of intention to use M-Learning. Similarly, a low level of perceived enjoyment is associated with a low level of intention to use M-Learning. This is in line with studies carried out by Huang (2014); Jambulingam (2013) and Wong (2015) findings which empirically showed that perceived enjoyment is a significant determinant of the behavioral intention to use mobile learning and mobile services. Vosloo (2012) supported this by stating that it is necessary to make learning activities more enjoyable so as to promote learner’s intention to use mobile learning due to a possible sense of pressure during the process of learning. Venkatesh et al (2003) states that the rationale is that individuals who experience enjoyment from using an information system are more likelysto intend to use it extensively than those who do not.
CONCLUSION AND RECOMMENDATIONS
The findings from this study revealed that there was a significant positive relationship between Perceived enjoyment and the intention to use M-learning as seen with statistical details in Table 6. This is an indication that the Perceived enjoyment directly affects the intention to use M-learning systems. A detailed factor analysis and Rotated Component Matrix for Perceived enjoyment showed that all the Perceived enjoyment factors such systems skill development and systems flexibility all had a positive relationship with the intention to use M-learning systems.
From regression analysis, results showed Perceived Enjoyment was found to be appropriately impacting student’s intention to use M-learning systems in universities. In order to ensure an enhanced adoption and use of M-learning systems at higher educational levels, University management and board members should therefore highly consider Perceived Enjoyment as one of the key significant predictors and a factor that impact students intention to use M-learning systems University, Management and board members for better enhancement of students intention to use M-learning in Universities should develop mobile learning systems that promote student enjoyment of the technologies. It is necessary to make learning activities more enjoyable so as to promote students acceptance and use of mobile learning due to a possible sense of pressure during the process of learning.
Despite the fact that earlier researches have reckoned the important role of perceived enjoyment in mobile learning, few researches have attempted to identify the impact of Perceived enjoyment in enhancing student’s intention to use M-learning systems. Through reviewing literature, the study singles out and explain perceived enjoyment in impacting intention to use M-learning systems in university settings. This can be considered the main theoretical contribution of the present study.
REFERENCES
1. Abu-Al-Aish, A., & Love, S. (2013) Factors influencing students' acceptance of m- learning: An investigation in higher education. The International Review of Research in Open and Distributed Learning, 14(5): 82-107.
2. Al-Hujran, O., Al-Lozi, E., & Al-Debei, M.M. (2014) Get Ready to Mobile Learning: Examining Factors Affecting College Students' Behavioral Intentions to Use M- Learning in Saudi Arabia. Jordan Journal of Business Administration, 10(1): 111-128.
3. Bere, A. (2014) Exploring determinants for mobile learning user acceptance and use: an application of UTAUT. In Information Technology: New Generations (ITNG), 2014 11th International Conference, IEEE: 84-90
4. Bidin, S., & Ziden, A.A., (2013) Adoption and application of mobile learning in the education industry. Procedia-Social and Behavioral Sciences,
90(2013): 720-729.
Carcary, M. (2008) The Evaluation of ICT Investment Performance in terms of its Functional Deployment, A Study of Organizational Ability to Leverage Advantage from the Banner MIS inInstitutes of Technology in Ireland, Limerick Institute of Technology.
5. Huang, Y. (2014) Empirical Analysis on Factors Impacting Mobile Learning Acceptance in Higher Engineering Education, PhD dissertation 6. Iqbal, S., & Qureshi, I. A. (2012) M-learning adoption: A
perspective from a developing country. The International Review of Research in Open and Distance Learning, 3(3), 147-164.
7. Iqbal, S., & Qureshi, I.A., (2012) M-learning adoption: A perspective from a developing country. The International Review of Research in Open and Distributed Learning, 13(3): 147-164.
8. Jambulingam, M. (2013) Behavioural intention to adopt mobile technology among tertiary students. World Applied Sciences Journal, 22(9): 1262-1271.
9. Kituyi G. M. and Kyeyune R. (2012) An Analysis of E-learning Information System Adoption in Ugandan Universities: Case of Makerere University Business School. Information Technology Research Journal Vol. 2(1), pp. 1 - 7, April 2012
10. Kituyi M. G., Olupot C., Noguera, J. (2014) Factors Affecting the Adoption of Electronic Customer Relationship Management Information Systems in SMEs Journal of Studies in Social SciencesISSN 2201-4624. Volume 7, Number 2, 2014, 25-45
11. Krejcie, V and Morgan, W. (1970) Determining Sample Size for Research Activities. Educational and Psychological Measurement, 1970
12. Krishnaveni R. and Ranganath D. (2011) Development and Validation of an Instrument for measuring
the Emotional Intelligence of Individuals in the Work Environment – In the Indian Context. The International Journal of Educational and Psychological Assessment
13. Muyinda P, B., Mugisa, E., Lynch., K. (2014) M-Learning: The Educational Use of Mobile Communication Devices, un published position paper, Makerere University.
Accessed on
http://cit.mak.ac.ug/iccir/downloads/SREC_07/Paul% 20Birevu%20Muyinda%20,%20Ezra%20Mugisa%20, %20Kathy%20Lynch_07.pdf
14. Muyinda, P.B. (2013) Makerere University (Dual Mode University) Uganda. Retrieved from
www.intechopen.com/download/pdf/32516.
15. Nassuora, A. B., (2012) Students Acceptance of Mobile Learning for Higher Education in Saudi Arabia. American Academic & Scholarly Research journal 4(2) retrieved from
http://naturalspublishing.com/files/published/5z8b9f7j u9k8.pdf
16. Park, S.Y., Nam, M.W., & Cha, S.B. (2012) University students' behavioral intention to use mobile learning: Evaluating the technology acceptance model. British Journal of Educational Technology, 43(4): 592-605.
17. Pynoo, B., Devolder, P., Tondeur, J., Van Braak, J., Duyck, W., & Duyck, P. (2011) Predicting secondary school teachers' acceptance and use of a digital learning environment: A cross-sectional study. Computers in Human Behavior, 27(1): 568- 575. Sekaran, U., & Bougie, R. (2010) Research methods for business: A skill building approach. John Wiley and Sons, New Jersey, USA.
18. Venkatesh, V., Morris, M. G., Davis, G. B., & Davis, F. D. (2003) User acceptance of information technology: Toward a unified view. MIS Quarterly, 27(3), 425-478. doi: 10.2190/EC.40.1.d
19. Vosloo, S. (2012). Mobile Learning and Policies: Key issues to consider mobile learning (pp. 1–55). Paris,
France. Retrieved from
http://unesdoc.unesco.org/images/0021/002176/2 17638E.pdf
20. Wong, W.T., & Huang, N.T.N., (2015). The effects of e-learning system service quality and users' acceptance on organizational learning. International Journal of Business and Information, 6(2): 205-225. 21. Wu, W.H., Wu Y.C.J., Chen, C.Y., Kao, H.Y., Lin, C.H., &
Huang, S.H. (2012) Review of trends from mobile learning studies: A meta-analysis. Computers and Education, 59(2): 817-827.