Flynn, Colin G.
a, Rice, Matthew T.
a,*
a Department of Geography and Geoinformation Science, George Mason University, [email protected], [email protected]
* Corresponding author
Abstract:
Clear, dark night skies are harder to see now than ever before, and it will only become more difficult as people continue to move into heavily light polluted and expanding urban areas. Dark Sky Parks offer a place where anyone can go to experience true dark skies, observing the stars and other celestial bodies in conditions unencumbered by artificial light and other sources of pollution. An atlas of these Dark Sky Parks will raise awareness about their existence and locations with the goal of education and outreach. Observatories may be utilized with a similar outcome; however, they need to be located in close proximity to large populations but far enough away to optimize dark skies. This research presents an approach for mapping Dark Sky Parks in the United States through the ongoing production of Seeing the Night Sky: An Atlas of Dark Sky Parks, and a related GIS location optimization model to identify potential observatory locations in a defined study area based on land availability, slope, presence of water/floodplain, proximity to populated places, light pollution, elevation, and transportation infrastructure.
Keywords: Education, Thematic Atlas, Dark Skies
1.
Introduction
The significance of dark skies and the opportunity to observe stars and the Milky Way without the interference of light pollution is an experience now seldom afforded to less than half of the entire human population. According to a United Nations 2018 estimate, 55% of the world’s population, and 82% of the United States’ population now live in urban areas. That rate is widely predicted to keep rising, and by 2050, it could reach 75% globally (Population Facts, 2018). For thousands of years people have lived on an earth that offered unobstructed views of the cosmos, inspiring scientists such as Aristotle, Galileo Galilei, Johannes Kepler, Albert Einstein, and countless others to derive the realities of the world and universe we live in. This has only changed within the last 150 due largely to the industrial revolution and inventions of electricity and artificial light. Cities now glow in the night sky and are easily seen and identified from space while blocking out the wonders of space from their inhabitants.
While cities continue to grow, and their impact on the surrounding environment through light pollution far exceeds their physical boundaries, there are still places where people can go to experience truly dark skies. The International Dark-Sky Association (IDA), the
recognized authority on light pollution and leading organization combating light pollution worldwide, advocates for the protection of dark night skies (International Dark Sky Parks, 2014). The IDA awards the designation of Dark Sky Place in different categories to places that meet their stringent requirements on light
pollution and visibility. The description for the category of International Dark Sky Parks is “land possessing an exceptional or distinguished quality of starry nights and a nocturnal environment that is specifically protected for its scientific, natural, educational, cultural heritage, and/or public enjoyment. The land may be publicly owned, or privately owned provided that the landowner(s) consent to the right of permanent, ongoing public access to specific areas included in the IDA designation.” (International Dark Sky Parks, 2014).
Figure 1. International Dark Sky Association (IDA).
Many people are unaware of the existence of these places. Seeing the Night Sky: An Atlas of Dark Sky Parks maps each Dark Sky Park and its location relative to the closest city with pictures of the incredible scenery observable during a visit to the park. The simple act of seeing a map that shows where Dark Sky Parks are begs the question: “Where is the closest one to me?” The atlas will answer this question as it brings awareness about Dark Sky Parks to potential visitors, resulting in an increased appreciation of dark night skies. The atlas primarily uses open data and highlights the benefits and importance of open data portals and the citizen science they allow people to conduct.
eyes cannot detect on their own in such conditions. While a trip to a Dark Sky Park may not be realistic for
everyone, the convenience of powerful local telescopes can offer a more accessible method of viewing the cosmos. Observatories and telescopes built in locations that provide a balance of close proximity to major population centers and the darkness obtained with increased distance from illuminated cities have the potential to influence millions of people. These
observatories would serve the purpose of public outreach and education with a goal of encouraging and inspiring young students to pursue a career in research and science. As succeeding generations define the future, enthusiasm for science and discovery will fuel the next wave of great inventors. The opportunity for thousands of primary and secondary school students to be able to see the rings of Saturn, craters on the moon, ice caps on Mars, or the Andromeda Galaxy will inspire them and spark their interest in science. The question then becomes: where is the best place to locate an observatory? Using GIS, this project outlines an example of a location-based model for choosing the ideal site for an observatory based telescope to meet these goals.
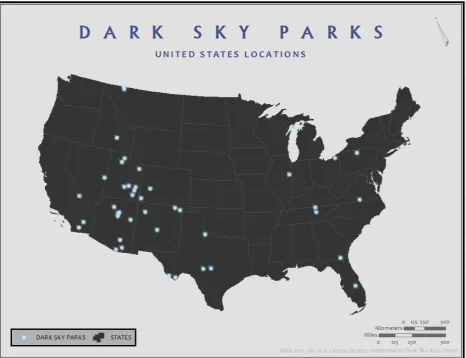
Figure 2. Dark Sky Parks Overview Map.
2.
An Atlas of Dark Sky Parks
2.1 Overview
Seeing the Night Sky: An Atlas of Dark Sky Parks seeks to bring awareness to Dark Sky Parks, and their locations in the United States. The atlas features an introductory section, detailing useful information for visiting dark sky parks and an overview map with all of the park locations. Each park will have its own two-page section, consisting of a map of the park and informationabout it. Each map will also feature an inset showing the park’s location in respect to the closest major city, with a highlighted route between them. This cartographic approach helps the map viewers feel more connected and closer to the Dark Sky Park, increasing the likelihood of them visiting a Dark Sky Park. Seeing a route from a major city that they most likely are aware of makes the Dark Sky Park seem closer and less removed from themselves and society.
2.2 Map Design & Cartography
point dataset generated from the park polygon data. 2.2.1 Overview Map
The design and cartography used in the overview map, Figure 2, are important in setting the theme and focus of Seeing the Night Sky: An Atlas of Dark Sky Parks. The theme is dark night skies removed from light pollution and locations where the naked human eye is easily able to view the objects in them. The focus of the atlas is the recognized Dark Sky Parks in the United States. Thus, the overview map has a simple base of the continental states with a dark gray fill and light gray outline for the symbology. This simplistic color selection purposely coincides with the concept of dark night skies. The dark gray tones used in the basemap not only implicitly depict the idea of dark skies, but serve as a subtle background on which the Dark Sky Park locations themselves can stand out without other distracting features or unnecessary details. With the idea of seeing the night sky, and stars specifically, the symbology for the Dark Sky Parks used a clip art image of a realistic star. The image was originally a yellow/white color that did not display well on the developed basemap. The image was edited to a blue/white color, which worked better visually with the dark gray background of the map. To complement the blue and gray main colors of the overview map, the main text (title & subtitle) uses a similar blue hue. Other, hierarchically lower text uses a gray color
Figure 3. Antelope Island State Park, Syracuse, Utah, USA.
to keep these elements secondary to the focus. 2.2.2 Dark Sky Parks Individual Maps
Each Dark Sky Park has its own section and detailed individual map, requiring a large amount of data. Each map features: hiking trails, campsite locations, optimal sky viewing locations, elevation contour lines, water, roads, and other site-specific data as applicable. This can include park headquarters, visitor centers, and other features. Each Dark Sky Park map uses terrain hillshade as a basemap, which provides helpful insight about the terrain of the park. Additionally, the use of terrain hillshade with the elevation contour lines makes points of higher elevation easily identifiable, which is often desirable for stargazing.
important because some sky viewing location and some campsites might be accessible by one but not the other.
However, data acquisition has been problematic for some of the park specific data. Because of this difficulty, a manual workflow with digitized features produced from satellite imagery, or georeferencing park map images for digitizing is necessary for the development of some of the data layers in this project. Data requests and data
availability inquiries to several state park agencies have had little response. This is particularly frustrating for some parks, such as Anza Borrego State Park in California. It is easy to find a map of the park that contains all of the relevant data needed for this project; unfortunately, the data used in it cannot be found. The credits on the map mention the use of GIS in its development, indicating the existence of all of the data. This data inquiry has received one unhelpful email reply. In such cases, digitizing can derive the relevant data from images of maps. While this process is effective, it is inefficient and time consuming. OpenStreetMap
volunteers could potentially map some of the critical park data, such as the trails in Anza Borrego State Park.
Figure 3 shows AnAtlas of Dark Sky Parks map of Antelope Island State Park, visualizing all of the discussed data. The design techniques for this map, and the other park maps, pull several elements from the overview to maintain consistency throughout the atlas wherever it is possible. The fonts used in the park maps are the same as the fonts in the overview. Although the type color is black rather than blue. All of the maps in the atlas use the same scale bars, legend properties, and north arrow. The recommended sky viewing sites’ symbology utilizes the same star clip art from the overview map. However, in the individual park maps, the yellow star stands out and works well with the other colors. The inset map size varies between each Dark Sky Park, optimizing the space in the map by taking into account the park’s shape, geographical direction, and distance from the nearest urban area that it will be connected to in the inset. The inset uses a road network to show urban areas and identify cities. Dense road networks can imply the presence of a large city without setting a limiting boundary on its extent. The road network also
demonstrates the connectivity between the park and its nearest urban neighbor. Highlighted in a burnt red color, the left side of Figure 3 shows the most direct route derived from the road network connecting the park to the urban area. This color captures enough attention to be easily identifiable without standing out too much.
Figure 3 shows that Salt Lake City is the closest urban area to Antelope Island State Park. A 2019 estimate of the entire Salt Lake City Metropolitan Area population was over 1 million people (Salt Lake City Population, 2019). Antelope Island State Park in Utah is a great example of a place where there is potential to provide the experience of dark skies to millions of people. It is a widely visited state park for its wildlife and scenery. With increased
awareness, it can draw in more people for its propensity for pristine, clear skies achievable through the atlas. 2.2.3 Dark Sky Parks Impact and Future Research Figure 4 demonstrates the outreach potential of Dark Sky Parks. Similar to Figure 2, in this map there are the Dark Sky Park locations and states. Counties and a 100-mile buffer around each park are also included. A subset of counties that intersects the buffer is included in a dark gray color. This symbolization indicates their nearness to one or more Dark Sky Parks. These counties are not inherently dark and might have large cities with massive amounts of light pollution. Some of these counties have large populations and are within easy driving distance of a Dark Sky Park. The counties shown in dark gray in Figure 4, account for nearly one third of the entire US population with almost 100 million people. The contrast between light and dark gray not only brings attention to the areas with access to Dark Sky Parks, it takes advantage of negative space to highlight the parts of the country that lack easy access to a Dark Sky Park. Figure 4 clearly depicts an absence of parks in the Great Plains, New England, and the North West.
Figure 4. Antelope Island State Park, Syracuse, Utah, USA.
3.
Modelling Locations for Astronomical
Observatories
3.1 Overview
Most people do not have easy access to a Dark Sky Park. Consequently, it is not easy to see the incredible features of the night sky. This drawback to city living can be combatted with the placement and use of an observatory. Implementation of a GIS-based location optimization exercise can effectively find locations to cite new facilities for astronomical observation. In this land analysis research, the process uses a weighted model with input layers associated with land availability (open, undeveloped parcels), slope of the terrain, water/floodplain, light pollution and visibility, elevation, transportation infrastructure, and population. These six criteria provide a base for selecting an observatory location with the goal of education and outreach. Observatory placement exercises can consider and include other criteria and factors, especially if the main purpose of the observatory would be scientific research.
3.2 Data Specifications & Justification
Land availability should be a main component in any location model since it is the most essential element. This land analysis incorporated terrain slope because building on steep slopes can be problematic. Water and floodplain data also play an important role in narrowing the
selection of potential locations. The decision to avoid and remove parcels largely covered with water or by
floodplain was due to the difficulties and dangers of building on them. Light pollution, as discussed earlier in this paper, is one of the largest problems affecting nighttime visibility. Telescopes inherently have the ability to let us see more than what is possible with our naked eye. However, the adverse effects of artificial light and other sources of pollution still hinders their observing capabilities. An ideal observatory location maintains relative nearness to the people it intends to serve, while being subjected to as little light pollution as is reasonably possible. This analysis evaluates elevation because it is optimal to have clear horizons, maximizing the amount of sky visible for observing. Parcels that have low elevation relative to the land surrounding it are not conducive to the requirements for an observatory location and do not receive any further consideration in this analysis. Constructing a tower can potentially offset some of the setbacks of lower land and an obstructed horizon. The extent to which this is effective is dependent upon the elevation disparity between the site and its surrounding area. However, while this is possible, it is expensive and makes the observatory less physically accessible. Access to existing infrastructure is an essential criterion to meeting the goals of education and outreach. Population consideration is also essential to the successful outcome of this process. However, this evaluation should take place before the analysis begins, when the researcher(s) are choosing the broader area from which to select an observatory location.
3.3 Example Model Outcome – Loudoun County
This example of a location model for an observatory uses Loudoun County, Virginia as the study area. Loudoun County is a suburb of Washington D.C., and part of the greater Washington Metropolitan area. Current estimates of Loudoun County’s population are at nearly 400,000 (Loudoun County Department of Planning and Zoning, 2017), and the dense Washington Metropolitan Area’s population is over 10 million people (District of Columbia Population, 2019). Parts of Loudoun County have very poor visibility due to large amounts of light pollution from expansive residential and commercial development. However, the western part of Loudoun County has experienced considerably less development, offering some prime locations for an observatory. Loudoun County is an ideal place to build an educational outreach observatory because of the low light pollution in the west and high population in the east, while only being roughly thirty miles from the heart of Washington D.C. Additionally, Loudoun County is home to or close to multiple space technology companies including: Orbital ATK, Lockheed Martin, Boeing, and Northrop Grumman.
3.3.1 Cartography and Map Design Techniques This research, as with the Atlas of Dark Sky Parks, uses open data as far as possible, with some data layers derived from processed imagery and digitizing. The area researched for this project was Loudoun County, Virginia. Loudoun County is exceptional at providing public data and releasing GIS products for the public to use. The process of site selection with the parameters discussed above resulted in the development of a series of four maps.
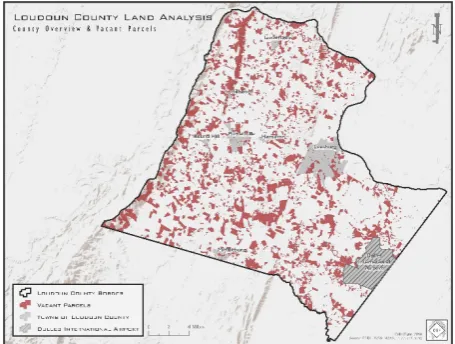
Figure 5. Loudoun County Land Analysis for Observatory Location, Overview and Vacant Parcels.
symbolize main map elements. While this is effective, it is too bold and can exaggerate the importance of some elements. Such overemphasized elements look like they exist on top of the map, rather than as part of the map. For this reason, the red used here is muted and less vibrant, allowing it to gain attention without
superimposing itself on the map. There is no border on these parcels because at this point in the process there is no reason to distinguish one parcel from another. This map, and the others in the series, use terrain hillshade as a basemap. This detracts from white space in the
background of the map while adding texture.
Figure 6 shows the second step in the model that removes all the vacant parcels with water, floodplain, or steep slopes from consideration for an observatory. A delft blue hue represents the water in the map, while a similar, slightly lighter blue represents the floodplain. With their tendency to be undeveloped and mostly enshrouded in foliage, the symbology for steep slopes is a shade of forest green. Comparing Figure 4 and Figure 6 illustrates how much land this single step in the process removes from consideration, with the land included in the next steps of the analysis represented in the same red color from Figure 5.
Figure 6. Loudoun County Land Analysis for Observatory Location, Steep Slopes & Water.
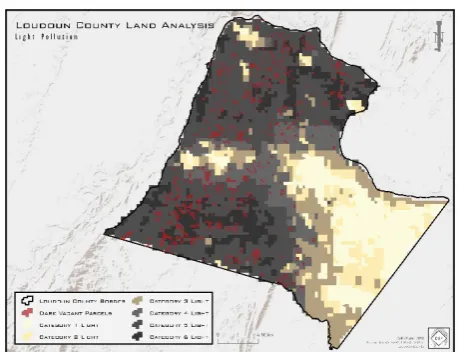
Figure 7 displays the important analysis of the light criteria. Night light data from NASA was broken down into six categories of light. The three brightest categories (categories 1, 2, 3 on the map) were subject to too much light pollution for the observatory location.
Consequently, it was necessary to remove all of the parcels contained in those light categories from consideration. Most of the removed parcels came from the densely populated eastern part of the county. The symbology of these categories are lighter and darker yellows to indicate the presence of heavy light pollution. Categories 4, 5, and 6 offered suitable darkness with category 6 being the darkest. A light to dark gray scale represents the darkness levels. All of the parcels in categories 4, 5, and 6 (in the grey areas of the map)
Figure 7. Loudoun County Land Analysis for Observatory Location, Light Pollution.
maintained the red symbology from the previous two maps, indicating their continued inclusion in the parcels considered for the final site selection.
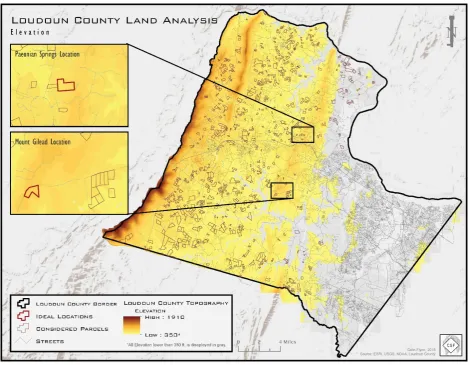
Figure 8 is the final map from this location optimization model with insets of two highlighted potential sites that meet the constraints of parcel availability, access from populated areas, sufficient screening from light pollution, and unobstructed views, among other factors. Figure 8 depicts the elevation analysis and shows its role in the final location selection. Different from the first three maps, this one shows the border for each parcel and does not use a fill. At this point in the analysis it became important to understand each parcels’ precise location and how much land it encompassed, leading to the introduction of the border. With this change, the implementation of a hollow fill allows for easy viewing of the underlying elevation for the entire study area, particularly the elevation ranges of the remaining parcels. However, in the effort of maintaining cartographic consistency, the outline color of the parcels is the same as the fill color from the other maps. Trouble locating a free digital elevation model (DEM) for Loudoun County with high enough resolution for this analysis resulted in the development of a new cartographic technique. Contour elevation lines served as the necessary data for this technique. The contour line data is so detailed it contains contours for every 4 feet. Increasing the line weight on the contour lines, creating a layer in the map that functions the same way a continuous and discrete dataset would, accomplished the desired design and visual effect of a DEM. The elevation utilized a symbology of yellow to burnt red color, with all land 350 feet or lower
displayed in light gray. This technique helps highlight the areas of interest and place the lower land in the
background of the map. This map also depicts the road network of Loudoun County to give insight to the access that the potential locations would have. The road
Figure 8. Loudoun County Land Analysis for Observatory Location, Elevation and Final Location Selection.
viewer) where the population is higher. The light pollution map, Figure 7, also accomplishes this.
Note the custom north arrow in the top right corner of all four of the maps from this series. This design represents an easily recognizable refractor telescope. The design is composed of simple shapes and a letter “N” text. Custom designed north arrows are a creative way to bring distinctiveness to maps; a unique north arrow is conceivable for most research or projects and their associated maps. The maps in this series also feature a small “CGF” logo in the bottom right corner, indicating that Colin Flynn designed the map.
4.
Summary & Conclusions
4.1 Atlas of Dark Sky Parks
There are many challenges in the development of a complete atlas. Chief among those is data acquisition. Thus far, in the research for this atlas, some data has been easy to find and download, while some has been
challenging to find or develop. Some of the data needed for this project exists, but is not freely available or is difficult to locate. There is no reason why such data should not be open and available for the public to use. Open data practices should become more widely adopted
by agencies and organizations in the United States, and in other countries around the world. This will enable a better flow of information, and encourage citizen science and research.
Seeing the Night Sky: An Atlas of Dark Sky Parks uses open data to bring awareness to the Dark Sky Parks located around the United States. These parks have pristine night skies that allow for unparalleled viewing of the cosmos. For thousands of years the stars have guided and inspired humanity. Space, the last frontier, needs scientists to help discover the secrets it holds. Inspiration to research and study science can come from a variety of sources, but none are as pure and simple as looking at the night sky. Dark Sky Parks offer that to its visitors, while the Atlas will attract more people to them.
4.2 Modelling Locations for Observatories
The example model in this research identifies two potential locations from the study area that best meet the criteria. They are open, developable parcels, close to major population centers while still maintaining relatively dark skies. Additionally, these locations have
relativistically high elevations and access to existing road infrastructure. Researchers may conduct similar exercises for other urban areas using the same parameters or they may alter the parameters to best fit their situation. Where data does not exist in open format, tools such as
OpenStreetMap can be used for requesting and having contributors crowdsource the data production. Other crowdsourced data methods may also be effective in collecting data needed for similar mapping projects in areas without open data portals.
Seeing the Night Sky: An Atlas of Dark Sky Parks and observatories located using GIS models fulfill the purposes of science education and outreach, but the extent of that potential reaches deeper. Wars and conflicts ravage across the globe, climate change’s initial
afflictions are now being felt, and the not yet manifested but impending consequences of the Anthropocene have potential to wreak havoc across the world. Looking up at the stars and appreciating what is in the celestial sky can help humanity back onto a sustainable path. Carl Sagan noted this fact while viewing the famous image of Earth from 4 billion miles away taken by the Voyager 1 spacecraft: “It has been said that astronomy is a humbling and character building experience. There is perhaps no better demonstration of the folly of human conceits than this distant image of our tiny world. To me, it
underscores our responsibility to deal more kindly with one another, and to preserve and cherish the pale blue dot, the only home we’ve ever known,” (Sagan, 1994).
5.
Acknowledgments
We would like to acknowledge The U.S. National Committee (USNC) to the International Cartographic Association for their generous funding to cover the costs of this trip. We would specifically like to acknowledge Aileen Buckley, the Chair of the USNC.
6.
Appendix
The atlas discussed in this paper details the Dark Sky Parks in the United States. However, there are other categories of Dark Sky Places. The International Dark-Sky Association awards the titles of International Dark Sky Community, International Dark Sky Park, International Dark Sky Reserve, International Dark Sky Sanctuary, Urban Night Sky Places, and Dark Sky Friendly Developments of Distinction. Of these categories, International Dark Sky Parks are by far the largest group. Outside of the United States, there are many countries in the world that have IDA recognized dark sky places: Australia, Canada, Chile, Denmark, England, France, Germany, Hungary, Ireland, Israel, Japan, Namibia, the Netherlands, New Zealand, Sark (Channel Islands), Scotland, South Korea, Spain, and Wales.
7.
References
District of Columbia Population. (2019, January).
Retrieved April 4, 2019, from
http://worldpopulationreview.com/states/district-of-columbia/
International Dark Sky Parks. (2014, October 22). Retrieved March 27, 2019, from International Dark-Sky Association website: http://darksky.org/our-work/conservation/idsp/parks/
Loudoun County Department of Planning and Zoning.
Loudoun County Demographic Fact Sheet. (2017,
December 12). Retrieved April 4, 2019 from https://www.loudoun.gov/DocumentCenter/View/10286 2/Loudoun-County-Demographic-Fact-Sheet---Dec-2017?bidId=
Population Facts. (2018, December). Retrieved April 4, 2019, from https://www.un-ilibrary.org/economic-and-
social-development/world-population-prospects_bfff872a-en
Sagan, C. (1994). Pale Blue Dot: A Vision of the Human Future in Space. New York: Random House.