Vol.7 (2017) No. 4
ISSN: 2088-5334
Comparison of Constraints Handling Methods for Economic Load
Dispatch Problem using Particle Swarm Optimization Algorithm
M. N. Abdullah
#1, Ralphael Tawai
#2, M. F. Yousof
#3 #Faculty of Electrical and Electronic Engineering, Universiti Tun Hussein Onn Malaysia, Parit Raja, 86400 Batu Pahat, Johor, Malaysia E-mail: [email protected], [email protected], [email protected]
Abstract— The main goal of economic load dispatch (ELD) problem is to find an optimal operating condition for the committed generating units in order to minimize total operational cost while satisfying the constraints. The ELD problem becomes more complicated and non-convex when valve point effects of the generator are considered. The penalty function approach (PFA) is widely used to handle the constraints in ELD problem due to simple implementation. However, it requires a proper penalty factor tuning and provides inconsistent result. This paper investigates the performances of modification of infeasible particle (MIP) method based on particle swarm optimization (PSO) for solving ELD problem. The performances of MIP and PFA methods have been compared in terms of optimal result, convergence characteristic and robustness. The proposed MIP and PFA have been tested on three standard test systems (consists of 3, 6 and 40 generating units) to validate their effectiveness. The simulation result confirmed that MIP has better convergence characteristic and more robust compared to PFA. Therefore, the MIP approach can be applied in any optimization algorithm for solving constraint ELD problem effectively.
Keywords— Constraints Handling; Economic Load Dispatch; Particle Swarm Optimization; Valve Point Effect
I. INTRODUCTION
ELD is an important optimization problem in power system operation and planning [1]. The main objective of ELD is to schedule power generator output with respect to the load demand as well as operational constraints at lower operation cost. The input-output characteristics of modern generators are nonlinear by nature because of the valve-point loadings, prohibited operating zone, multi-fuel options and rate limits [2]-[4]. Thus, the characteristics of ELD problems become multimodal, discontinuous and highly nonlinear.
The particle swarm optimization (PSO) is a population based stochastic optimization technique. This is based on the concept of swarms and their intelligence as well as their movement. This algorithm was developed in 1995 by James Kennedy and Russell Eberhart [5]. It comprises of a group of creatures (particles) performing the same action in a search space. The swarms are basically the groups that serve the same purpose like food hunting.
The PSO is inspired from the relative behaviour of the creatures that live and move in groups like swarm of birds or bees [5]. The PSO algorithm has been effectively used for solving many non-linear and non-convex optimization problems [6]–[9] . Unlike the mathematical optimization methods, this algorithm does not required any gradient
information about the objective. Thus it can obtain the best optimal solution effectively [10]-[13].
The ELD problem consists of several equality and inequality constraints such as power balance, generation limits and prohibited operating zones which required a proper constraints handling during optimization process. Currently, the penalty function approach (PFA) is widely used due to simple implementation and less complexity [14],[15] . However, it required a proper penalty factor tuning to satisfy the constraints especially the power balance constraint.
In this paper, a modification of infeasible particle (MIP) is proposed as a mechanism to handle the constraints in ELD problem using PSO algorithm. Its performances are compared with the PFA for solving ELD problem. It has been tested on three different test systems which are 3-unit test system, 6-unit test system and 40-unit test system.
II. MATERIAL AND METHOD
A. Problem Formulation of Economic Load Dispatch The main objective of economic load dispatch is to minimize the total fuel cost (Ct) of each generating unit
while satisfying the total power demand and operational constraints. The objective function of ELD problem is defined as follows:
2
1
)
( i i i i i
Ng
i i i
t C P a bP cP
C
Min =
∑
= + +=
(1)
where ai, bi and ci are the cost coefficients, ng is the
number of generator, Ci is the cost of ith generator and Pi is
the real power output of ith generator.
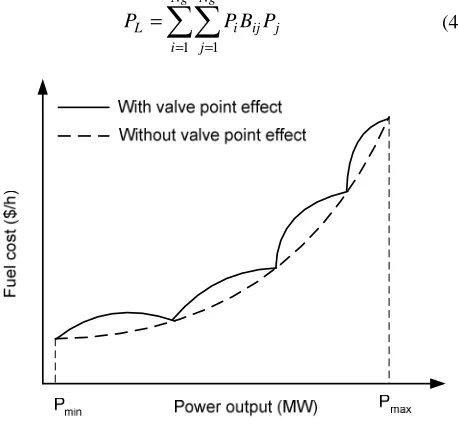
When considering the valve-point effect of the thermal generator, the cost function can be described as superposition of sinusoidal function and quadratic function. As a results, the cost function become smooth and non-linear function as shown in Fig. 1. The formulation of cost function with valve-point effect as follows:
))
(
sin(
)
(
i i i i i i2 i i imin ii
P
a
b
P
c
P
e
f
P
P
C
=
+
+
+
×
×
−
(2)where ei and fi are the cost coefficients for ith generator
reflecting valve-point effect.
The minimization of equations (1) and (2) is subjected to the power balance and power limit constraints as follows:
1) Power Balance Constraint: The total power generated must be equal to total power demand (PD) and transmission
loss (PL) as follows:
∑
= + = Ng i L Di P P
P 1
; i=1,2,…Ng (3)
The total transmission loss is a function of unit power output that can be calculated using B-coefficient. The simplest quadratic form of transmission loss is as follows:
∑∑
= = = Ng i Ng j j ij iL PB P
P
1 1
(4)
Fig. 1 Fuel cost characteristic with valve point effect
An formula extended formula that contains a linear term and a constant term is referred to Kron’s loss formula as follows:
∑
∑∑
= = = + + = Ng i i i Ng i Ng j j ij iL PB P B P B
P 1 00 0 1 1 (5)
where Bij B0j and B00 are transmission loss coefficients
matrix.
2) Power Limit Constraint: To ensure the generator in stable condition, the power generated by ith generator should restricted to the minimum (Pimin) and maximum (Pimax) limits
as follows:
max min
i i
i
P
P
P
≤
≤
(6)B. Particle Swarm Optimization for ELD Problem
PSO is a population-based algorithm which search the optimal solution in parallel using a swarm of particles. In the swarm, each particle represents a potential solution of the optimization problem. The searching behaviour of PSO is inspired by birds flocking or fish schooling for finding the food source. Each bird or fish positions is represents as particle for possible solution (x) in searching area. The movement of these particles are guided by personal best position (pbest) and global best position (gbest).
Local leader or the personal best position (pbest) represents the best position found by the ith particle itself. The global leader or the global best position (gbest) represents the global best position found by neighbours of this particle so far. Acceleration coefficients (C1 and C2) are
non-negative constants which control the influence of pbest and gbest on during searching process. The r1 and r2 are two
independent random numbers between 0 and 1.
In every iteration, the velocity of the ith particle (vik+1) is
updated according to the following formula [12], [13], [15]:
)
(
)
(
2 21 1 1 k id k d k id k id k id k k
id
w
v
c
r
pbest
x
c
r
gbest
x
v
+=
+
−
+
−
(7)where d is the number of problem variable (number of generator), vi
k
is the velocity of ith particle at iteration k and xik is the current position of ith particle at kth iteration.
The inertia weight (w) is used to control the exploration capability of particles in the search space. To enhance the exploration capability of PSO. The inertia weight is varies according to the incremental of iteration number as follows:
k k
w w w
wk ×
− − = max min max
max k=1,2,…kmax (8)
where wmin and wmax are the predefined minimum and
maximum value of weights respectively, k is the current iteration number and kmax is the maximum iteration number.
The current position or possible solution (xidk+1) is
updated according to the updated velocity in (7) and (8) as follows:
1
1 +
+
=
+
kid k id k
id
x
v
The constraints handling is an important factor in order to ensure that optimization algorithm (such as PSO) to satisfy all the equality and inequality constraints in (3) to (6). Therefore, this paper propose an effective constraint handling named modified infeasible particle (MIP) for solving ELD problem effectively instead of penalty factor approach (PFA). The details explanation of both methods are described in next section.
C. Implementation Steps of PSO for Solving ELD Problem
The following steps describe the implementation of PSO for solving the ELD problem:
Step 1: Read input data
Input data consists of generator cost coefficients, power limits and network losses coefficients.
Step 2: Initialization
Set the parameters setting for PSO (swarm size, initial velocity and maximum iteration). Then, the particle are randomly generated according to power limit constraints.
Step 3: Evaluation function
The fitness of each individual is evaluated by the evaluation function using (2) and (11) for MIP and PFA methods respectively.
Step 4: Initialization of pbest, gbest
Initial particles are set as initial pbest values, while the best fitness function among the pbest value is defined as gbest
Step 5: Update the swarm
The velocity and position are updated using equations (7) and (9).
Step 6: Constraints handling
Apply the constraints handling techniques either MIP or PFA as described in next subsection.
Step 7: Update pbest and gbest
Evaluate the fitness of particle as in Step 3. If the current value is better than the previous pbest, the current value is stored as pbest. Otherwise, it remained similar to the previous pbest. The gbest value is the best value of the current pbest.
Step 8: Stopping Condition
Repeat the Steps 4 to 8 until the maximum iteration is reached.
Step 8: Display the final results
1) Penalty Function Approach (PFA): The PFA is widely used to handle the equality constraints by converting into unconstraint problem. This approach penalized the infeasible solutions by multiplying a constant penalty for those solutions are violated the considered constraints such as power balance constraint. The penalized objective function combined the objective function with the penalized function. In general, the penalty function for a problem with m constraints can be described as follows [16]:
∑
= +
= m
i i i
p x f x K x
f
1
) ( )
( )
( (10)
where fp(x) is the penalized objective function, f(x) is the
objective function, Ki is a constant imposed for violation of ith constraint and m is the number of considered constraints.
In ELD problem, the PFA is integrated with the objective function in order to satisfy the power balance constraint in (3). The violated power balance constraint will be penalized and the evaluation function (f(pi)) can be minimize until the
constraint is satisfied. In this approach, the penalty parameter must be chosen carefully to distinguish between feasible and infeasible solutions. The evaluation function based on PFA for satisfying power balance constraints in ELD problem can be defined as follows [14],[15],[17]:
∑
∑
= =
+ − ×
+ =
Ng
i
Ng
i
L D i i
i
i F P K abs P P P
P f
1 1
) (
) ( )
( (11)
2) Modification of Infeasible Particle (MIP): The PFA method is not guarantee the all the possible solutions produced by optimization algorithm satisfied the equality constraints. This is because the equality constraint are most difficult to obtained when nonlinear problem are considered such ELD with valve point effect [18]. Therefore, the modification infeasible particle (MIP) is proposed to be applied in ELD with nonlinear characteristic without penalty factor. The MIP works by repairing the infeasible solution (violated the power balance constraints) into feasible solution that satisfied the considered constraints. It can ensure that all the possible solution generated by optimization algorithm are satisfied the constraint. The details pseudo code of MIP as follows:
Input: updated particle (Pik+1), total power demand (PD) and
transmission loss coefficients
Begin (MIP Approach)
Step 1: Calculate power balance error (ΔP): ΔP=PD-∑(Pi)-PL Step 2 Choose any jth generator number between 1 and Ng:
j = fix(rand*Ng +1)
Step 3 While ( the |ΔP| > ε ; ε is very small positive number, i.e ε=0.00001)
Set P(i,j) = P(i,j) + ΔP.
Check power limit for each generator
If (P(i,j) > Pimax
P(i,j) = Pimax end
If (P(i,j) < Pimin
P(i,j) = Pimin end
Calculate transmission loss (PL) using (5)
Calculate ΔP
Choose another jth number of generator (without repeat its own number)
End While End (MIP approach)
Output: Feasible updated particle (Pi k+1
III.RESULTS AND DISCUSSION
The MIP and PFA constraints handling approaches for ELD problem have been tested on two standard different test systems in order to reveal their performances. Both constraints handling methods are employed in PSO algorithm. The parameters setting for PSO is as follows: acceleration coefficients (C1 and C2) are set to 2 and the
swarm size is 30. The maximum iteration number is to 100 for both test systems. The Test Systems 1 and 2 are taken from [17] considering the valve-point effect and transmission losses. All the simulation works have been performed using MATLAB software.
A. Test System 1: 6-Bus 3-Unit Test System with Valve-Point Effect
Firstly, the PFA and MIP have been tested the standard 3-Unit Test System [17]. It consists of 3 generating units with total power demand of 210 MW. In this test system, valve-point effect are considered where the fuel cost coefficients and transmission loss coefficients are taken from [17].
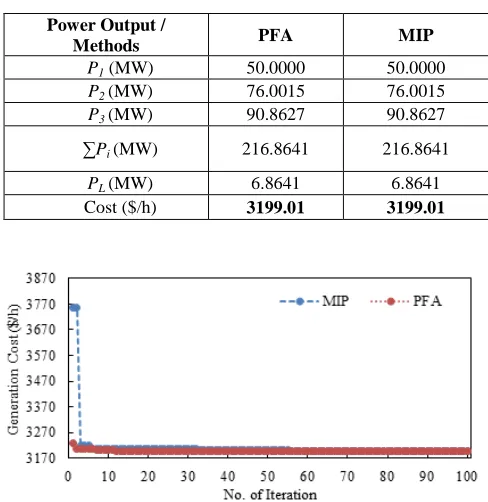
Table I shows the statistical results of both methods obtained after 30 runs. It can be seen that minimum cost produced by MIP and PFA are same for this test system. However, the average and standard deviation (SD) results achieved by MIP method is better than PFA. The optimal generator output produced by MIP and PFA are tabulated in Table II.
Fig. 2 compared the convergence characteristic both methods for finding the best cost. It clearly shows that the MIP approach reach to the lowest cost faster than PFA. In the early iteration it shows that PFA generate a very high cost of generation due to penalty for not satisfying the power balance constraints. However, the MIP solution capable lower cost since the constraints have been satisfied in every iterative process. Fig. 3 shows the MIP method can provide consistent results compared to PFA after 30 runs, thus reveal the robustness of MIP method for solving this test system.
The solution obtained by using PFA and MIP are compared with the results of existing algorithm that using the hybrid of GA-APO and NSOA [18] approach for the same test system as shown in Table III. It is found that the cost obtained by PSO is lower than the GA-APO. Therefore, the PSO with MIP constraint handling method capable to produce lower cost as well as consistent results with smallest standard deviation.
TABLE I
STATISTICAL RESULT AFTER 30 RUNS FOR PD = 210MW (TEST SYSTEM 1)
Cost ($/h) / Methods PFA MIP
Minimum 3199.01 3199.01 Average 3231.67 3199.01 Maximum 3262.75 3199.01
SD 27.5249 0.0006
*SD is standard deviation
TABLE II
COMPARISON OF OPTIMAL COST OBTAINED BY PSO WITH PFA AND MIP METHODS (TEST SYSTEM 1)
Power Output /
Methods PFA MIP
P1 (MW) 50.0000 50.0000 P2 (MW) 76.0015 76.0015 P3 (MW) 90.8627 90.8627 ∑Pi (MW) 216.8641 216.8641
PL (MW) 6.8641 6.8641
Cost ($/h) 3199.01 3199.01
Fig. 2 Convergence characteristic of PFA and MIP (Test System 1)
Fig. 3 Distribution of the minimum cost after 30 runs (Test System 1)
TABLE III
COMPARISON WITH GA-APO AND NSOA (TEST SYSTEM 1)
Power Output / Methods
GA-APO [18]
NSOA
[18] PFA MIP
P1 (MW) 61.6467 50.0000 50.0000 50.0000 P2 (MW) 95.1632 86.0678 76.0015 76.0015 P3 (MW) 60.5402 79.7119 90.8627 90.8627 ∑Pi (MW) 217.3501 215.7797 216.8641 216.8641
PL (MW) 7.3460 5.7797 6.8641 6.8641
Cost ($/h) 3341.7710 3205.99 3199.01 3199.01
B. Test System 2: IEEE 30-Bus 6-Unit Test System with Valve-Point Effect
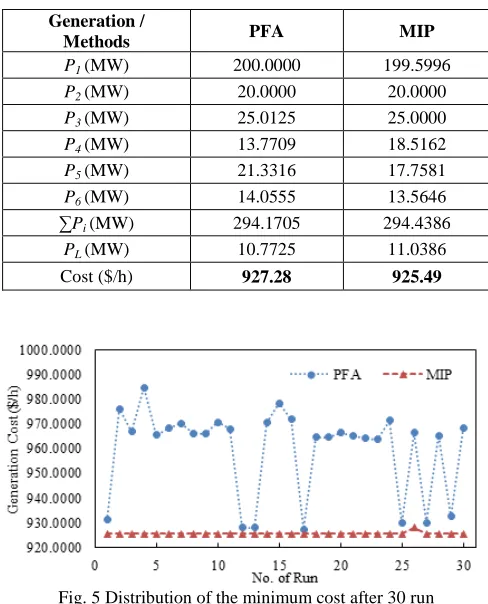
The simulation results show that MIP method can provide better result after 30 runs as shown in Table IV. The MIP method produce smallest standard deviation (SD=0.474979) compared to PFA method (SD=17.50099). The optimal generator output for both methods presented in Table V. It clearly shows that the MIP method produced lower cost compared to PFA. Thus, it shows the capability of proposed method for obtaining better generation cost with smallest standard deviation.
The convergence characteristic of PFA and MIP are shown in Fig. 4. It can be seen that the MIP achieved lower cost faster than PFA which is similar as in Test System 1. It is also capable to obtain consistent results with smallest standard deviation as shown in Fig. 5.
The comparison of MIP and PFA based PSO algorithm have been compared with the results of existing algorithm such as GA-APO, NSOA [18] and MSG-HP [17] algorithms in Table VI. It is found that the cost obtained by MIP method is lower than the GA-APO and PFA methods. It found that the PSO with MIP constraints handling method can produce better cost and lower standard deviation.
TABLE IV
STATISTICAL RESULT AFTER 30 RUN FOR PD = 283.4 MW (TEST SYSTEM 2)
Cost ($/h) / Methods PFA MIP
Minimum 927.2819 925.4947 Average 959.6878 925.5868 Maximum 984.6240 928.0992
SD 17.50099 0.474979
*SD is standard deviation
Fig. 4 Convergence characteristic of PFA and MIP (Test System 2)
TABLE V
COMPARISON OF OPTIMAL COST OBTAINED BY PSO WITH PFA AND MIP METHODS (TEST SYSTEM 2)
Generation /
Methods PFA MIP
P1 (MW) 200.0000 199.5996 P2 (MW) 20.0000 20.0000 P3 (MW) 25.0125 25.0000 P4 (MW) 13.7709 18.5162 P5 (MW) 21.3316 17.7581 P6 (MW) 14.0555 13.5646 ∑Pi (MW) 294.1705 294.4386
PL (MW) 10.7725 11.0386
Cost ($/h) 927.28 925.49
Fig. 5 Distribution of the minimum cost after 30 run (Test System 2)
IV.CONCLUSION
This paper investigated the performances of two different constraints handling methods which are modification of infeasible particle (MIP) and penalty factor approach (PFA) for solving constraint ELD problem with valve point effect. Both methods have been employed in PSO algorithm and compared with the reported results. Based on this study, it should be highlighted that the constraints handling method also influence the performance of optimization algorithm such as PSO. It found that the proposed MIP constraint handling is capable to provide good result (lower cost) compared to PFA method for solving ELD problem with valve point effect.
TABLE VI
COMPARISON WITH OTHER ALGORITHMS (TEST SYSTEM 2)
Generation / Methods GA-APO [18] NSOA [18] MSG-HP [17] PFA MIP
P1 (MW) 133.9816 182.4784 199.6331 200.0000 199.5996
P2 (MW) 37.2158 48.3525 20.0000 20.0000 20.0000
P3 (MW) 37.7677 19.8553 23.7624 25.0125 25.0000
P4 (MW) 28.3492 17.1370 18.3934 13.7709 18.5162 P5 (MW) 18.7929 13.6677 17.1018 21.3316 17.7581 P6 (MW) 38.0525 12.3487 15.6922 14.0555 13.5646 ∑Pi (MW) 294.1600 293.8395 294.5829 294.1705 294.4386
PL (MW) 10.7563 10.4395 11.1830 10.7725 11.0386
Moreover, the MIP also can produce consistent results with smallest standard deviation after 30 runs. Therefore, the MIP method is suitable to be implemented with any optimization algorithm for solving constraints ELD problem effectively.
ACKNOWLEDGMENT
The authors would like to thank Universiti Tun Hussein Onn Malaysia (UTHM) for supporting this research under Short Term Research Grant (U639).
REFERENCES
[1] B. Vanaja, S. Hemamalini, and S. P. Simon, “Artificial Immune based Economic Load Dispatch with valve-point effect,” 2008 IEEE Region 10 Conference, 2008, pp. 1–5.
[2] S. Jiang, Z. Ji, and Y. Shen, “A novel hybrid particle swarm optimization and gravitational search algorithm for solving economic emission load dispatch problems with various practical constraints,” Int. J. Electr. Power Energy Syst., vol. 55, no. 0, pp. 628–644, 2014. [3] G. Binetti, A. Davoudi, D. Naso, B. Turchiano, and F. L. Lewis, “A
Distributed Auction-Based Algorithm for the Nonconvex Economic Dispatch Problem,” IEEE Trans. Ind. Informatics, vol. 10, no. 2, pp. 1124–1132, 2014.
[4] Y. Zhang, D. W. Gong, N. Geng, and X. Y. Sun, “Hybrid bare-bones PSO for dynamic economic dispatch with valve-point effects,” Appl. Soft Comput. J., vol. 18, pp. 248–260, 2014.
[5] J. Kennedy and R. Eberhart, “Particle swarm optimization,” Neural Networks, 1995. Proceedings., IEEE Int. Conf., vol. 4, pp. 1942–1948 vol.4, 1995.
[6] M. N. Abdullah, A. H. A. Bakar, N. A. Rahim, H. A. Illias and J. J. Jamian, “Modified Particle Swarm Optimization with Time Varying Acceleration Coefficients for Economic Load Dispatch with Generator Constraints,” J Electr Eng Technol, vol. 9, no. 1, pp. 15–26, 2014. [7] T. Niknam and H. Doagou-Mojarrad, “Multiobjective
economic/emission dispatch by multiobjective θ-particle swarm optimisation,” IET Gener. Transm. Distrib., vol. 6, no. 5, pp. 363–377, 2012.
[8] H. E. Mostafa, M. A. El-Sharkawy, A. A. Emary, and K. Yassin, “Design and allocation of power system stabilizers using the particle swarm optimization technique for an interconnected power system,” Int. J. Electr. Power Energy Syst., vol. 34, no. 1, pp. 57–65, 2012. [9] A. Z. Ihsan Mohd Yassin, et al., "Binary Particle Swarm Optimization
Structure Selection of Nonlinear Autoregressive Moving Average with Exogenous Inputs (NARMAX) Model of a Flexible Robot Arm," International Journal on Advanced Science, Engineering and Information Technology, vol. vol. 6, p. 8, 2016.
[10] M. Basu, “Modified particle swarm optimization for nonconvex economic dispatch problems,” Int. J. Electr. Power Energy Syst., vol. 69, pp. 304–312, 2015.
[11] K. K. Mandal, S. Mandal, B. Bhattacharya, and N. Chakraborty, “Non-convex emission constrained economic dispatch using a new self-adaptive particle swarm optimization technique,” Appl. Soft Comput., vol. 28, pp. 188–195, 2015.
[12] P. Jong-Bae, L. Ki-Song, S. Joong-Rin, and K. Y. Lee, “A particle swarm optimization for economic dispatch with nonsmooth cost functions,” IEEE Trans. Power Syst., vol. 20, no. 1, pp. 34–42, 2005. [13] G. Zwe-Lee, “Particle swarm optimization to solving the economic
dispatch considering the generator constraints,” Power Syst. IEEE Trans., vol. 18, no. 3, pp. 1187–1195, 2003.
[14] K. T. Chaturvedi, M. Pandit, and L. Srivastava, “Particle swarm optimization with time varying acceleration coefficients for non-convex economic power dispatch,” Int. J. Electr. Power & Energy Syst., vol. 31, no. 6, pp. 249–257, 2009.
[15] E. Zahara and Y.-T. Kao, “Hybrid Nelder–Mead simplex search and particle swarm optimization for constrained engineering design problems,” Expert Syst. Appl., vol. 36, no. 2, pp. 3880–3886, Mar. 2009.
[16] R. Maan, O. Mahela, and M. Gupta, “Economic Load Dispatch Optimization of Six Interconnected Generating Units Using Particle Swarm Optimization,” iosrjournals.org, vol. 6, no. 2, pp. 21–27, 2013. [17] C. Yaşar and S. Özyön, “A new hybrid approach for nonconvex economic dispatch problem with valve-point effect,” Energy, vol. 36, no. 10, pp. 5838–5845, 2011.