ISSN 0975-928X
Research Article
Genetic appraisal of F
2generation of Dolichos bean for yield and yield
attributing traits
S.C. Venkatesha1*, B.C. Ajay2, P.H. Ramanjini Gowda3, M. Byregowda4, and K.N. Ganapathy5
1College of Horticulture, Mysore 571130, UHS Bagalkot, India 2
Directorate of Groundnut Research, Junagadh, Gujarat 362001, India
3All India Co-ordinated Research Project on Pigeonpea, University of Agricultural Sciences, Bangalore 560 065, India 4
Department of Biotechnology, University of Agricultural Sciences, Bangalore 560 065, India
5
Directorate of Sorghum Research, Rajendranagar, Hyderabad 500 030, India E-mail: [email protected]
(Received:22 Jul 2015; Accepted:05 Aug 2016)
Abstract
In the present study F2 generation was evaluated for yield and yield contributing traits to understand genetic variability and
association among yield contributing traits in dolichos bean. High phenotypic and genotypic coefficient of variability (PCV and GCV) was observed for first flowering initiation and total seed weight per plant in both the crosses. The differences between PCV and GCV values were narrow for all the traits studied, which indicates the low level of environmental influence in the expression of these traits. High heritability and GAM was noticed for all the traits studied in both the crosses indicating that influence of additive gene effects in expression of these characters. Skewness and kurtosis indicate that seed weight per plant (SW/P) was governed by complementary gene interaction with fewer numbers of dominant genes. Hence, SW/P could be increased either by increasing 100SW or seeds per pod among the crosses studied.
Key words
Dolichos, variance, heritability, correlation, yield, skewness, kurtosis
Introduction
Dolichos bean (Lablab purpureus L.) is cultivated to a large extent in Karnataka and contributes a major share, accounting for nearly 90% in terms of both area and production in the country. In Karnataka it occupies an area of 79,000 hectares with production of 68,000 tones and productivity of 908 kg/ha (Anonymous, 2009). There is no single known variety/cultivar which has occupied a large area in Karnataka; local types, traditional farmer collections and cultivars are being cultivated. Dolichos bean is a drought tolerant crop so it is an excellent crop to be grown in dry lands with limited rainfall.
For any crop improvement program, basic information on the variability present in the crop is essential. An insight into the magnitude of variability present in a crop species is of utmost importance as it provides the basis for effective selection. Yield, being a complex trait, is collectively influenced by various component characters, which are polygenitically inherited and highly influenced by environmental variation. The total variation i.e., phenotypic variation, present in a population arises due to genotypic and environmental effects. Phenotypic variability is the observable variation present in a character in a population: it includes both genotypic and environmental components of variation and as a result, its magnitude differs under different environmental conditions. Genotypic variation, on the other hand, is the component of variation, which is due to the genotypic differences among individuals within a population and is the main
concern of plant breeders; because it is heritable and can therefore, in principle, be manipulated in a breeding program
In crop improvement, the genetic component of variation is very important since only this component is transmitted to the next generation and therefore responds to selection (Ajay et al., 2013). The extent of the contribution of genotype to the phenotypic variation for a trait in a population is ordinarily expressed as the ratio of genetic variance to the total variance, i.e. phenotypic variance, for the trait (Lush, 1949). This ratio is known as heritability. Keeping this in view present study was carried out to understand variation, heritability and genetic advance in F2
generations of dolichos bean.
Materials and method
The study was conducted at All India Co-ordinated Research Project (AICRP) on Pigeonpea, University of Agricultural Sciences (UAS), Bengaluru, India. Materials used for this study consisted of F2 and F3 generations from two
crosses namely HA-4 × CPI 31113 & HA-4 × CPI 60216. Hybridization was carried out under insect proof nylon net to prevent natural out-crossing to produce sufficient F1 seeds.
Morphological traits such as plant type, flower color, pod color, seed color and seed size were used as markers to check the trueness of F1 plants.
The phenotypic observations were recorded till harvest. At the onset of flower initiation the whole plot was covered with net to avoid the possible cross pollination i.e., the F1 plants were allowed to
ISSN 0975-928X
self. Genetic parameters viz., PCV and GCV were estimated as suggested by Burton and De vane (1953) and classified into low (0 - 10%), moderate (10.1% - 20%) and high (>20%) as suggested by Robinson et al. (1949). Heritability in broad sense for all the characters was computed by the formula suggested by Lush (1949) and classified into low (0 - 30%), Moderate (30.1% - 60%) and High (>60%) as suggested by Robinson et al. (1949). Genetic advance (GA) and genetic advance as per cent mean (GAM) was estimated according to the formula given by Johnson et al. (1955). The genetic advance as per cent of mean was categorized as suggested by Johnson et al. (1955) into low (0 - 10%), moderate (10.1% - 20%) and high (20% and above). Phenotypic coefficients of correlation between two characters were determined by using variance and covariance components (Al-jibouri et al., 1958). Path coefficient analysis was carried out using the phenotypic correlation coefficients to know the direct and indirect effects of the yield components on grain yield following the method suggested by Wright (1923) and as illustrated by Dewey and Lu (1959).
Result and discussion
Two F2 populations viz., HA4 × CPI 31113 and
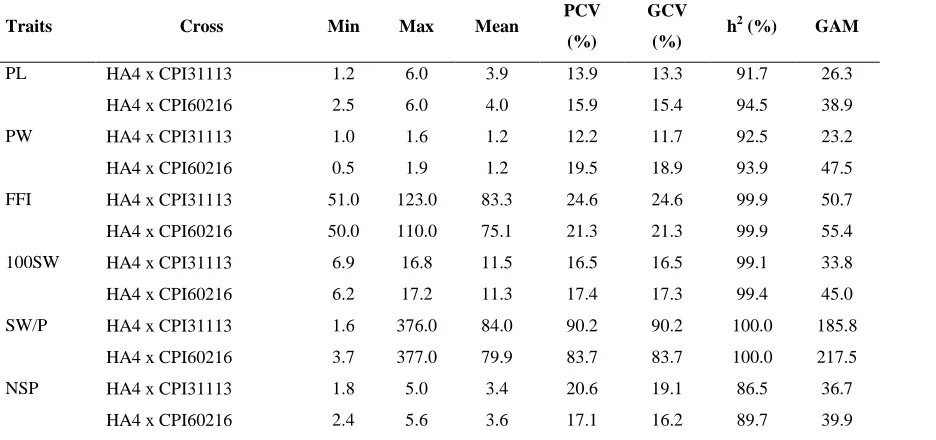
HA4 × CPI 60216 along with their parents and hybrids were studied for the variability parameters viz., mean genotypic coefficient of variation (GCV), phenotypic coefficient of variation (PCV), heritability in broad sense and genetic advance as percent of mean with respect to first flower initiation, pod length (cm), pod width, test weight (g), number of seeds per pod and seed yield per plant in the F2 population of the two crosses (Table
1).
Mean performance of F2 segregants: In cross HA4
× CPI 31113 PL ranged from 1.2 - 6.0 cm with a with an average of 3.94cm (Table 1); PW ranged from 1.0 - 1.6 cm with an average of 1.22; FFI ranged from 51.0 - 123 days after sowing with an average of 83.31 days; 100SW ranged from 6.92 - 16.76 g with an average of 11.54 g; NSP ranged between 1.8 - 5.0 with an average of 3.41 and SW/P ranged from 1.55 - 375.95 g with an average of 79.88 g.
In cross HA4 × CPI 60216 longest pod noticed was 6.0 cm and the least 2.5 cm long with a mean PL of 3.95 cm; the widest pod observed was 1.9 cm and the narrowest 0.5 cm long with a mean PW of 1.20 cm; FFI started on 50th day and the last to initiate flowering was on 110th day with a mean days to first flowering of 75.09; highest 100SW recorded was 17.18 g and the least 6.15 g with a mean test weight of 11.31 g; maximum SW/P observed was 376.98 g and the minimum 3.73 g with an average SW/P of 79.88 g; finally NSP ranged between 2.4 and 5.6 with a mean 3.64.
Variability and genetic advance: Variability is
prerequisite for progress of any breeding program. Hence assessment and quantification of variability is of prime importance. Variability can be quantified in terms of range which also includes environment and genotype x environmental interaction. True breeding value of the genotype can be known by bifurcating the phenotypic variability into heritable (genetic) and non-heritable (environmental) components. In this direction, the components of variance such as phenotypic coefficient variance (PCV) and genotypic coefficient of variance (GCV) were computed for all the characters studied in F2
generation.
High PCV and GCV was observed for FFI and SW/P in both the crosses which is in agreement with results of Basavarajappa and Byregowda (2004) and Mohan and Aghora (2006). PL, PW, NSP and 100SW showed moderate GCV and PCV in both the crosses (Table 1). Similar results were obtained by Thangavelu (1979). The differences between PCV and GCV values were narrow for all the traits studied, indicating low level of environmental influence in the expression of these traits. A wider genetic variability present among these F2 populations for yield and yield attributing
traits reflects their suitability as a mapping population.
However phenotypic coefficient of variability is not very reliable since it includes both genetic and environmental effects and if the latter portion is large, selection will be inefficient. The genotypic coefficient of variation indicates only the extent of genetic variation present in different characters and does not indicate the heritable portion. This could be ascertained from the heritability estimates, which in broad sense, includes only variability due to both additive and non-additive gene effects and in narrow sense includes only fixable variability due to additive components. Thus, heritability value is significant to a breeder, since, its magnitude indicates the accuracy with which a genotype can be recognized by phenotypic expression. In the present study heritability in broad sense was calculated. High heritability was noticed for all the traits studied in both the crosses HA4 × CPI31113 and HA4 × CPI60216 (Table 1). Similar results were observed by Dahiya and Pandita (1989).
ISSN 0975-928X
crosses (Table 1). High genetic gain suggests the influence of additive gene effects in expression of these characters (1992)
Variability studies indicate the potential contributors for grain yield, but fail to enlighten on the nature and extent of relationship between grain yield and its contributing characters, as well as among themselves. Information to this effect could be obtained through correlation co-efficient, which throws light on traits to be considered for augmenting the grain yield. Genetic correlation between various plant characters arises because of linkage, pleiotropy or developmental interrelatedness (Lebreton et al., 1995) including functional relationship. Information on the nature and magnitude of association among various traits facilitate the breeders in identification and selection of superior genotypes for complex traits such as yield.
Character association: In any crop improvement
program, it becomes necessary to have simultaneous selection of more than one character, especially in the case of complex character like yield, which is influenced by many other contributing traits. Correlation of characters serves as a measure and forms the basis of selection as it gives strength and direction of relationship between the characters studied. Selection for yield will be effective, only when it lies along with yield components rather than relying on yield alone (Grafius, 1960). When a breeder applies selection pressure for a trait, it also brings about a simultaneous change in all other characters associated with it. In addition to the variability analysis, correlation coefficients help breeders in determining the direction of selection and number of characters to be considered in improving the yield and quality attributing traits.
The phenotypic correlations were estimated in F2
generation of two crosses namely HA4 × CPI 31113 and HA4 × CPI60216 and results are presented in the table 2. SW/P exhibited significant positive association with 100SW in cross HA4 × CPI 31113 and NSP in cross ‘HA4 × CPI60216’. 100 SW had positive association with PW and negative association with NSP which indicates the distribution of energy between seeds reduced the seed size which in turn reduced the test weight. PL had positive association with PW and NSP. Hence increased seed yield could be achieved by increasing 100 SW or NSP. Positive association of 100SW with SW/P was also reported by Dahiya et al. (1991), Basavarajappa and Byre gowda (2004) and Ali et al. (2005).
The path coefficient estimated in the cross HA4 × CPI 31113 is presented in the table 3. Among the characters studied, 100SW recorded highest positive direct effect towards SW/P followed by
NSP. Significant correlation of 100SW with SW/P was due to high direct effect whereas other characters had low indirect effect. These results are in accordance with Basavarajaiah et al. (1999) and Ram Dhari et al. (2004) and Anuradha et al. (2007). Positive correlation of NSP with seed yield was mainly due to positive direct effect and negative indirect effect through 100SW.
Skewness and Kurtosis: The study of distribution
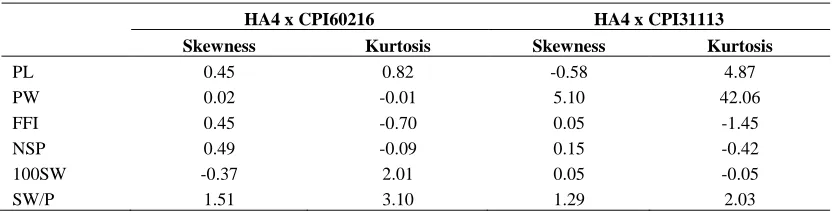
using skewness and kurtosis provides information about nature of gene action (Fisher, 1932) and number of genes controlling the traits (Robson, 1956) Positive skewness is associated with complementary gene action while negative skewness is associated with duplicate (additive × additive) gene interactions. Genes controlling the traits with skewed distribution tend to be dominant irrespective of whether they have increasing or decreasing effect on the trait. The traits with leptokurtic and platykurtic distribution are controlled by fewer and many genes respectively. Kurtosis is negative or close to zero in absence of gene interaction and positive in presence of gene interaction [Pooni et al., 1977; Choo and Reinbergs, 1982).
In F2 generation of a cross HA 4 × CPI 60216 all
the characters were positively skewed except 100SW which was negatively skewed (-0.37) (Table 4). In cross HA 4 × CPI31113 except PL all other characters were positively skewed. Presence of positive skewness indicates that traits are governed by complementary gene interaction. Distribution curve in cross HA 4 × CPI60216 showed that traits viz., PW, FFI and NSP were platykurtic with kurtosis value less than ‘0’ where as PL, 100SW and SW/P was leptokurtic with kurtosis value greater than ‘0’. Distribution curve of cross HA 4 × CPI 31113 shows that 100sw, NSP and FFI were platykurtic with kurtosis value less than ‘0’ while traits like SW/P, PL and PW were leptokurtic with kurtosis value more than ‘0’. Positive kurtosis values for SW/P and PL indicates the presence of gene interaction and further it also indicates that these traits are governed by fewer numbers of dominant genes with majority having increasing effect.
Overall, the important yield attributing traits in the present study namely SW/P and PL were governed by complementary gene interaction with fewer numbers of dominant genes. 100SW had positive association with SW/P. Most of the traits studied had high heritability and high GAM which influence of additive gene effects in expression of these characters.
Acknowledgement
ISSN 0975-928X
the Kirkhouse Trust, the design, execution or interpretation of this research remains wholly the responsibility of the authors.
References
Ajay, B.C., Gnanesh, B.N., Ganapathy, K.N., Byregowda, M., Prasad, P.S., Veerakumar, G.N., Venkatesha, S.C., Abdul Fiyaz, R. and Ramya, K.T. 2013. Genetic analysis of yield and quantitative traits in pigeonpea (Cajanus cajan L. Millsp.). Euphytica,186: 705–714 Ali, F., Sikadar, B., Roy, A.K. and Joarder, O.I. 2005.
Correlation and genetic variation of twenty different genotypes of Lablab bean, Lablab perupureus (L.) Sweet. Bangladesh Journal of Botany, 34: 125-128.
Al-jibouri, H.A., Miller, P.A. and Robinson, H.F. 1958. Genotypic and environmental variances in upland cotton of inter-specific origin.
Agronomy J., 50:633-637
Anonymous. 2009. Agricultural statistics at a glance, published by Directorate of Economics and Statistics, Ministry of Agriculture, Government of India, New Delhi
Anuradha, B., Koteshwara rao, Y., Rama kumar, P.V. and Srinivasa rao, V. 2007. Correlation and path analysis for seed yield and yield contributing characters in pigeonpea [Cajanus cajan (L.) Millsp]. The Andhra Agricultural J.,
54: 9-12
Basavarajaiah, D., Byre gowda, M., Kulkarni, R.S. and Ramesh, S. 1999. Character association and path coefficient analysis in pigeonpea (Cajanus cajan (L.) Millsp.). Crop Res., 17: 386-389
Basavarajappa, P.S. and Byregowda, M. 2004. Assessment of field bean germplasm of southern Karnataka and isolation of elite genotypes. Mysore J. Agric. Sci.,38: 474-479 Burton, G.M. and De Vane, E.M. 1953. Estimating
heritability in tall Fescue (Festuca arundinaceae) from replicated clonal material.
Agronomy J., 45: 478- 481
Choo, T.M. and Reinbergs, E. 1982. Analysis of slewness and kurtosis for detecting gene interaction in a double haploid. Crop Sci.,22: 231-235
Dahiya, M.S. and Pandita, M.L. 1989. Variability studies in Indian bean (Dolichos lablab L.).
Haryana Journal of Agronomy,5: 5-8 Dahiya, M.S., Pandita, M.L. and Vashistha, R.N. 1991.
Correlation and path analysis studies in sem (Dolichos lablab var. lignosus L.). Haryana Journal of Horticultural Science, 20: 134-138 Dewey, D.R. and Lu, K.H. 1959. Correlation and path
coefficient analysis of components of crested wheat grass seeds production. Agronomy J.,
51: 515-520
Fisher, R.A., Immer, F.R. and Tedin, O. 1932. The genetical interpretation of statistics of third degree in the study of quantitative inheritance.
Genetics,17: 107-124.
Grafius, J.E. 1960. Does over dominance exist for yield in crops. Agronomy J.,52: 361
Johnson, H.W., Robinson, H.E. and Comstock, R.E. 1955. Estimates of genetic and environmental variability in soybean. Agronomy J., 47: 314-18
Lebreton, C., Jancic, V.L., Pekic, S.S. and Quarrie, S.A. 1995. Identification of QTL for drought responses in maize and use in testing causal relationships between traits. Journal of Experimental Botany,46: 853-865
Lush, J.L. 1949. Heritability of quantitative characters in farm animals. In: Proc. 8th Cong. Genet.
Heriditas,35: 356-375
Mohan, N. and Aghora, T.S. 2006. Variability, diversity and distribution of Dolichos (Lablab purpureus L.) and races in the central districts of Tamil Nadu. In: Proceedings of First International Conference on Indigenous Vegetables and Legumes, 12-15 December, 2006, Patancheru, AP, India
Pooni, H.S., Jinks, J.L. and Cornish, M.A. 1977. The causes and consequences of non-normality in predicting the properties of recombinant inbred lines. Heredity,38: 329-338
Ram dhari., Waldia, R.S. and Malik, B.P.S. 2004. Association of seed yield with its component traits in pigeonpea. National Journal of Plant Improvement,6: 119-120
Reddy, M., Viswanath, S.R., Satyan, B.A. and Wali, M.C. 1992. Genetic variability, heritability and genetic advance for yield and yield contributing characters in Field bean (Lablab purpureus L. Sweet.). Mysore Journal of Agricultural Science,26: 15-20
Robinson, H.F., Comstock, R.E. and Harney, P.H. 1949. Estimates of heritability and degree in corn.
Agronomy J.,41: 353-359
Robson, D.S. 1956. Application of K4 statistics to genetic variance component analysis.
Biometrics,12: 433-444.
Thangavelu, O. 1979. Breeding behaviour of the intervarietal hybrids of Indian bean (Lablab purpureus L. Sweet): an evaluation of F2 and
F3 populations. M.Sc. (Agri.) Thesis, TNAU,
Coimbatore (India).
Wright, S. 1923. Theory of path coefficients. Genetics,
ISSN 0975-928X
Table 1. Estimates of genetic parameters for yield and its attributing traits in F2 generation
Traits Cross Min Max Mean PCV
(%)
GCV
(%) h
2
(%) GAM
PL HA4 x CPI31113 1.2 6.0 3.9 13.9 13.3 91.7 26.3
HA4 x CPI60216 2.5 6.0 4.0 15.9 15.4 94.5 38.9
PW HA4 x CPI31113 1.0 1.6 1.2 12.2 11.7 92.5 23.2
HA4 x CPI60216 0.5 1.9 1.2 19.5 18.9 93.9 47.5
FFI HA4 x CPI31113 51.0 123.0 83.3 24.6 24.6 99.9 50.7
HA4 x CPI60216 50.0 110.0 75.1 21.3 21.3 99.9 55.4
100SW HA4 x CPI31113 6.9 16.8 11.5 16.5 16.5 99.1 33.8
HA4 x CPI60216 6.2 17.2 11.3 17.4 17.3 99.4 45.0
SW/P HA4 x CPI31113 1.6 376.0 84.0 90.2 90.2 100.0 185.8
HA4 x CPI60216 3.7 377.0 79.9 83.7 83.7 100.0 217.5
NSP HA4 x CPI31113 1.8 5.0 3.4 20.6 19.1 86.5 36.7
HA4 x CPI60216 2.4 5.6 3.6 17.1 16.2 89.7 39.9
PL = Pod length (cm); PW = Pod Width (cm); FFI = First Flower initiation (days); 100SW = 100 seed weight (g); NSP = No. of seeds/pods; SW/P = total seed weight per plant
(g/plant)
Table 2. Correlation coefficient for yield and its attributing traits in F2 generation (above diagonal - cross HA4 x CPI31113 and below diagonal - cross
HA4 x CPI60216)
Characters PL PW FFI NSP 100SW SW/P
PL 0.20* -0.06 0.16 0.15 0.15
PW 0.44** 0.16 0.09 0.19* 0.08
FFI 0.01 -0.01 -0.03 0.02 -0.05
NSP 0.23* -0.07 -0.14 -0.23* 0.16
100SW 0.06 0.1 -0.01 -0.01 0.38**
ISSN 0975-928X
Table 3. Estimates of direct and indirect effects of yield contributing characters on seed yield in F2 generation
Traits Cross PL PW FFI NSP 100SW r
PL HA4 x CPI31113 0.05 0.00 0.00 0.04 0.07 0.15
HA4 x CPI60216 -0.04 -0.09 0.00 0.05 0.01 -0.07
PW HA4 x CPI31113 0.01 -0.02 -0.01 0.02 0.08 0.08
HA4 x CPI60216 -0.02 -0.21 0.00 -0.02 0.02 -0.23
FFI HA4 x CPI31113 0.00 0.00 -0.05 -0.01 0.01 -0.05
HA4 x CPI60216 0.00 0.00 0.13 -0.03 0.00 0.10
NSP HA4 x CPI31113 0.01 0.00 0.00 0.26 -0.10 0.16
HA4 x CPI60216 -0.01 0.02 -0.02 0.23 0.00 0.22
100 SW HA4 x CPI31113 0.01 0.00 0.00 -0.06 0.43 0.38
HA4 x CPI60216 0.00 -0.02 0.00 0.00 0.20 0.17
Table 4. Skewness and kurtosis for yield and its component traits in F2 generation of two dolichos crosses
HA4 x CPI60216 HA4 x CPI31113
Skewness Kurtosis Skewness Kurtosis
PL 0.45 0.82 -0.58 4.87
PW 0.02 -0.01 5.10 42.06
FFI 0.45 -0.70 0.05 -1.45
NSP 0.49 -0.09 0.15 -0.42
100SW -0.37 2.01 0.05 -0.05