ISSN 0975-928X
Research Article
Genetic Diversity, Character association and Path-Coefficient study in
QPM inbreds
T.K. Mishra*, B. Pradhanand D. Mishra Department of Plant Breeding and Genetics,
Orissa University of Agriculture & Technology, Bhubaneswar - 751003, India E-mail:[email protected]
(Received:24 Jan 2015; Accepted:21 Aug 2016)
Abstract
The thirty seven inbreds of quality protein maize of diverse origin, evaluated in RBD showed significant difference among the inbreds in respect of grain yield and its component traits. The characters like days to 50 % tasseling, days to 50 % silking and days to 75% dry husk were less influenced by the environmental factors because of lower differences in magnitudes between GCV and PCV. On the contrary, the characters like cob girth, number of kernels per row, number of kernel rows per cob and grain yield per plant were much influenced by the environmental factors as evidenced from higher differences in magnitude of PCV and GCV. High heritability with low genetic advances for characters like days to 50% tasseling, days to 50 % silking and days to 75 % dry husk indicated the predominance of non-additive gene action whereas high heritability with high genetic advance was reported for cob weight indicating the role of additive gene action. The characters viz., cob weight, 100- kernel weight, plant height, ear height, and no. of kernels per row were highly and positively correlated with grain yield per plant at genotypic and phenotypic levels. Ear height (0.837), days to 50 % silking (0.526) and number of kernels/rows per cob (0.455) in that order had large positive direct effect on grain yield per plant at genotypic level. Similar trend was also observed at phenotypic level. The indirect effects were generally small with only a few exceptions. A close examination of all the direct and indirect effects of the components traits on yield indicated the presence of enough scope for yield improvement through selection for no of leaves per plant, cob length, no. of kernels per row, cob weight and 100-kernel weight. Based on 14 quantitative characters, the 37 quality protein maize inbreds were grouped into13 clusters following D2analysis and Tocher™s method of grouping. Among the yield traits, days to 50 % silking, days to 50% tasseling, days to 75% dry husk, cob weight, 100 kernel weight and grain yield per plant were found to be the major contributor towards genetic divergence. The overall clustering pattern indicated that QPM 3-7, QPM 9-18, and QPM 1110-7-2 were much divergent from rest of the inbreds in the experiment. Similarly, the inbreds of cluster III and XI and inbreds of clusters IX, III and X were distantly and distinctly related to each other. The pattern of clustering as stated above further indicated that there was no strict association between inbreds developed from diverse base populations.
Key words
QPM inbred, Genetic diversity, Character association, Path-Coefficient analysis.
Introduction
Maize is one of the staple food crops and ranks third next to wheat and paddy in production in India. Maize is a highly cross pollinated crop and this phenomenon has been successfully exploited and several hybrids and composite had been developed. However most of the hybrids/composites developed was low in protein content. Breeding methods to improve yield along with increased protein levels may develop quality protein in maize. The invention of heterosis phenomenon, the development of hybrid breeding technology and successful commercial exploitation of heterosis in maize have led to development of a number of genotypes e.g. single crosses, double crosses, varietal hybrids, multiple hybrids, composites, synthetics in different categories of maize including quality protein maize. And the success of hybrid development in maize involving the selected inbred lines depends of the extent of recombination, the extent to which a character is heritable and the genetic control of the characters. Information on genetic parameters of yield and component traits, genetic diversity among the inbred lines and character association
among the component traits would help the breeders in selection of desirable inbreds. The present investigation was primarily focussed on studying the genetic divergence in multivariate traits in a selected set of QPM inbreds and to evaluate the association among the yield component traits and yield.
Materials and Methods
Thirty seven quality protein maize inbreds of diverse geographic and genetic origin were obtained from Winter Maize Nursery, Hyderabad. These inbreds were grown in AICRP on Maize, Department of Plant Breeding and Genetics, OUAT, Bhubaneswar during Rabi, 2013 in RBD with three replications. Each inbred lines was represented by 2 lines of 4 meter row length with 60 cm spacing between line to line and 30 cm spacing between plant to plant. Fertilizers were applied @ 20 kg N, 40 kg P2O5, 40 kg K2O
per Farm Yard Manure per hectare and recommended package of practices were followed as per the scheduled programme for maize crop. Observations on days to 50 % tasseling, 50 % silking and days to 75 % dry husk were recorded on plot basis and rest eleven quantitative traits
ISSN 0975-928X
were recorded on the basis of five randomly chosen plants at appropriate stage. Genetic parameters like PCV, GCV, h², GA of the traits were estimated. Genetic divergence among inbreds was estimated as multivariate measure of D² (Al-Jibouri et al., 1958). The associations among the traits were estimated in terms of rp and
rg (Dewey and Lu, 1959) and the rp estimates of
component traits with yield were partitioned into direct and indirect effects by path-coefficient analysis (Rao, 1952).
Results and Discussion
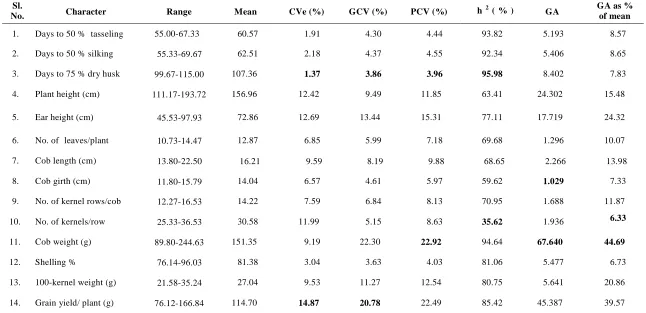
Genetic parameters of Traits: The inbreds showed wide differences in the traits and analysis of variance revealed significant differences among the inbreds for all the characters studied. The phenotypic coefficients of variations (PCV) ranged from 3.96 % for days to 75 % dry husk to 22.92 % for cob weight (Table 1).
The PCV estimates showed that the phenotypic variability was low (< 10 %) for days to 50% tasseling, days to 50 % silking, days to 75 % dry husk, number of leaves/plant, cob length, cob girth, number of kernel rows/cob, number kernels/row and shelling %, moderate (10 to 20 %) for plant height, ear height and 100- kernel weight and high (> 20 %) for cob weight and grain yield per plant. The genotypic coefficient of variation (GCV) ranged between 3.86 %for days to 75 % dry husk to 20.78 % for grain yield/plant and followed almost a similar trend as phenotypic coefficient of variation except for the character plant height which fell under low (below 10 %) for GCV. The heritability ( h bs) estimates w e r e h i g h (>90%) for 50 % tasseling, days to 50 % silking, days to 75 % dry husk and cob weight, moderate (75 - 90%) for shelling %, 100-kernel eight and grain yield/plant a n d low (<75%) for characters like plant height, ear height, number of leaves/plant, cob length, cob girth, number of kernel rows/cob and number of kernels/cob. High heritability coupled with high genetic advance (expressed as per cent of mean) was observed for cob weight, which indicated that this character controlled by additive gene action and phenotypic selection for this character would be effective (Ojha et al., 2006 and Bharathiveeramani et al., 2012). High heritability with low genetic advance were found in case of days to 50 % silking, days to 50 % tasseling and days to 75 % dry husk that suggested predominant gene action in their inheritance reported earlier (Bharathiveeramani et al., 2012).
Genetic Divergence: Multivariate measure of genetic divergence (D²) among the inbreds based on all the characters was estimated. D² among 37 quality protein maize inbreds ranged from
5.297(QPM5-2 and QPM10-1) to 23.501 (QPM 2-4 and QPM 3-7) indicating that some genotypes were close to each other genetically while the rest were strongly diverse in nature. Using Tocher™s method of clustering, 37 quality protein maize inbreds were grouped on the basis of genetic affinity or diversity measured by D2 values which resulted into thirteen groups or clusters consisting 1 to 10 inbreds and the cluster composition was as follows:
Cluster I QPM 5-2, QPM 10-1, QPM 1-3, QPM 1131-8-1, QPM 8-15, QPM 7-4, QPM 10-13, QPM 8-2, QPM 9-2, QPM 9-4 Cluster II QPM 9-16 , QPM 3-5 , QPM 8-12 Cluster III HK 1-164-7, QPM 2-4
Cluster IV QPM 2-7 , QPM 1130-7-1, QPM 2-18, QPM 8-11
Cluster V QPM 9-10, QPM 1-6, QPM 11-7 QPM 7-14
Cluster VI QPM 8-7 , QPM 6-4 , QPM 8-1 Cluster VII HK 1-191-1, HK 1-164-4 Cluster VIII QPM 1-7 , QPM 2-1 Cluster IX HK 1-193-2, HK 1-193-1 Cluster X QPM 8-3 , QPM 8-5 Cluster XI QPM 3-7
Cluster XII QPM 9-18 Cluster XIII QPM 1110-7-2
In the present study classification of 37 quality protein maize inbreds developed at two centres led to the formation of 13 clusters with varying number of inbreds in each cluster. The genotypes falling in the same cluster are more closely related and possess narrow genetic diversity. The result of the present investigation is in good agreement with the previous findings (Hepziba et al. (2013); Chen et al. (2007), Singh et al. (2009) and Shrestha, 2013).The clustering pattern revealed that the tendency of inbreds developed from diverse populations might be due to similarity in requirement and selection approaches followed under domestic cultivation. The estimates of average intra- and inter-cluster distances (D2 values) indicated that the highest intra-cluster distance was reported in case of cluster X, revealing the maximum genetic diversity among two inbreds (QPM8-3and QPM8-5), closely followed by Cluster IX which indicated lower magnitude of genetic diversity among different constituent inbreds i.e. HK 193-2 and HK 1-193-1 (Table 2). The least intra-cluster distance was reported in case of cluster III comprising of two different inbreds i.e. HK 1-164-7 and QPM 2-4. The spectrum of inter-cluster distance ranged between 37.567(Cluster I and Cluster II) and 310.176 (Cluster III and Cluster XI).The higher inter-cluster distance (average D2 value) was between cluster III and cluster XI followed in order by between cluster III and cluster X (277.815) and between cluster VIII and c l us t e r XI (263.994). This indicated that the
ISSN 0975-928X
inbred of clusters III and XI and inbreds of clusters III, VIII and X are distantly and distinctly related to each other. On the other hand, the minimum inter-cluster average D2 value observed between cluster I and II (37.587) indicated less divergence between the inbreds of respective clusters. Among the thirteen clusters identified, cluster I which included 10 inbreds was not superior with respect to any of the characters studied (Table 3). However, the mean recorded with respect to shelling % (81.596 %) was more than the respective general mean of 81.375 %. The cluster II, containing three different inbreds was not superior with respect to any of the characters studied. Cluster III comprised of two inbreds was characterized by longer maturity duration i.e. days to 75 % dry husk, higher plant and ear height, possessing more number of leaves/plant and larger cob girth. The cluster VII with two genotypes (HK 191 and HK 1-164-4) were identified as late flowering while cluster XI with a single genotype (QPM 3-7) was the best for early maturity.In view of the above discussion, it may be concluded that the inbreds from cluster VIII i.e., QPM 1-7 and QPM 2-1 should be selected for developing high yielding hybrid while QPM 3-7 should be selected for early maturity in maize. Among the thirteen clusters identified, cluster I which included 10 inbreds was not superior with respect to any of the characters studied. However, the mean recorded with respect to shelling % (81.596 %) was more than the respective general mean of 81.375 %. The cluster II, containing three different inbreds was not superior with respect to any of the characters studied. Cluster III comprised of two inbreds was characterized by longer maturity duration i.e. days to 75 % dry husk, higher plant and ear height, possessing more number of leaves/plant and larger cob girth. The cluster VII with two genotypes (HK 191 and HK 1-164-4) were identified as late flowering while cluster XI with a single genotype (QPM 3-7) was the best for early maturity. In view of the above discussion, it may be concluded that the inbreds from cluster VIII i.e., QPM 1-7 and QPM 2-1 should be selected for maturity in maize.
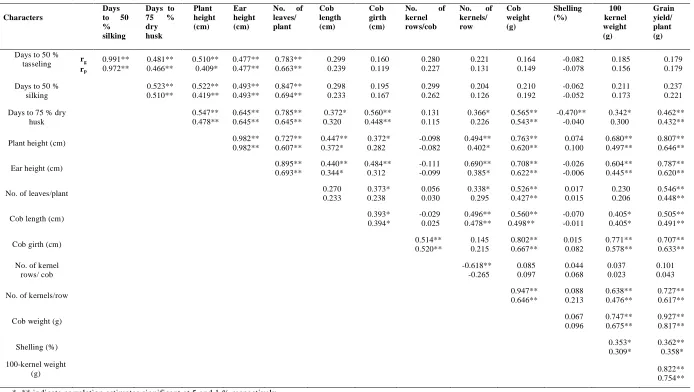
Character Association: The Phenotypic (rp) and genotypic (rg) correlation estimates among the traits followed almost similar trend, though rg estimates in most cases little higher (Table 4 ). In case of genotypic level with a deviation in case of shelling %. A close corresponds between genotypic and phenotypic correlations indicate lesser masking effect of environment of character expression. In general genotypic correlation coefficients were higher than
corresponding phenotypic one for most of the character combinations and this was the most agreement with earlier findings (Singh et al. (2009), Shrestha (2013), Khorasani et al. (2011), Ravi et al. (2012) and Kumar and Satyanarayana (2001). It appeared from the overall picture of associations between yield and other traits that the group of inbreds evaluated present a wide array of character combinations. This means, there is substantial diversity in the material offering ample scope for improvement of yield by manipulative breeding. And in doing so, selection for cob weight, 100- kernel weight, plant height and ear height perhaps, receive much greater attention than other characters. At phenotypic level, similar trend was also noticed irrespective of direct and indirect effects of component traits on grain yield per plant. The analysis had high R2 (89.529) value and residual effect of 0.324. Cob weight (0.575), shelling % (0.236), 100-kernel weight (0.163), number of leaves per plant (0.143) and ear height (0.107) in that order, had positive direct effects on grain yield per plant. The direct effects of days to 50% silking (0.096), plant height (0.021), cob length (0.097), cob girth (0.085) and number of kernel rows per cob (0.006) were of smaller magnitude but positive while direct effects of remaining three characters i.e. days to 50% tasselling (-0.121), days to 75 per cent dry husk (-0.145) and number of kernels per row (-0.001) were negative.
The indirect effects were mostly small with only a few exceptions. For example cob weight had negative indirect effect via days to 50 per cent tasseling, (-0.018), days to 75 per cent dry husk (0.079) and number of kernels per row (-0.001) on grain yield. Days to 50% tasseling and days to 50 % silking, both had negative indirect effects on grain yield via days to 75 % dry husk and shelling%. Plant height and ear height had positive indirect correlations via all the characters except via two traits viz., days to 50 per cent tasseling and days to 75 % dry husk. Similarly cob length, number of leaves per plant, cob girth followed the same results like plant height and ear height. It is revealed from the study that days to 50% tasseling and days to 75% dry husk had negative indirect effect through most of yield attributing characters. The trait, number of kernels per row and number of kernel rows per cob had very small indirect effects via most of the yield contributing traits at the phenotypic level. Similar results were also reported earlier by Singh et al. (2009), Ravi et al. (2012) and Kumar and Satyanarayana (2001).
ISSN 0975-928X
path coefficient analysis (Table 5). The analysis had high R2 (89.529) value and residual effect of 0.324. Cob weight (0.575), shelling % (0.236), 100-kernel weight (0.163), number of leaves per plant (0.143) and ear height (0.107) in that order, had positive direct effects on grain yield per plant. The direct effects of days to 50% silking (0.096), plant height (0.021), cob length (0.097), cob girth (0.085) and number of kernel rows per cob (0.006) were of smaller magnitude but positive while direct effects of remaining three characters i.e. days to 50% tasseling (-0.121), days to 75 per cent dry husk (-0.145) and number of kernels per row (-0.001) were negative. The indirect effects were mostly small with only a few exceptions. For example cob weight had negative indirect effect via days to 50 per cent tasseling, (-0.018), days to 75 per cent dry husk (0.079) and number of kernels per row (-0.001) on grain yield. Days to 50% tasseling and days to 50 % silking, both had negative indirect effects on grain yield via days to 75 % dry husk and shelling%. Plant height and ear height had positive indirect correlations via all the characters except via two traits viz., days to 50 per cent tasseling and days to 75 % dry husk. Similarly cob length, number of leaves per plant, cob girth followed the same results like plant height and ear height. It is revealed from the study that days to 50% tasseling and days to 75% dry husk had negative indirect effect through most of yield attributing characters. The trait, number of kernels per row and number of kernel rows per cob had very small indirect effects via most of the yield contributing traits at the phenotypic level. Results were also i n a g r e e m e n t w i t h t h e r e p o r t s o f Singh et al. (2009), Ravi et al. (2012) and Kumar and Satyanarayana (2001). Days to 50% tasseling and days to 50 % silking, both had negative indirect effects on grain yield via days to 75% dry husk and shelling%. Plant height and ear height had positive indirect correlations via all the characters except via two traits viz., days to 50 per cent tasseling and days to 75 % dry husk. Similarly cob length, number of leaves per plant, cob girth followed the same results like plant height and ear height.
References
Al-Jibouri, H.A., Miller, P.A. and Robinson, H.F. 1958. Genotypes and environmental variances and co-variances in a upland cotton cross of inter specific origin. Agron.J., 50: 633-636. Bharathibveeramani, B., Prakash, M. and Sestharam, A.
2012. Variability studies of quantitative characters in Maize (Zeamays L.). Electronic
JournalofPlantBreeding, 3(4): 995-997.
Chen, F., Yang KeCheng, Rong Ting Zhao and Pan Guang Tang. 2007. Analysis of genetic diversity of maize hybrids in the regional tests of Sichuan and Southwest China. Acta
AgronomicaSinica, 33(6): 991-998.
Dewey, D.R. and Lu, K.H. 1959. A correlation and path coefficient analysis of components of crested wheat grass seed production. Agron. J.,
51:515-518.
Hepziba, S.J., Keetha, K. and Ibrahim, S.M. 2013. Evaluation of genetic diversity, variability, character association and path analysis in diverse inbreds of maize (ZeamaysL.).
Electronic Journal of Plant Breeding 4(1):
1067-1072.
Khorasani, K., Mostafavikh, S., Zondipour, E. and Heidarian, A. 2011. Multivariate analysis of agronomic traits of new corn hybrids (Zea
mays L.) International J. of Agri Sci., 1(6):
314-322.
Kumar, P. and Satyanarayana, E. 2001. Variable and correlation studies of full season inbred lines of maize. JournalofResearch, ANGARU, 29: 71- 75.
Ojha, D.K., Omikunle, O.A., Oduwaye, Ajala, M.O. and Ogunbayo, S.A. 2006. Heritability, character correlation and path coefficient analysis among six inbred-lines of Maize. (Zeamays L.) World
Journal of Agricultural Sciences, 2(3):
352-358.
Rao, C.R. 1952. Advanced statistical methods in biometrical research.1st Edn. John Wiley and Som, New York.
Ravi, V., Murali; Chikkalingaiah and Shailaja Hittalmani. 2012. Correlation study for protein content, Grain yield and yield contributing traits in Quality Protein Maize (QPM) (Zea Mays L.). Electronic Journal of Plant
Breeding, 2(1): 649-651.
Shrestha, J. 2013. Agro-morphological characterization of maize inbred lines. WeedpeckerJournalof Agri.Res. 2 (7): 209-211.
ISSN 0975-928X
Table 1. Genetic parameters of different characters of quality protein maize inbreds
Sl.
No. Character Range Mean CVe (%) GCV (%) PCV (%) h
2
( % )
(%)
GA GA as % of mean
1. Days to 50 % tasseling 55.00-67.33 60.57 1.91 4.30 4.44 93.82 5.193 8.57
2. Days to 50 % silking 55.33-69.67 62.51 2.18 4.37 4.55 92.34 5.406 8.65
3. Days to 75 % dry husk 99.67-115.00 107.36 1.37 3.86 3.96 95.98 8.402 7.83
4. Plant height (cm) 111.17-193.72 156.96 12.42 9.49 11.85 63.41 24.302 15.48
5. Ear height (cm) 45.53-97.93 72.86 12.69 13.44 15.31 77.11 17.719 24.32
6. No. of leaves/plant 10.73-14.47 12.87 6.85 5.99 7.18 69.68 1.296 10.07
7. Cob length (cm) 13.80-22.50 16.21 9.59 8.19 9.88 68.65 2.266 13.98
8. Cob girth (cm) 11.80-15.79 14.04 6.57 4.61 5.97 59.62 1.029 7.33
9. No. of kernel rows/cob 12.27-16.53 14.22 7.59 6.84 8.13 70.95 1.688 11.87
10. No. of kernels/row 25.33-36.53 30.58 11.99 5.15 8.63 35.62 1.936 6.33
11. Cob weight (g) 89.80-244.63 151.35 9.19 22.30 22.92 94.64 67.640 44.69
12. Shelling % 76.14-96.03 81.38 3.04 3.63 4.03 81.06 5.477 6.73
13. 100-kernel weight (g) 21.58-35.24 27.04 9.53 11.27 12.54 80.75 5.641 20.86
14. Grain yield/ plant (g) 76.12-166.84 114.70 14.87 20.78 22.49 85.42 45.387 39.57
ISSN 0975-928X
Table2. Averageintra-cluster(diagonal)andinter-clusterdistance(D2values)among13clustersof37qualityproteinmaizeinbreds
Clusters I(10) II(3) III(2) IV(4) V(4) VI(3) VII(2) VIII(2) IX(2) X(2) XI(1) XII(1) XIII(1)
I 21.084 37.587 146.136 39.322 80.235 39.411 86.715 116.072 48.830 49.959 60.282 78.784 85.148
II 25.109 112.539 44.977 47.639 69.600 59.696 108.212 45.346 77.075 104.699 50.877 75.318
III 14.019 76.009 85.428 155.982 53.893 39.142 152.823 277.815 310.176 140.291 95.726
IV 16.815 67.867 48.809 60.331 86.864 63.522 107.541 117.455 103.952 58.126
V 27.709 82.046 68.442 112.974 94.151 151.613 174.268 47.739 84.344
VI 24.801 131.962 130.509 99.451 83.668 58.512 85.567 105.399
VII 30.262 78.857 63.000 162.100 216.136 107.320 77.510
VIII 33.621 142.142 241.226 263.994 152.268 108.896
IX 34.589 68.251 122.146 99.587 111.023
X 35.989 42.035 120.261 151.416
XI 0.000 141.588 176.176
XII 0.000 141.816
XIII
.0.000
ISSN 0975-928X
Table3. Cluster(D2based)meansin37qualityproteinmaizeinbredsfor14characters
Sl.
No. Characters I(10) II(3) III(2) IV(4) V(4) VI(3) VII(2) VIII(2) IX(2) X(2) XI(1) XII(1) XIII(1)
Grand mean
1. Days to 50 % tasseling 59.800 62.222 62.667 60.083 60.417 55.444 65.833 61.500 65.167 60.833 55.333 60.333 60.333 60.567
2. Days to 50 %
silking 62.067 63.889 64.667 61.583 62.667 57.444 68.000 63.500 67.333 61.500 56.333 62.333 62.667 62.513
3. Days to 75 %
dry husk 104.300 109.000 114.833 107.167 113.083 104.667 111.833 109.500 106.333 100.833 99.667 111.333 109.667 107.360
4. Plant height
(cm) 152.033 158.411 186.066 175.508 153.108 142.800 166.467 170.917 165.767 128.934 137.467 122.533 168.833 156.961
5. Ear height
(cm) 67.993 72.511 95.367 81.608 74.475 67.344 83.633 80.867 75.800 54.183 61.700 54.733 75.700 72.856
6. No. of
leaves/plant 12.280 12.533 13.800 12.550 13.267 11.333 13.600 13.533 13.366 11.433 10.933 11.933 13.133 12.571
7. Cob length (cm) 15.725 18.378 17.284 16.617 15.750 14.427 16.840 18.393 14.934 14.800 17.000 16.227 16.033 16.211
8. Cob girth (cm) 13.651 13.736 15.420 14.158 13.832 14.340 14.524 15.180 14.030 13.050 13.600 14.840 14.067 14.044
9. No. of kernel
rows/cob 14.153 13.689 15.933 13.234 13.450 14.133 15.534 13.934 14.333 14.800 14.933 16.000 14.267 14.216
10. No. of
kernels/row 30.520 31.933 32.400 31.350 30.617 28.000 28.200 35.838 27.400 30.034 25.333 29.533 33.000 30.580
11. Cob weight (g) 141.013 141.711 219.867 169.383 142.566 144.578 157.000 234.550 116.933 98.867 101.067 150.133 177.333 151.345
12. Shelling % 81.596 81.418 81.193 81.973 80.030 79.931 80.963 80.053 79.398 82.974 81.150 76.520 96.033 81.375
13. 100-kernel weight (g) 25.498 26.390 30.413 31.780 25.624 26.129 26.130 33.223 27.188 24.690 23.647 21.583 29.967 27.042
14. Grain yield/
plant (g) 108.587 109.132 159.107 132.936 103.068 105.240 134.775 165.493 91.182 84.863 84.570 76.120 139.257 114.697 Figures in parentheses indicate number of inbreds in the respective clusters
ISSN 0975-928X
Table 4. Phenotypic (rp) and genotypic (rg) correlations among yield component trait in quality protein maize inbreds.
Characters Days to 50 % silking Days to 75 % dry husk Plant height (cm) Ear height (cm) No. of leaves/ plant Cob length (cm) Cob girth (cm) No. of kernel rows/cob
No. of kernels/ row Cob weight (g) Shelling (%) 100 kernel weight (g) Grain yield/ plant (g)
Days to 50 % tasseling rg
rp 0.991** 0.972** 0.481** 0.466** 0.510** 0.409* 0.477** 0.477** 0.783** 0.663** 0.299 0.239 0.160 0.119 0.280 0.227 0.221 0.131 0.164 0.149 -0.082 -0.078 0.185 0.156 0.179 0.179
Days to 50 % silking 0.523** 0.510** 0.522** 0.419** 0.493** 0.493** 0.847** 0.694** 0.298 0.233 0.195 0.167 0.299 0.262 0.204 0.126 0.210 0.192 -0.062 -0.052 0.211 0.173 0.237 0.221
Days to 75 % dry husk 0.547** 0.478** 0.645** 0.645** 0.785** 0.645** 0.372* 0.320 0.560** 0.448** 0.131 0.115 0.366* 0.226 0.565** 0.543** -0.470** -0.040 0.342* 0.300 0.462** 0.432**
Plant height (cm) 0.982**
0.982** 0.727** 0.607** 0.447** 0.372* 0.372* 0.282 -0.098 -0.082 0.494** 0.402* 0.763** 0.620** 0.074 0.100 0.680** 0.497** 0.807** 0.646**
Ear height (cm) 0.895**
0.693** 0.440** 0.344* 0.484** 0.312 -0.111 -0.099 0.690** 0.385* 0.708** 0.622** -0.026 -0.006 0.604** 0.445** 0.787** 0.620**
No. of leaves/plant 0.270
0.233 0.373* 0.238 0.056 0.030 0.338* 0.295 0.526** 0.427** 0.017 0.015 0.230 0.206 0.546** 0.448**
Cob length (cm) 0.393*
0.394* -0.029 0.025 0.496** 0.478** 0.560** 0.498** -0.070 -0.011 0.405* 0.405* 0.505** 0.491**
Cob girth (cm) 0.514** 0.520** 0.145 0.215 0.802** 0.667** 0.015 0.082 0.771** 0.578** 0.707** 0.633**
No. of kernel rows/ cob -0.618** -0.265 0.085 0.097 0.044 0.068 0.037 0.023 0.101 0.043
No. of kernels/row 0.947**
0.646** 0.088 0.213 0.638** 0.476** 0.727** 0.617**
Cob weight (g) 0.067
0.096
0.747** 0.675**
0.927** 0.817**
Shelling (%) 0.353*
0.309*
0.362** 0.358* 100-kernel weight
(g) 0.822**
0.754**
ISSN 0975-928X
Table 5. Direct and indirect effects of component traits on grain yield in quality protein maize inbreds
Effectofcharacters
Effectvia
Correlation withgrain
yieldper plant(g) Daysto50
%tasseling
Days to 50 % silking
Daysto 75%
dry husk
Plant height (cm)
Ear height
(cm)
No.of leaves/ plant
Cob length
(cm)
Cob girth (cm)
No.of kernel rows/cob
No.of kernels/
row
Cob weight
(g)
Shelling (%)
100-kernel weight (g)
Days to 50 % tasseling -0.121 0.093 -0.068 0.009 0.044 0.095 0.023 0.010 0.001 0.001 0.086 -0.018 0.025 0.179
Days to 50 % silking -0.118 0.096 -0.074 0.009 0.044 0.099 0.023 0.014 0.001 0.001 0.110 -0.012 0.028 0.221
Days to 75 % dry husk -0.056 0.049 -0.145 0.010 0.061 0.092 0.031 0.038 0.001 0.001 0.312 -0.009 0.049 0.432
Plant height (cm) -0.049 0.040 -0.069 0.021 0.096 0.087 0.036 0.024 0.001 0.001 0.357 0.024 0.081 0.646
Ear height (cm) -0.050 0.040 -0.083 0.019 0.107 0.099 0.033 0.026 -0.001 0.001 0.358 -0.001 0.073 0.620
No. of leaves/plant -0.080 0.066 -0.093 0.013 0.074 0.143 0.023 0.020 0.001 0.001 0.246 0.004 0.034 0.448
Cob length (cm) -0.029 0.022 -0.046 0.008 0.037 0.003 0.097 0.033 0.001 0.001 0.086 -0.003 0.066 0.491
Cob girth (cm) -0.041 0.016 -0.065 0.006 0.033 0.034 0.038 0.085 0.003 0.001 0.384 0.019 0.094 0.633
No. of kernel rows/cob -0.027 0.025 -0.017 -0.002 -0.011 0.004 0.002 0.044 0.006 0.001 0.056 0.016 0.004 0043
No. of kernels/row -0.016 0.012 -0.033 0.008 0.041 0.042 0.046 0.018 -0.002 -0.001 0.372 0.050 0.078 0.617
Cob weight (g) -0.018 0.018 -0.079 0.013 0.066 0.061 0.048 0.056 0.001 -0.001 0.575 0.023 0.110 0.875
Shelling (%) 0.009 -0.005 0.006 0.002 -0.001 0.002 -0.001 0.007 0.001 0.001 0.055 0.236 0.650 0.358
100-kernel weight (g) -0.019 0.017 -0.043 0.010 0.047 0.029 0.039 0.049 0.001 0.001 0.388 0.073 0.163 0.754