Handwriting: Feature Correlation Analysis
for Biometric Hashes
Claus Vielhauer
Multimedia Communications Lab (KOM), Darmstadt University of Technology, 64283 Darmstadt, Germany
Platanista GmbH, 06846 Dessau, Germany
Faculty of Computer Science, Otto-von-Guericke University, 39106 Magdeburg, Germany Email:[email protected]
Ralf Steinmetz
Multimedia Communications Lab (KOM), Darmstadt University of Technology, 64283 Darmstadt, Germany Email:[email protected]
Received 17 November 2002; Revised 9 September 2003
In the application domain of electronic commerce, biometric authentication can provide one possible solution for the key man-agement problem. Besides server-based approaches, methods of deriving digital keys directly from biometric measures appear to be advantageous. In this paper, we analyze one of our recently published specific algorithms of this category based on behavioral biometrics of handwriting, the biometric hash. Our interest is to investigate to which degree each of the underlying feature param-eters contributes to the overall intrapersonal stability and interpersonal value space. We will briefly discuss related work in feature evaluation and introduce a new methodology based on three components: the intrapersonal scatter (deviation), the interpersonal entropy, and the correlation between both measures. Evaluation of the technique is presented based on two data sets of different size. The method presented will allow determination of effects of parameterization of the biometric system, estimation of value space boundaries, and comparison with other feature selection approaches.
Keywords and phrases:biometrics, signature verification, feature evaluation, feature correlation, cryptographic key management, handwriting, information entropy.
1. MOTIVATION
Today, a wide spectrum of technologies for user identifica-tion and verificaidentifica-tion exists and a great number of the systems that have been published are based on long-term research. The basic concept behind all biometric systems is the idea to make use of machine-measurable traits to distinguish per-sons. In order to be adequate for this process, a number of requirements must be fulfilled by a human trait feature, see [1]. For our working context, the following four are of main interest:
(i) uniqueness: the feature must vary to a reasonable ex-tent amongst a wide set of individuals (intervariabil-ity);
(ii) constancy (permanence): the feature must vary as little as possible for each individual (intravariability); (iii) distribution (universality): the feature must be
avail-able for as many potential users as possible;
(iv) measurability (collectability): the feature must be elec-tronically measurable.
Biometric characteristics, which fulfill the above require-ments, can be classified in a number of ways, for example, see [2,3]. One common approach is to divide into measures, which are either originating from a physiological or a behav-ioral trait of subjects, although it has been shown that every process of capturing biometric measures includes behavioral components to some extent [2]. In the context of our work based on handwriting, we use the terminology of passive and active biometric schemes to clearly point out the aspects of the user awareness and cooperation.
analysis of handwriting are based on visible physiological characteristics, which are retrieved in a time-invariant man-ner. These biometric features can be obtained from users without their explicit cooperation, thus allowing identifica-tion of persons without their agreement or even knowledge. A straightforward paradigm for such an enforced verification is the forensic identification using fingerprints. For potential applications, this basic difference between active and passive biometric schemes has a significant consequence, as each ap-plication will have different requirements with respect to the subject’s cooperation. While, for example, in access control applications, one can expect a high degree in user coopera-tion as the desire of physical or logical access can be antici-pated, this is not necessarily the case in forensic applications, for example, for proof of identity.
From the perspective of potential applications, online handwriting as an active biometric scheme appears to be par-ticularly interesting in domains that deal with combined doc-ument and user authentication, which today is handled by electronic signatures. Nowadays, legal and design aspects of electronic signature infrastructures are clearly defined, for example, in the European Directive for Electronic Signa-ture [4], and security aspects are handled by cryptographic techniques. However, there still are problems in the area of user authentication because electronic signatures make use of asymmetric cryptographic schemes, requiring man-agement of public and secret (private) keys. Today’s prac-tice of storing private keys of users of electronic signatures on chip cards protected by personal identification number (PIN) has a systematic weakness. The underlying access con-trol mechanism is based on possession and knowledge, both of which can be transferred to other individuals with or with-out the holder’s intension. Making use of biometrics for key management can fill this security gap. A straightforward ap-proach is to protect the private key by performing biomet-ric user verification prior to release from the secured envi-ronment, for example, a smart card [5]. This approach is based on a biometric verification with a binary result set (verified or not verified) as a decision to control access. A physically secure location is still required for the sensitive data.
In this paper, we will present a feature analysis strategy for examination of a biometric system based on online hand-writing analysis with a specific system response category, the biometric hash, which has recently been published [6]. The biometric hash is a mathematical fingerprint based on a set of preselected statistical features of the handwritten sample of an individual, which can directly be used for key gener-ation, avoiding the problem of secure storage. Our evalua-tion strategy for this system is based on three statistical mea-sures:
(a) intrapersonal stability reflecting the degree of scatter within each individual feature;
(b) interpersonal entropyof hash value components as a re-sult of the biometric hash algorithm. This value is an indicator for the potential information density of each feature component;
(c) featurestability and entropy correlationto analyze the dependency between measure (a) and (b) with respect the contribution of each feature parameter to the en-tire biometric hash.
These three measures are evaluated to analyze the given bio-metric hash algorithm at a specific operation point, where the contribution of our work is twofold. Firstly, we aim to conceptually prove the concept of biometric hash generation by analyzing the relevance of information carried by each in-dividual feature. Secondly, we present a new feature analy-sis based on correlation of deviation and entropy along with evaluation results for this method. While typically in feature selection problems, the aim is to reduce the complexity of a given problem by separating features that carry no or little in-formation, there is no requirement for dimension reduction for the evaluated algorithm due to its low complexity. Our aim is to find quantitative terms for the share of the resulting value space for each of the feature components, which can be used as a basis for an estimation of the achievable value space. We will present a strategy for systematic, quantitative analy-sis of feature relevance for generating a biometric hash value and briefly discuss a limited set of related work in the area of feature analysis and feature selection with respect to this spe-cific biometric application. Further, we will discuss the prob-lem of correlation and entropy of the feature space within the scope of biometric hashes for several semantic classes for handwriting. We will present results of evaluations of the bio-metric hash using the method presented, which are based on two different test databases. For the first database with lim-ited size, details will be presented and the discussion will be summarized into a feature significance classification. In or-der to validate the findings of the initial evaluation, the re-sults are reviewed based on rere-sults of a second, extended test containing writing samples from a large database consisting of several thousand signatures.
The paper is structured as follows. InSection 2, we will give an introduction to feature evaluation and a discussion of the selected work in this domain followed by a discussion on the distinction of handwriting in several domains like hand-writing recognition, forensic writer identification, or signa-ture verification inSection 3.Section 4will briefly describe the state of the art of biometric hash systems and introduce our system concept of biometric hashes based on handwrit-ing. InSection 5, we present an analysis scheme towards in-trapersonal deviation of feature values, including test results from our experiments. From the same test database, the in-formation entropy as a measure for the achievable hash value space on an interpersonal scope is introduced and the results are presented inSection 6. Based on the findings in Sections
2. INTRODUCTION AND RELATED WORK
The task of automated biometric user authentication re-quires the analysis and comparison of individually stored ref-erence measures against features from an actual test input. Storage of reference templates is a machine learning problem, which requires the determination of adequate feature sets for classification. Feature evaluation or selection describing the process of identifying the most relevant features for a classifi-cation task is a research area of broad appliclassifi-cation. Today, we find a great spectrum of activities and publications in this area. From this variety, we have selected those approaches that appear to show the most relevant basics and are most closely related to our work discussed in the paper.1
In an early work on feature evaluation techniques, which has been presented almost three decades ago, Kittler has dis-cussed methods of feature selection in two categories: mea-surement and transformed space [7]. It has been shown that methods of the second category are computationally simple, while theoretically, measurement-based approaches lead to superior selection results, but at the time of publi-cation, these methods were computationally too complex to be practically applied to real-world classification problems. In a more recent work, the hypothesis that feature selection for supervised classification tasks can be accomplished on the basis of correlation-based filter selection (CFS) has been explored [8]. Evaluation on twelve natural and six artificial database domains has shown that this selection method in-creases the classification accuracy of a reduced feature set in many cases and outperforms comparative feature selection algorithms. However, none of the domains in this test set is based on biometric measures related to natural handwriting data. Principal component analysis (PCA) is one of the com-mon approaches for the selection of features, but it has been observed that, for example, data sets having identical vari-ances in each direction are not well represented [9]. Chi and Yan presented an evaluation approach based on an adopted entropy feature measure which has been applied to a large set of handwritten images of numerals [10]. This work has shown good results in the detection of relevant features com-pared to other selection methods. With respect to the feature analysis for the biometric hash algorithm, it is required to analyze the trade-offbetween intrapersonal variability of fea-ture measures and the value space, which can be achieved by the resulting hash vectors over a large set of persons. There-fore, we have chosen to evaluate not only the entropy for each feature, but also the degree of intrapersonal variability of fea-ture values. Our evaluation strategy presented in this work is based on application-specific entropy which is determined from the response of the biometric hash function and in-trapersonal deviations of feature parameters as measures for scatter. An overview of the algorithm and the initial feature
1An exhaustive discussion of the huge number of approaches that have
been published in the subject is beyond the scope of this paper. Therefore the authors have decided to refer to a very limited number of references which appear to be of significant relevance for the purpose of evaluating the specific technique discussed in this paper.
set as presented in the original publication will be given in
Section 4.
3. DISTINCTION OF HANDWRITING
This simplifies attacks by a potential forger, especially on time-invariant features. Secondly, additional semantics can be used to register several different references for one user, allowing the design of challenge-response systems. Another aspect is the possibility to change the content of the reference sample, which is important in case a biometric feature gets compromised.
Handwriting verification systems typically operate in two different modes. In the verification mode, the system is fed with a pretended identity and a writing sample and the re-sponse is either a positive or negative match. Identification only requires a writing sample input and the system will ei-ther output the most likely identity or a mismatch. Besides these two typical modes, biometric hashes denote an addi-tional class of system responses. The following section will introduce this category of biometric systems.
4. BIOMETRIC HASHES
Information exchange over public networks like the Inter-net implies a wide number of security requirements. Many of these security demands can be satisfied by cryptographic techniques which generally are based on digital keys. Here, we find two constellations of keys: keys for symmetric sys-tems, where all participants of the secret communication share the same secret key, and public keys, which consist of pairs of a secret key (private) and a publicly available key. While systems of the first category are typically designed for efficient cipher systems, the second type is used mainly in digital signatures or protocols to securely exchange secret ses-sion keys. In either category, we have the requirement to pro-tect the keys from unauthorized access. As cryptographically strong keys are rather large, and it is certainly not feasible to let users memorize their personal keys. As a consequence of this, in real-world scenarios today, digital keys are typically stored on smart cards protected by a special kind of pass-word, the PIN. However, there are problems with PIN; for example, they may be lost, passed on to other persons acci-dentally or purposely, or they may be reverse-engineered by brute force attacks.
These difficulties in using passcode-based storage of cryptographic keys motivate the use of biometric authenti-cation for key management which is based on human traits rather than knowledge. Various methods to apply biometrics to solve key management problems have been presented in the past [17]:
(i) secure server systemswhich release the key upon suc-cessful verification of the biometric features of the owner;
(ii) embedding of the digital keywithin the biometric ref-erence data by a trusted algorithm, for example, bit-replacement;
(iii) combination of digital key and biometric image into a so-calledBioscryptTMin such a way that neither
infor-mation can be retrieved independently of the other; (iv) derivation of the digital key directly from a biometric
image or feature.
There are problems with all of these approaches. In the first scenario, a secured environment is required for the server and further, all communication channels need to be secured, which is not possible in all application scenarios. Embedding secret information in a publicly available data set like in the second suggestion will allow an attacker to retrieve secret in-formation for all users once the algorithm is known. The idea of linking both digital key and biometric feature into a BioscryptTM can result in a good protection of both data
sets, but it is rather demanding regarding the infrastructure required. Approaches of the fourth category face problems due to the fact that biometric features typically show a high degree of intrapersonal variability due to natural and phys-iological reasons. A key that is composed directly from the biometric feature values might not show stability over a large set of verifications. Secondly, if the derivation of the key is based on passive traits like the fingerprint, the key is lost for all times, once compromised.
To overcome the problems of the approaches of the last category, it is desirable to derive a robust key value directly from an active biometric trait, which includes an expression of intention by the user. A voice-based approach for such a system can be found in [18], where cryptographic keys are generated from spoken telephone number sequences. As for all biometric techniques based on voice, there is a security problem in reply attacks, which can easily be performed by audio recording. For key generation based on handwriting, we have presented a new biometric hash function in [6]. By making use of handwriting, an active, behavioral trait, and additional semantic classes like pass phrases and PINs, the system allows to change the biometric reference in case it would get compromised. Instead of providing a positive or a negative verification result, the biometric hash is a vector of ordinal values unique to one individual person within a set of registered users. Originally, the new concept of biometric hash has been presented where the hash vector was calcu-lated by statistical analysis of 24 online and offline features of a handwriting sample. Continuative research has lead to a system implementation based on 50 features, as presented in
Section 4.1. A brief description of the algorithm will be given in Sections4.2and4.3.
4.1. System overview
The initial prototype system is implemented on a Palm Vx handheld computer equipped with 8 MB RAM and a MC68EZ328 CPU at a clock rate of 20 MHz. The built-in digitizer has a resolution of 160×160 pixels at 16 gray scales and provides binary pen-up/pen-down pen pressure infor-mation. Although it is widely observed that writing features based on pressure can show a great significance for writer verification, we limit our system to one-bit pen-up/pen-down signals. This is due to the fact that our superior work context is aimed towards device-independence, and a wide number of digitizer devices do not support pressure signal resolutions above one bit.
Interval
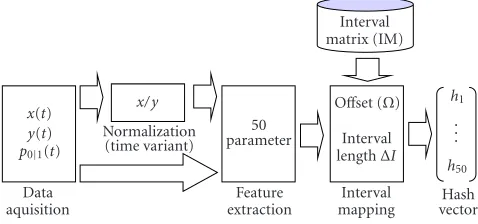
Figure1: Process of the biometric hash calculation.
signals x(t)/ y(t) and the binary pressure signal p0|1(t) are recorded from the input device. These signals are then made available for the feature extraction both in a normalized (x/ y normalization for determination of time variant fea-tures) and an unfiltered signal. After feature extraction of 50 statistical parameters, these are mapped to the biometric hash by the interval mapping process, making use of a user-specific interval matrix (IM). The IM is determined during enrollment, and the algorithm for this will be presented in
Section 4.3.
4.2. Feature parameters
The proceeding of obtaining a hash vector by interval map-ping requires the utilization of a fixed number of scalar fea-ture values, which are computed by statistical analysis of the sampled physical signals. A comprehensive overview of rele-vant features used in publications on signature verification can be found in [19, 20]. Due to the resource and hard-ware limitations on a PDA platform like the one used in our project, we have based our initial research on biometric hash on 24 statistical features, which have been extended for the work presented in this paper to 50 parameters shown in
Table 1. To satisfy the need to have a fixed number of compo-nents, these features are either based on a global analysis of signals or on partitioning to a fixed number of subsets, which was chosen intuitively.
4.3. Interval matrix determination
The IM is a matrix with a dimension ofK×2, whereK de-notes the number of feature components that is taken into account, as listed inTable 1. Each of thei∈[1,. . .,K] two-dimensional vector components consists of an interval length
∆Iiand an offset valueΩi. The interval length and offset val-ues are determined for each user during an enrollment pro-cess consisting of j ∈ [1,. . .,N] writing samples for each of the nonnegative feature parameters ni,j in the following min/max strategy:
Initial interval length:∆IInit=IInitHigh−IInitLow; (2)
Interval:ILow,. . .,IHigh
which is, for each of the j features, an initial interval [IInitLow,. . .,IInitHigh] with an initial interval length∆IInit is determined. Then the effective interval [ILow,. . .,IHigh] is de-fined by the initial interval, with the left boundaryIInitLow re-duced byti∗∆IInit(or 0, if the term becomes negative) and the right boundaryIInitHighincreased byti∗∆IInit.
The parameter-specific tolerance factortiis introduced to compensate for the intravariability of each feature parameter. Factor values fortiare dependent on the number of samples per enrollment N and have been estimated in separate in-trapersonal variability tests as described inSection 5.Table 2
presents values fortiwhich have been estimated for each of the parametersnibased on an enrollment size ofN=6.
All feature parameters are of nonnegative integer type and test values will be rounded accordingly. Thus the eff ec-tive interval length∆Iican be written as
∆Ii=IHigh+ 0.5−
ILow−0.5=IHigh−ILow+ 1, (4)
whereas the interval offset valueΩiis defined as
Ωi=ILowMOD∆II. (5)
Thus, the IM can be written as follows:
IM=
The hash value computation is based on a mapping of each of the feature parameters of a test sample to an integer value scale. Due to the nature of the determination of the interval matrix, all possible valuesv1andv2within the extended in-terval [ILow,. . .,IHigh] for each of thei∈[1,. . .,K] features
niwithin IM, as defined in the previousSection 4.3, fulfill the following condition:
Table1: Feature parameters for the biometric hash calculation.
Parameter name Index Param. Description
Segment count 1 n1 Number of pen-down events
Duration 2 n2 Total writing duration in ms
Sample count 3 n3 Total number of samples
Maximum count 4 n4 Sum of local maximum inx- andy-signals
Aspect ratio 5 n5 x/ yratio of the writing image times 1000
Pen-up pen-down ratio 6 n6 Ratio of total pen-up and total pen-down times multiplied by 1000 X-integral 7 n7 Total area covered by the absolutex-signal
Y-integral 8 n8 Total area covered by the absolutey-signal X-velocity 9 n9 Average absolute writing velocity inx-direction Y-velocity 10 n10 Average absolute writing velocity iny-direction X-acceleration 11 n11 Average absolute writing acceleration inx-direction Y-acceleration 12 n12 Average absolute writing acceleration iny-direction
X-distribution velocity 13 n13 Maximumx-distribution Max(x)−Min(x) over total writing time Y-distribution velocity 14 n14 Maximumy-distribution Max(y)−Min(y) over total writing time
Segmentedx-areas 15–19 n15–n19 x-integral of 5 segments of equal lengthTTotal/5
Segmentedy-areas 20–24 n20–n24 y-integral of 5 segments of equal lengthTTotal/5
Path length 25 n25 Total path length of writing trace in pixel
DeltaX 26 n26 Total horizontal image expansion
DeltaY 27 n27 Total vertical image expansion
Effective average speed 28 n28 Ratio of total writing path length and total writing time
Pixel count 12-segment 29–40 n29–n40 Number of pixels in each 4 by 3 sector
Cumulated integral errorx 41 n41 Sum of absolutex-differences between discrete integration rectangle versus trapeze
Cumulated integral errory 42 n42 Sum of absolutey-differences between discrete integration rectangle versus trapeze
Integral error signx 43 n43 Effective sign of feature 41
Integral error signy 44 n44 Effective sign of feature 42
Cumulated radiant 45 n45 Radiant of cumulatedx/ yfrom upper left corner of image
Average radiant 46 n46 Average radiant of allx/ ysample points from upper left corner of image
Cumulated distance 47 n47 Distancetof cumulatedx/ yfrom upper left corner of image
Average distance 48 n48 Average distance of allx/ ysample points from upper left corner of image
Averagex-position 49 n49 Average of allx-sample values
Averagey-position 50 n50 Average of ally-sample values
write the hash functionhfor each feature parameter fiof a test sample as follows:
hfi,∆Ii,Ωi
= fi−Ωi
∆Ii
. (8)
Thus, the resulting hash vector consists ofKcomponents of integer values.
5. INTRAPERSONAL SCATTER: FEATURE DEVIATION One major problem in using biometric features to directly derive hash values is the trade-off between natural intra-personal variability of feature values between several samples of an individual user and the requirement to have a persis-tent value in the biometric hash. A trivial example for this dilemma is the total writing time of a signature. This feature is very straightforward to calculate and, therefore, very often
Table2: Tolerance values estimation forN=6.
Parameter name ti(%) ni
Segment count 565 n1
Duration 1400 n2
Sample count 590 n3
Maximum count 715 n4
Aspect ratio 635 n5
Pen-up pen-down ratio 625 n6
X-integral 645 n7
Y-integral 505 n8
X-velocity 625 n9
Y-velocity 780 n10
X-acceleration 545 n11
Y-acceleration 585 n12
X-distribution velocity 685 n13
Y-distribution velocity 765 n14
Segmentedx-area 1 1800 n15
Segmentedx-area 2 1085 n16
Segmentedx-area 3 595 n17
Segmentedx-area 4 860 n18
Segmentedx-area 5 1010 n19
Segmentedy-area 1 1060 n20
Segmentedy-area 2 1030 n21
Segmentedy-area 3 820 n22
Segmentedy-area 4 760 n23
Segmentedy-area 5 635 n24
Path length 655 n25
DeltaX 630 n26
DeltaY 710 n27
Effective average speed 750 n28
Pixel count segment 1/12 1065 n29
Pixel count segment 2/12 565 n30
Pixel count segment 3/12 1060 n31
Pixel count segment 4/12 470 n32
Pixel count segment 5/12 460 n33
Pixel count segment 6/12 1070 n34
Pixel count segment 7/12 495 n35
Pixel count segment 8/12 565 n36
Pixel count segment 9/12 320 n37
Pixel count segment 10/12 825 n38
Pixel count segment 11/12 760 n39
Pixel count segment 12/12 690 n40
Cumulated integral errorx 615 n41
Cumulated integral errory 340 n42
Integral error signx 0 n43
Integral error signy 0 n44
Cumulated radiant 495 n45
Average radiant 395 n46
Cumulated distance 840 n47
Average distance 1010 n48
Averagex-position 915 n49
400
350
300
250
200
150
100
50
0
De
vi
ation
(%)
n43 n44 n29 n30 n40 n5 n20 n23 n8 n15 n42 n27 n32 n35 n3 n37 n38 n22 n46 n1 n33 n39 n21 n36 n45 n14 n12 n9 n31 n18 n17 n10 n11 n24 n50 n28 n41 n4 n26 n13 n6 n25 n7 n47 n48 n16 n49 n34 n2 n19
Feature
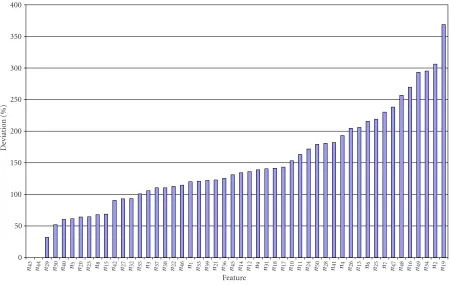
Figure2: Sorted histogram of average deviationdiin feature values of signatures withe=6 in initial test.
This initial test was based on 10 users with 10 writing samples of 5 semantic classes. All users are familiar with com-puter devices and the writing samples were collected during 2 enrollment sessions, where the second recording session was at least two weeks after the first. As mentioned in the motiva-tion, additional evaluations based on extended databases are described inSection 8and will be concluded with a compar-ison of test results.
Our tests for evaluation of the intravariability have been performed separately for the following 5 different semantic classes:
(i) signature;
(ii) fixedPIN(all users were asked to write the same PIN 8710);
(iii) arbitrarypass phrase(user may choose any combina-tion of words/numbers);
(iv) the Germanword“Sauerstoffgef¨aß” for all users; (v) arbitrary specific symbol (the user may use a short
sketch of his choice).
The tests have been performed based on all 10 users for each feature and each semantic class according to the following instructions:
(1) foreach of the semantic classess∈[signature, PIN, pass phrase, fixed word, and user-defined symbol], (a) foreachof theg∈[1,. . ., 10]usersug and foreach
of thei∈[1,. . ., 50]featuresni,
(i) divide each set of 10 samples into all possible combinations ofeenrollmentsamples and 10−e
test samples;
(b) foreach of theeenrollments and each of the10−e
tests, calculate the following deviation:
(i) determine minimum and maximum enrollment valuesveMinandveMaxfrom allesamples; (ii) determineaverage enrollment valueµe =veMin+
(veMax−veMin)/2;
(iii) determine minimum and maximum values tMin
andtMaxfrom the actual test sample;
(iv) calculatemaximum relative deviationdefrom av-erage enrollment valueµe:
de=MAX
µe−tMin
µe−veMin,µe−tMax
µe−veMax
; (9)
(v) averagede of all enrollments of all users and se-mantic classsinto average feature deviationdi,s.
Figure 2presents the histogram for the averaged deviations for each of the features numbersiof this test for an enroll-ment size ofe=6 samples and the semantic signature.
The two featuresn43andn44 (integration error sign for
xandysignals) resulted in a feature value of 0 for all tests, thus the relative deviation cannot be determined. We observe a relatively strong increase in deviations between featuren15
and high variance features, we classify features of the first category into low, the second into high, and all remaining into medium intravariance. We get the classification of low intravariance and high intravariance features inTable 3and
Table 4, respectively.
There are two interesting observations. The three features with the lowest intravariability are in the same feature cate-gory asn34, being amongst the three features with the highest variability. All these features are calculated by calculating the number of pixels of the writing trace in segmented images, which are obtained by dividing the signature image into 4×3 equal-sized images according toFigure 3.
While the two upper, leftmost areas show a high stability, the pixel count in area 6 is varying strongly. The other inter-esting observation is the ranking andn25(trace path length) andn2 (total writing duration). Both features are time- or sequence-variant and are commonly known as rather reli-able features for verification. Apparently these features are not significantly stable in the biometric hash generation and furthermore, it is interesting to see that in amongst the 8 pa-rameters of the low-variability class, only one online feature (n8,Y-Integral) can be found. An explanation for this obser-vation can be the global nature of features, which is a prereq-uisite for the calculation of the biometric hash as described in Section 4. Furthermore, the observation that segmented features in the upper left areas show a lower intrapersonal variance can be explained by the natural left-to-right writing orientation in Latin handwriting.
6. FEATURE ENTROPY
InSection 5, we have discussed aspects of intrapersonal vari-ability of biometric features based on handwriting. Intraper-sonal variability can be interpreted as a measure of instability of a feature parameter. For biometric systems, feature stabil-ity is a fundamental requirement; therefore, relevant features should show a low intrapersonal deviation. Besides the sta-bility, the individuality of features needs to be ensured. For the evaluation of individually, we present an entropy analy-sis in this section. Both characteristics together will then be combined into an indicator for the suitability of a particular feature for the biometric hash in theSection 7.
Information entropy had been introduced by Shannon more than half a century ago [22,23], and is a measure for the information density within a set of values with known occurrence probabilities. Knowledge of the information en-tropy is the basis for design of several efficient data coding and compression techniques like the Huffman code [24] as it describes the effective amount of information contained in a finite set. This question of effective information content is directly related to the uniqueness of a biometric feature, which motivated the authors to perform an entropy analysis for each feature of the biometric hash.
In the biometric hash scenario as described inSection 4, the interpersonal variability has a direct impact on the hash value space. For features with a low interpersonal variabil-ity, it can be expected that many users will have similar or
Table3: Features showing a low intravariability forN=6 with the
semantic class being signature.
Feature Description Deviation (%)
n29 Pixel count 12-segment (1/12) 32 n30 Pixel count 12-segment (2/12) 51.9 n40 Pixel count 12-segment (12/12) 60.4
n5 Aspect ratio 61.5
n20 Segmentedy-area 1/5 64.2
n23 Segmentedy-area 4/5 64.6
n8 Y-integral 67.9
n15 Segmentedx-area 1/5 68.7
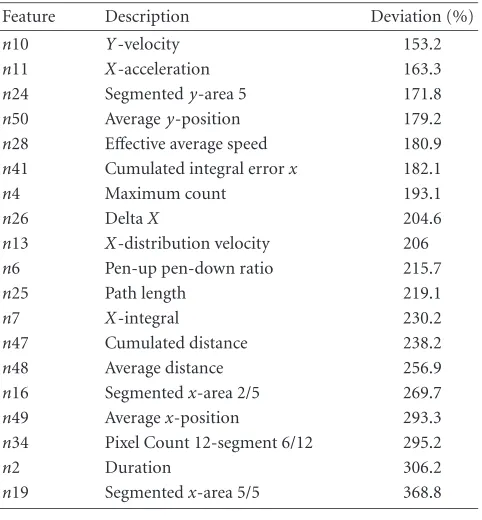
Table4: Features showing a high intrapersonal variability forN =
6 with the semantic class being signature.
Feature Description Deviation (%)
n10 Y-velocity 153.2
n11 X-acceleration 163.3
n24 Segmentedy-area 5 171.8
n50 Averagey-position 179.2
n28 Effective average speed 180.9 n41 Cumulated integral errorx 182.1
n4 Maximum count 193.1
n26 DeltaX 204.6
n13 X-distribution velocity 206
n6 Pen-up pen-down ratio 215.7
n25 Path length 219.1
n7 X-integral 230.2
n47 Cumulated distance 238.2
n48 Average distance 256.9
n16 Segmentedx-area 2/5 269.7
n49 Averagex-position 293.3
n34 Pixel Count 12-segment 6/12 295.2
n2 Duration 306.2
n19 Segmentedx-area 5/5 368.8
1 2 3 4
5 6 7 8
9 10 11 12
Figure3: Segmentation of the writing image into 12 equal-sized
areas.
100% 90% 80% 70% 60% 50% 40% 30% 20% 10% 0%
H
(
ni
)
n1 n2 n3 n4 n5 n6 n7 n8 n9 n10
n11 n12 n13 n14 n15 n16 n17 n18 n19 n20 n21 n22 n23 n24 n25 n26 n27 n28 n29 n30 n31 n32 n33 n34 n35 n36 n37 n38 n39 n40 n41 n42 n43 n44 n45 n46 n47 n48 n49 n50
Feature
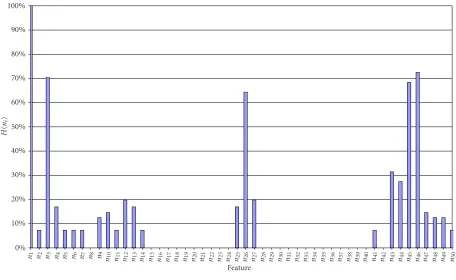
Figure4: Feature entropy of initial test relative toH(n1)=1.93 with the semantic being signature.
each biometric feature is capable of representing individual values to build the biometric hash. For this estimation, we apply the general formula to determine the entropyH of a systemXconsisting ofk∈[1,. . .,n] states with a respective occurrence probability of pk, in our context, each of the n states represents the occurrence of valuevk in the response of the biometric hash system, being one of the unique values that have been observed over allTtest passes for each feature. Thus the occurrence probability for feature valuevkwrites to
pk=count(vk)/Tand the feature entropy can be written to:
H(X)= − n
k=1
pk·log2pk. (10)
In this part of our analysis, we are mainly interested in a global quantitative comparison of information capacity of each of the features, as described inSection 4. In order to do so, the interpersonal feature entropy for the same test set as described inSection 5has been determined. For a classifica-tion, all entropy values have been normalized to the highest entropy occurrence, which was found for featuren1with an entropy ofH(n1)=1.93.
Figure 4shows the result of the entropy test, and it vi-sualizes the information content. For a number of features, the hash value was the same for all users in all verification tests. These cases lead to an entropy of zero, thusn15through
n24, n28 through n40, and n42 are zero and do not con-tribute any user-specific information in the biometric hash scenario. Amongst the remaining nonzero entropy features, five show entropy significantly higher than 50%; these are
n1,n3,n26,n45, andn46. The remaining features show rela-tively low entropy in the range between 7% and slightly above 30%. The clear boundary above 50% motivates our classi-fication into high-entropy (greater than 50%), low-entropy (greater than 0%, equal to 50%), and zero-entropy features. Thus in summary, the entropy test resulted in 5 relevant, high-entropy, 20 low-entropy, and 25 zero-entropy features.
7. FEATURE STABILITY AND ENTROPY CORRELATION
In Sections 6and7, we have presented two feature evalua-tion measures for biometric hashes: intrapersonal deviaevalua-tion as a term of instability and intrapersonal entropy as a mea-surement for information density. In order to have a quan-titative measure for the trade-offbetween deviation and sta-bility, we introduce the feature correlationCias the product between the relative feature stability Siand the feature en-tropyHi =H(ni) for one specific semantic class as per the description of the entropy test inSection 6as follows:
Si=1−
di/MAX
di,i∈[1,. . .,K]
, (11)
wheredidenotes average feature deviation (seeSection 5),
Ci=Si·Hi|i∈[1,. . .,K]. (12)
1 0.9 0.8 0.7 0.6 0.5 0.4 0.3 0.2 0.1 0
Cor
re
la
ti
o
n
n1 n2 n3 n4 n5 n6 n7 n8 n9 n10
n11 n12 n13 n14 n15 n16 n17 n18 n19 n20 n21 n22 n23 n24 n25 n26 n27 n28 n29 n30 n31 n32 n33 n34 n35 n36 n37 n38 n39 n40 n41 n42 n43 n44 n45 n46 n47 n48 n49 n50
Feature
Figure5: Feature stability and entropy correlation.
number ofK=50 features for our tests anddibeing the aver-age deviation for feature numberias per the feature variance test inSection 5,Siis normalized to the maximum feature de-viation, thus can have values in the range of [0,. . ., 1], which is also the case for the feature entropyHi. By calculating the product of both numbers, we receive the feature correlation valuesCias shown in the histogram ofFigure 5.
In order to determine suitable features for the biometric hash, we classify features according to their significance ac-cording to the following scheme:
(i) no significance:CI=0, (ii) low significance: 0< Ci<0.25, (iii) medium significance: 0.25≤Ci<0.5, (iv) high significance: 0.5=CI.
The classification summary inTable 5displays that there is a clear threshold between the 7 features with high and medium significance (n1,n3,n46,n45,n44,n43,n26) and the best feature in the low-significance class n9. This leads us to the con-clusion that these features are most suitable amongst the 50 tested for our application of biometric hashes. All 7 features are based on time variant information; however, onlyn3, the sample count, has a linear relation to the writing signal. All other features are second order, based on combined temporal and spatial information.
8. EVALUATION ON EXTENDED DATA SETS
Although the initial evaluation presented in the previous sec-tions confirms the feasibility of feature evaluation in princi-ple, the underlying initial data set is too small to justify
signif-icant conclusions. Furthermore, during the initial test, where both signal capturing and data processing were performed on a computationally slow handheld computer, it has turned out that tests on larger data sets could not be performed in reasonable time. Therefore, methods for the biometric hash have been migrated to a PC platform using Object Pascal, and additional tests have been performed on reasonably per-formant Windows 2000 PC (1.7 GHz, 512 MB RAM).
Data sets used for these extended tests are subsets from a handwriting verification database, which has been collected in an educational environment over a period of three years, containing 5829 signatures from 60 writers obtained from various digitizer tablet devices, as can be seen fromTable 6.
The only limitation compared to the initial test set from
Section 5 is the number of features that has been imple-mented on the new platform, which at the time of publi-cation were 36 of the originally 50-dimensional feature set presented inTable 1. The remaining feature set (seeTable 7) was considered to be reasonable to evaluate, particularly as for some of the missing features from the original set, it can be assumed that they are highly correlated (e.g.,n26 andn27 with n5,n28 withn9 andn10) as they are linearly depen-dent due to the nature of their determination. Additionally, with the extended database, we have the advantage of a first hardware independent analysis of the algorithm, as sample features originating from various different digitizer devices are included.
Table5: Feature significance classification.
Significance high Significance medium Significance low Significance 0 Feature number Correlation Description
X n1 0.67462039 Segment count
X n3 0.501734511 Sample count
X n46 0.499881971 Average radiant
X n45 0.440496027 Cumulated radiant
X n44 0.274043819 Integral error signy
X n43 0.314424886 Integral error signx
X n26 0.286563794 DeltaX
X n9 0.078190808 X-velocity
X n7 0.027517839 X-integral
X n6 0.030396689 Pen-up pen-down ratio
X n50 0.03764345 Averagey-position
X n5 0.061011774 Aspect ratio
X n49 0.025678147 Averagex-position
X n48 0.038058075 Average distance
X n47 0.051751071 Cumulated distance
X n41 0.03706768 Cumulated integral errorx
X n4 0.080758321 Maximum count
X n27 0.148098756 DeltaY
X n25 0.068807745 Path length
X n2 0.012428692 Duration
X n14 0.046557959 Y-distribution velocity
X n13 0.074828997 X-distribution velocity
X n12 0.125008667 Y-acceleration
X n11 0.040800259 X-acceleration
X n10 0.085432856 Y-velocity
X n8 0 Y-integral
X n15 0 Segmentedx-area 1
X n16 0 Segmentedx-area 2
X n17 0 Segmentedx-area 3
X n18 0 Segmentedx-area 4
X n19 0 Segmentedx-area 5
X n20 0 Segmentedy-area 1
X n21 0 Segmentedy-area 2
X n22 0 Segmentedy-area 3
X n23 0 Segmentedy-area 4
X n24 0 Segmentedy-area 5
X n28 0 Effective average speed
X n29 0 Pixel count segment 1/12
X n30 0 Pixel count segment 2/12
X n31 0 Pixel count segment 3/12
X n32 0 Pixel count segment 4/12
X n33 0 Pixel count segment 5/12
X n34 0 Pixel count segment 6/12
X n35 0 Pixel count segment 7/12
X n36 0 Pixel count segment 8/12
X n37 0 Pixel count segment 9/12
X n38 0 Pixel count segment 10/12
X n39 0 Pixel count segment 11/12
X n40 0 Pixel count segment 12/12
Table6: Test set size of the extended database by tablet type.
Tablet name Count (signatures)
Aiptek Hyperpen 8000 9
Palm Vx 447
EIZO Flexscan Touchscreen 18 1118
Wacom 1 serial 621
Wacom Cintiq 15 1284
Wacom Intuos 2 547
Wacom Intuos 2 Inkpen 31
Wacom 1 USB 971
Wacom Valito 801
Table7: Feature parameters evaluated from the extended test set.
Parameter name Index Param. Description
Segment count 1 n1 Number of pen-down events
Duration 2 n2 Total writing duration in ms
Sample count 3 n3 Total number of samples
Aspect ratio 5 n5 x/ yratio of the writing image times 1000
Pen-up pen-down ratio 6 n6 Ratio of total pen-up and total pen-down times multiplied by 1000
X-integral 7 n7 Total area covered by the absolutexsignal
Y-integral 8 n8 Total area covered by the absoluteysignal
X-velocity 9 n9 Average absolute writing velocity inxdirection
Y-velocity 10 n10 Average absolute writing velocity inydirection
X-distribution velocity 13 n13 Maximumx-distribution Max(x)−Min(x) over total writing time Y-distribution velocity 14 n14 Maximumy-distribution Max(y)−Min(y) over total writing time
Segmentedx-areas 15–19 n15–n19 x-integral of 5 segments of equal lengthTTotal/5
Segmentedy-areas 20–24 n20–n24 y-integral of 5 segments of equal lengthTTotal/5
Path length 25 n25 Total path length of writing trace in pixel
Pixel count 12-segment 29–40 n29–n40 Number of pixels in each 4 by 3 sector
Averagexposition 49 n49 Average of allxsample values
Averageyposition 50 n50 Average of allysample values
(i) semantic class (s∈[signature]); (ii) number of users isg∈[1,. . ., 54];
(iii) the selection of samples was implemented by drawing 10setsofe=6enrollmentsamples and 10−e=4test samples minus for each userug and each tablet type from the database in a pseudorandom manner.
Due to the large number of samples for some users in the ex-tended database, disallowing an exhaustive evaluation of all enrollment/test set pairs, the approach of pseudorandom se-lection was chosen to reasonably limit the number of trials. Results of deviation and entropy analysis of the extended test are presented in Figures6a,6b. Furthermore,Figure 7 visu-alizes the comparison of correlation between feature entropy and deviation between the initial tests as perFigure 5and the results of the extended database in ascending order for the later factors.
Correlation factors from the extended test show a statis-tical characteristics with a means value ofµExtended =0.175 and standard deviation ofsExtended =0.133 as compared to
400
350
300
250
200
150
100
50
0
De
vi
ation
(%)
n1 n10
n50 n6 n18 n49 n15 n21 n5 n23 n9 n13 n25 n7 n24 n16 n17 n20 n3 n14 n32 n8 n19 n2 n22 n39 n31 n40 n35 n30 n33 n34 n36 n29 n38 n37
Feature (a)
100% 90% 80% 70% 60% 50% 40% 30% 20% 10% 0%
H
(
ni
)
n1 n2 n3 n5 n6 n7 n8 n9 n10
n13 n14 n15 n16 n17 n18 n19 n20 n21 n22 n23 n24 n25 n29 n30 n31 n32 n33 n34 n35 n36 n37 n38 n39 n40 n49 n50
Feature (b)
Figure6: Sorted feature deviation histogram and relative entropy determined from extended test database. (a) Feature value deviations
1 0.9 0.8 0.7 0.6 0.5 0.4 0.3
0.2 0.1 0
Cor
re
la
ti
o
n
Ci
n37 n38 n29 n22 n40 n36 n8 n7 n19 n17 n34 n20 n39 n18 n21 n16 n15 n33 n14 n35 n10 n6 n30 n24 n25 n13 n9 n2 n23 n50 n31 n49 n3 n5 n32 n1
Feature All tablets
Palm
Figure7: Comparison between stability-entropy correlation of initial and extended databases.
9. CONCLUSION AND FUTURE WORK
In this article, we have presented a new method to evalu-ate a given biometric authentication algorithm, the biometric hash, by analyzing the features taken into account. We have presented test results from two different data sets of quite different size and origin and introduced three measures for feature evaluation: intrapersonal feature deviation, interper-sonal entropy of hash value components, and the correlation between both. Based on this basic idea, we resulted in an ini-tial perception that on a very specific device, a PDA, 7 out of 50 investigated features can be classified as high or medium significant.
As the first results indicated the suitability of our ap-proach, we have performed tests on a significantly extended database in order to get more general and statistically more relevant conclusions. Three main conclusions can be derived from the second test:
(i) with a few exceptions, all of the features showing high significance in the initial test have been reconfirmed; (ii) entropy of hash values increases over a large set of
dif-ferent tablets as compared to the PDA device; all fea-tures have shown nonzero entropy in the extended test; (iii) feature scattering appears to be rather high on PDA de-vices as compared to the average over the set of various tablets.
The evaluation data set presented in this work is the largest data set used for a feature analysis of dynamic handwriting based on signature and other semantic classes that could be found in the literature. In [16], a number of 10 different se-mantic classes for writer verification has been suggested and tested with 20 different users; however, this work limits ob-servations on results in terms of false acceptance rate (FAR) and false rejection rate (FRR) and does not analyze variabil-ity within feature classes. Due to the total size of our tests, we consider our findings as statistically significant, opening many areas for future work, where we plan to concentrate on three main aspects: algorithm optimization, additional tests including feature benchmarking, and applications.
tolerance value determination rather than a global estima-tion. Although there is no security threat the IM, as it does not allow reverse-engineering of the full biometric template, there still is the problem of enrollment and storing this in-formation for each user individually. To overcome this po-tential objective for real-world applications, we are working towards mechanisms to determine a biometric hash without any a priori parameters based on the individual.
Based on the introduced three statistical measures, it is also interesting from the discipline of feature selection re-search to perform feature selection benchmarks by compar-ing FAR and FRR, based on different feature sets. Here, it will be necessary to determine competing feature sets based on the method presented in this paper and a selection of other published feature evaluation approaches of different nature. A comparison of verification and recognition results for the biometric hash algorithm, parameterized with these different feature sets, will allow conclusions in regard to the impact of feature selection on recognition accuracy.
REFERENCES
[1] A. Jain, R. Bolle, and S. Pankanti, “Introduction to biomet-rics,” inBiometrics: Personal Identification in Networked So-ciety, A. Jain, R. Bolle, and S. Pankanti, Eds., vol. 479 ofThe Kluwer International Series in Engineering and Computer Sci-ence, pp. 1–41, Kluwer Academic Publishers, Boston, Mass, USA, January 1999.
[2] J. L. Wayman, “Fundamentals of biometric authentication technologies,” International Journal of Image and Graphics, vol. 1, no. 1, pp. 93–113, 2001.
[3] D. D. Zhang,Automated Biometrics: Technologies and Systems, vol. 7 ofThe Kluwer International Series on Asian Studies in Computer and Information Science, Kluwer Academic Pub-lishers, Boston, Mass, USA, 2000.
[4] Directive 1999/93/EC of the European parliament and of the council of 13 December 1999, http://www.signatur.rtr.at/en/ repository/legal-directive-20000119.html.
[5] B. Struif, “Use of biometrics for user verification in electronic signature smartcards,” inSmart Card Programming and Secu-rity (Proc. International Conference on Research in Smart Cards (e-smart ’01)), I. Attali and T. Jensen, Eds., vol. 2140 of Lec-ture Notes in Computer Science, pp. 220–227, Cannes, France, September 2001.
[6] C. Vielhauer, R. Steinmetz, and A. Mayerh¨ofer, “Biometric hash based on statistical features of online signatures,” inProc. 16th International Conference on Pattern Recognition (ICPR ’02), vol. 1, pp. 123–126, Quebec City, Quebec, Canada, Au-gust 2002.
[7] J. Kittler, “Mathematical methods of feature selection in pat-tern recognition,”International Journal of Man-Machine Stud-ies, vol. 7, no. 5, pp. 609–637, 1975.
[8] M. A. Hall, Correlation-based feature selection for machine learning, Ph.D. thesis, Department of Computer Science, Uni-versity of Waikato, Hamilton, New Zealand, 1999.
[9] D. A. Forsyth and J. Ponce, Computer Vision: A Modern Ap-proach, Prentice-Hall, Englewood Cliffs, NJ, USA, 2003. [10] Z. Chi and H. Yan, “Feature evaluation and selection based
on an entropy measurement with data clustering,” Optical Engineering, vol. 34, no. 12, pp. 3514–3519, 1995.
[11] R. Plamondon and S. N. Srihari, “On-line and off-line hand-writing recognition: a comprehensive survey,”IEEE Trans. on
Pattern Analysis and Machine Intelligence, vol. 22, no. 1, pp. 63–84, 2000.
[12] F. Maarse, L. Schomaker, and H.-L. Teulings, “Automatic identification of writers,” inHuman-Computer Interaction: Psychonomic Aspects, G. van der Veer and G. Mulder, Eds., pp. 353–360, Springer-Verlag, New York, NY, USA, October 1988. [13] S. Lee, S.-H. Cha, and S. N. Srihari, “Combining macro and micro features for writer identification,” inDocument Recog-nition and Retrieval IX, P. B. Koutor, T. Kanungo, and J. Zhou, Eds., vol. 4670 ofProceedings of SPIE, pp. 155–166, Proceed-ings SPIE, San Jose, Calif, USA, December 2001.
[14] J. Kaiser, “Vertrauensmerkmal unterschrift—gestaltungskrit-erien f¨ur sichere signierwerkzeuge,” in Informatik 2001— Tagungsband der GI/OCC-Jahrestagung, pp. 500–504, Vienna, Austria, September 2001.
[15] C. Vielhauer, “Handschriftliche authentifikation f¨ur digitale wasserzeichenverfahren,” inSicherheit in Netzen und Medien-str¨omen, M. Schumacher and R. Steinmetz, Eds., pp. 134–148, Springer-Verlag, Berlin, Germany, September 2000.
[16] Y. Kato, T. Hamanoto, and S. Hangai, “A proposal of writer verification of hand written objects,” inIEEE International Conference on Multimedia and Expo (ICME ’02), pp. 585–588, Lausanne, Switzerland, August 2002.
[17] R. K. Nichols, ICSA Guide to Cryptography, McGraw-Hill, New York, NY, USA, 1999.
[18] F. Monrose, M. K. Reiter, Q. Li, and S. Wetzel, “Using voice to generate cryptographic keys,” inProc. Odyssey, The Speaker Verification Workshop, Crete, Greece, June 2001.
[19] R. Plamondon and G. Lorette, “Automatic signature verifica-tion and writer identificaverifica-tion—the state of the art,” Pattern Recognition, vol. 22, no. 2, pp. 107–131, 1989.
[20] F. Leclerc and R. Plamondon, “Automatic signature verifica-tion: the state of the art 1989–1993,” International Journal of Pattern Recognition and Artificial Intelligence, vol. 8, no. 3, pp. 643–660, 1994.
[21] H. Dullink, B. van Daalen, J. Nijhuis, L. Spaanenburg, and H. Zuidhof, “Implementing a DSP kernel for online dy-namic handwritten signature verification using the TMS320 DSP family,” Tech. Rep. SPRA304, Texas Instruments, EFRIE, France, 1995.
[22] C. E. Shannon, “A mathematical theory of communication,” Bell System Technical Journal, vol. 27, no. 3, pp. 379–423, 1948. [23] C. E. Shannon, “A mathematical theory of communication,” Bell System Technical Journal, vol. 27, no. 4, pp. 623–656, 1948. [24] M. Nelson and J.-L. Gailly,The Data Compression Book, M&T
Books, New York, NY, USA, 1995.
Claus Vielhaueris an Assistant Researcher at Otto-von-Guericke University of Magburg, Germany, where he has joined the de-partment of Computer Science in 2003 as the Leader of the biometrics research group as part of the Advanced Multimedia and Se-curity Lab (AMSL). In addition, he is work-ing for the Multimedia Communications Lab (KOM) of Technical University Darm-stadt, Germany, since 1999, where he also
signature verification and biometric test criteria. Furthermore, he is a member of technical program committees of international con-ferences of great importance to biometrics (ICME, ICBA) and has been organizing and cochairing a number of special sessions on biometrics (ICME, SPIE). Additionally, since 2000, he is the Man-aging Director of Platanista GmbH, a spinoffcompany focusing on IT security.
Ralf Steinmetzworked for over nine years in industrial research and development of distributed multimedia systems and appli-cations. Since 1996, he has been the head of the Multimedia Communications Lab at Darmstadt University of Technology, Ger-many. From 1997 to 2001, he directed the Fraunhofer (former GMD) Integrated Pub-lishing Systems Institute (IPSI) in Darm-stadt. In 1999, he founded the Hessian