Vol.9 (2019) No. 1
ISSN: 2088-5334
New Functions and Evaluation for Learning Effects of Acceleration
Experiment Support Software
Takahiro Hoshino
#, Yuki Ota
#, Kohei Tomaru
#, Yoshio Hamamatsu
#, Takafumi Komuro
*#
College of Science and Technology, Nihon University, Tokyo, 101-8308, Japan E-mail: [email protected]
*
Mechanical and Control Engineering Course, Dept. of Industrial Engineering, National Institute of Technology, Ibaraki College, Ibaraki, 312-8508, Japan
Abstract— In Japan, junior high and high school students typically learn the concept of velocity by experiments with a timer and
recording tape. To promote more intuitive understanding and provide a flexible lesson length, we developed the AES (Accelerated Motion Experiments Support) software and experimental system. To verify the effectiveness of the experimental system, we observed students conducting experiments of descending motion on a slope using the system. This paper reports newly implemented functions for displaying mechanical (kinetic and potential) energy and improving operability. We show example applications using these functions: accelerated motion on a horizontal rail. In the experiments, it is clear that the measuring values measured using AES have accuracy that is the same as or better than the values measured using a traditional recording timer. We conducted a comprehension test for the theory relating to the experiments before and after the experiments. From the results, we discuss educational effects about the experiment system using AES and the experimental procedure. Learning comprehension tests find that the correct answer rate of almost questions is improved after the experiments. However, the correct answer rate does not increase in the question about the change in acceleration values. The displayed values are lower than actual sensor values because of filtering process which makes reduce the influence of errors due to the sensitivity. This may cause students to make the wrong choice. Questionnaire results indicate that the system is easy to operate and promote active participation in the experiments.
Keywords— physics experiment; physics education; smart device; smartphone; acceleration experiment support software.
I. INTRODUCTION
Physics lessons in junior high and high schools in Japan often include experiments that measure the travel distance of a mechanical trolley that marks a recording tape at a constant period, using a recording timer as a measuring device [1]-[3]. Other experimental methods also use measurement devices, such as simple velocimeters [4], video cameras [5] or high-speed cameras [6]-[8] and sensors [9]. When using recording timers, the velocity and acceleration are derived from the amount of change in distance per unit time as determined from the recording tape.
The authors have developed the AES (Acceleration Experiment Support software) [10],[11] for smart devices as a replacement for the recording timers typical of educational experiments. This is aimed at improving class time management and fostering direct learner understanding. We conducted two evaluation experiments to confirm its validity. The first experiment investigated basic usability by applying AES to descent motion experiments and administering a
In previous evaluation experiments, we mainly investigated learning effects as revealed by student evaluations related to the usability of AES. To further verify effectiveness, however, we considered it necessary to perform investigations based on objective data. This paper, therefore, presents the results of examining the learning effects as shown by comprehension tests conducted before and after the experiment. Previous investigations have studied whether basic physics experiments for the
slope-descending motion are possible, but here we propose applying AES to acceleration experiments on a horizontal rail using a pulley device.
This report gives an outline of AES and its newly added functions, then describes the method and results of evaluation experiments aimed at examining learning effects when using AES.
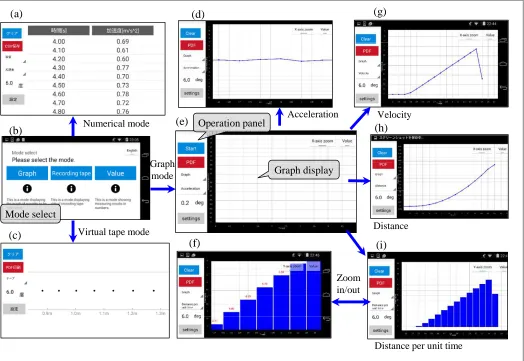
The main functions of AES are introduced by Fig. 1 shown the flow of AES.
Fig. 1 Flow of the application software
II. MATERIAL AND METHOD
A. Acceleration Experiment Support Software (AES)
When Users run AES, screen (b) is shown. In this screen (b), users can select three display modes: graphical display mode (e); virtual tape mode (c), which replicates the traditional ticker-tape plot of distance per unit time; and a numerical value display mode (a), which shows measured values. Users can switch between display modes at any time. In graphical or numerical display modes, users can change the physical quantity that is shown at any time: they can select acceleration (d), velocity (g), distance (h) or distance
per unit time (i) as the measured quantity for display. When changing the displayed measurement, users are shown the appropriate output from the start of the experiment. After selecting the measurement quantity and tapping the start button, a graph is displayed immediately. Measurement is automatically ended, when users tap the end button or the smart device detects an acceleration in the direction opposite to its motion direction. The extended functions of AES include zooming in or out a graph (f) and displaying the measured value on the graph. With these functions, we expect to be able to meet the needs of various physics education experiments.
Graph mode
Acceleration
Distance per unit time Velocity
Numerical mode
Mode select
Graph display Operation panel
Virtual tape mode Distance
Zoom in/out
(a)
(b)
(c)
(d)
(e)
(f)
(g)
(h)
B. Experimental System
We describe two experimental systems using AES in this section. Figure 2 shows an experimental system for descent motion on a slope.
Fig. 2 Experimental system using AES for motion on an inclined rail
We use a smartphone as measuring devices because smartphones are generally small than tablets. When fixing the smartphone to the dynamics trolley, we make the y-axis of the smartphone match the motion direction. To make it easier for students to check measuring results, a smartphone mirrors their screen to an external display by wireless display adapters. Thus,these experimental devices make be able to simultaneously observe how the dynamics trolley descend on the experimental rail and how its acceleration or velocity changes. Students can get more understanding of the graphs through simultaneous observation of moving the dynamics trolley and the changes in the physics quantities; furthermore, teachers can use it for demonstration experiments.
Fig. 3 Experimental system using AES for motion on a horizontal rail.
Figure 3 shows an experimental system using AES for an accelerated motion experiment on a horizontal rail. In this experiment, the dynamics trolley is moved by connecting to a mass with a string via a pulley. A smart device and an external display are used in the same way as in the experimental system for motion on an inclined rail. In order to adjust the duration of the experiment, some graphs can be output using a mobile printer.
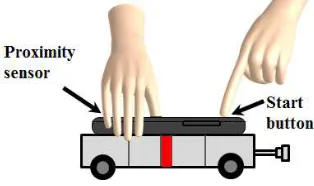
C. Measurements Using a Proximity Sensor
Acceleration sensor values are in constant flux due to the influences of micro-vibrations, which greatly influence integral calculations for speed and movement distance. Furthermore, this error accumulates with time, between the time when the operator presses the start button and the time when the trolley travels down the slope. To address this problem, we use a proximity sensor embedded within a smart device and perform measurements as shown in Fig. 4.
Fig. 4 Measurement using proximity sensor
Proximity sensors are generally installed in the upper part of the smart device. When proximity sensors detect objects, we take the acceleration value to be 0 [m/s2]. Immediately before initiation of motion, the operator holds the trolley so that one hand covers the proximity sensor (Fig. 4) and presses the start button with the other hand, then slowly releases the trolley to allow it to descend, thereby preventing error accumulation before movement starts.
D. Mechanical Energy Display Function
Assuming application to various experiments, newly added features include measurement items for kinetic energy, potential energy, and mechanical energy. Values for these items are calculated from the measurement results for acceleration according to the formulae shown below. When calculating these energy values, it is necessary to input into the software values for height h and the total mass m of the device and the trolley. From velocity v(t) at time t, we calculate kinetic energy Ek(t) as
For potential energy Ep(t), we use the travel distance x(t) at
time t, and, from h=(X-x(t))sinθ for a traversable slope of length X,
Where g is gravitational acceleration and θ is the angle of ascent. Values for the total mass m and the length X can be input from the AES configuration screen. The mechanical energy Em(t) at time t is calculated as
Energy measurements are displayed both individually and simultaneously to allow an easy understanding of relations between each measurement amount.
Figure 5 shows a graphing screen simultaneously displaying each measured quantity during slope descent. Tapping on the “Display” button at the top of the screen allows setting each energy measurement to be displayed or hidden. This aids understanding of changes in and relations among energy values.
Dynamics trolley
External display
θ Smartphone
Wireless display adapter Experimental rail
Printer
External display
Wireless display adapter
Smartphone Dynamics trolley
Experimental rail Constant
acceleration device
Fig. 5 Mechanical energy graph screen.
Fig. 6 Energy graph for an 8° slope with AES.
Figure 6 shows the experimental results of using the newly added functions. We performed experiments five times using the same smartphone. In the figure, the dashed line shows theoretical values, while the red, blue, and black plots show kinetic, potential, and mechanical energy, respectively, as measured in the AES experiments. The type of graph plot was changed for each experiment. Here, the total mass of the smart device and the trolley was 610 [g], and the traversable distance was 88 [cm]. The theoretical values are those calculated using Eqs. (1)-(3) according to the values for mass and traversable length input in the configuration screen. For comparison,
Fig. 7 Energy graph for an 8° slope with recording timer and tape
Figure 7 shows the calculated energy values from the results measured by high school students using recording timer and tape in reference [7]. It can be seen that the results obtained using AES are closer to the theoretical value than those obtained using the recording timer and tape. The results obtained using AES show slightly variation for the theoretical value. Factors related to deviation from theoretical values likely include device sensitivity and friction between the slope and the trolley. We note, however, that there is less variation than recording timer and paper in between-experiment measurements and that error (distance from theoretical values) is low, indicating sufficient applicability to educational experiments in junior high and high schools.
E. PDF Printing Function
To shorten experiment times and allow reflection on the experimental results, we provided functions for directly printing AES-generated graphs from the software. Printing can be performed via any printer that is compatible with the Wi-Fi Direct standard. We newly added a “Print PDF” button at the top of the AES graphing screens. Tapping this button converts the current graphing screen to a PDF rendering that can be sent to a printer-compatible application.
III.RESULTS AND DISCUSSION
In this section, we give details of an experimental procedure to discuss the educational effects provided by AES.
A. Experiment Condition
B. Experiment Procedure
Table 1 shows the outline of an evaluation experiment. First, the teacher explained and reviewed theories and concepts of acceleration and velocity along with measurement principles for using the smart device (phone).
Then each student individually answered understanding confirmation questions on the concepts of acceleration and velocity before experimenting. The students conducted the experiments by following a prepared experiment procedure, that included the operation of AES. Accelerated motion experiments on the horizontal rail and descent motion experiments on the slope were conducted by each group. The usable time for the experiments was 75 minutes out of the 105-minute class time. The experimental procedures were as follows.
Experimental procedure for horizontal rail:
(1) Place an experimental rail horizontally. Attach a 100 [g] mass to a string connected to a dynamics trolley. After threading the string through the constant acceleration device, place the dynamics trolley at the start position and hold it there.
(2) Select “acceleration” as the measured physical quantity. When the hand releases the dynamics trolley, the mass begins to free fall and the dynamics trolley with the smartphone moves in the horizontal direction. Measure and observe acceleration values during the motion using AES. Teachers instruct the students to make careful observations of the motion of the dynamics trolley and the changes of the chosen physical quantity at the same time.
(3) Display values measured at each time point on the
graph using the measured value display function.
(4) Print the graph with the displayed acceleration values using the PDF printing function.
(5) Read the values from the printed graph and record the acceleration at each time point on the prepared working sheet.
(6) Calculate velocities at each time point from the acceleration values which are recorded in step (5) and note the values on the work sheet.
(7) Draw a graph of the velocity values obtained by step (6).
(8) Change from a 100 [g] mass to a 50 [g] mass, and repeat the procedure in steps (1) to (4).
(9) Switch the physical quantity to be displayed to “velocity” and display the graph of velocity.
(10) Print this graph using the PDF printing function. (11) Write down the equations of motion for a dynamics
trolley on a horizontal rail. From the equations, find the theoretical value of acceleration for both mass values.
Experimental procedure for slope:
(1) Adjust the slope angle to 8° using the angle indicator in AES.
(2) Select “acceleration” as the measured physical quantity. Let the dynamics trolley equipped with the smartphone travel down from the top of the slope. Measure and display a graph of the acceleration during the motion using AES. Teachers instruct the students to make careful observations of the motion of the dynamics trolley and the changes of the chosen physical quantity at the same time.
(3) Draw a graph of velocity using the same procedure as in steps (3) - (7) in the experiment with the horizontal rail.
(4) Adjust the slope angle to 4° using the angle indicator in AES, and repeat steps (1) – (3).
The students in the groups that finished the above experiments answered the understanding confirmation test again. The questions in this test are the same as those in the test carried out before the experiment. Students then discussed given consideration themes using the experimental results in each group. The themes of the discussion were the following four items.
Experiments on horizontal rail:
(1) Influence of mass on velocity and acceleration (2) Sources of error between measured values and
theoretical values
Experiments on a slope:
(1) The relationship between time and velocity or acceleration during the motion
(2) Influence of slope angle on velocity and acceleration
When discussing the above issues, we instructed students to express freely group opinions about using AES.
C. Measurement Results
Figures 8 and 9 show measurements of acceleration obtained by students using AES in the evaluation experiments on the horizontal rail.
TABLEI
OUTLINE OF EVALUATION EXPERIMENT
Item Experimental contents
Introduction Explanation of review theories and measurement principle
Test understanding (before experiment)
Answering questions about
accelerated motion before
experiments
Experiment
Accelerated motion experiment on horizontal rail with a 100 [g] mass Accelerated motion experiment on horizontal rail with a 50 [g] mass Descent motion experiment on an 8° slope
Descent motion experiment on a 4° slope
Test understanding (after experiment)
Answering questions about
accelerated motion after
experiments
Consideration
Considering the results of the experiments conducted by each group
Conclusion Summarizing the results of the experiments
Fig. 8 Measured acceleration for the horizontal rail with a 50 [g] mass.
Fig. 9 Measured acceleration for the horizontal rail with a 100 [g] mass.
The mass in Fig. 8 is 50 [g] and the mass in Fig. 9 is 100 [g]. The analytical values without considering frictional force are shown as dotted lines in the graphs. For comparison, the measured values of acceleration for the same experiments obtained by students of the university to which the authors belong using a recording timer and tape are plotted using the symbol “×.” It can be seen that the results obtained using AES are slightly lower than the theoretical value; however, the results are closer to the theoretical value than those obtained using the recording timer and tape. The acceleration values obtained using the recording timer and tape are lower than those obtained using AES since a greater frictional force is generated by the paper tape and the recording timer. Also, it can be seen that the variation of measured values for each group tends to be smaller in the results obtained using AES. Thus, it is clear that AES can provide stable experimental results.
D. Results of Comprehension Test
We asked the students to complete an understanding confirmation test before and after the experiments in order to be able to quantitatively discuss the change of students’ understanding of the theory of velocity and acceleration as a result of the experiments using AES. The contents of the test are the same before and after the experiments. For questions 1 to 5, students need to answer both horizontal and slope experiments. Question 6 asks only about slope experiments, and question 7 asks only about horizontal rail experiments.
Table 2 shows the contents of the understanding confirmation test and Table 3 shows the correct answer rates before and after the experiments.
An increase in the level of understanding of the concepts of acceleration and velocity is apparent in the results for Q1 and Q2. Q3 and Q4 asked the students to pick the correct (sketch) graphs of acceleration and velocity for each type of experiment. The correct answer rate for Q3 is improved for both the horizontal and the slope experiments. Simultaneously observing the motion of the trolley and the process of graph drawing brings a better understanding of the change in velocity. The correct answer rate for Q4 is slightly improved in the slope experiments; however, there is no improvement for the horizontal rail experiments. Many of the mistaken students chose (e) as the answer for the acceleration in both cases. To reduce the influence of errors due to the sensitivity of the acceleration sensor and micro vibration, AES applies a low pass filter to sensor values obtained by a smart device. Since the filtering process makes the displayed value lower than the actual sensor value at the start of the measurement, this may cause students to make the wrong choice.
Q5 to Q7 are questions about the influence of changes in experimental conditions on the acceleration. It can be seen from Table 3 that the correct answer rate is improved except for Q6. The correct answer rate for Q5 in the slope experiments is the lowest for all questions. On the horizontal rail, the acceleration decreases with increasing mass of the trolley. However, the acceleration on the slope is constant even if the mass increases. As a result, many students mistakenly thought that the change in mass affects the acceleration on the slope in the same way as in the horizontal experiments. In the evaluation experiments, the acceleration for different trolley masses was not measured. However, the correct answer rate for Q5 is greater after the experiments than before the experiment for both types of experiment. We think the reason for this is the following. In order to consider the causes of the errors between the measured values and the theoretical value, the students need to derive the theoretical value of the acceleration in the experimental procedure in the horizontal experiments.
Students who understand the meaning of the theoretical equation could predict how the acceleration changes when changing the mass of the trolley. For this reason, the correct answer rate for Q7 is also improved. The correct answer rate for Q6 does not change for the slope experiments because some groups did not finish part of the slope experiments within the experimental time (75 min). In order to improve this, we need to reconsider the experimental procedure.
E. Results of the Questionnaire
In order to evaluate the operability (ease of use and usefulness from the students’ perspective) of AES and its effect on the students’ interest in physics and level of participation in the experiments, a questionnaire survey was conducted after the experiments. Questions Q4 to Q6 were answered for both types of experiment. Table 4 shows a part of the questionnaire results.
0.0 0.2 0.4 0.6 0.8 1.0 1.2
0.0 0.4 0.8 1.2 1.6 A cc el er at io n [ m /s 2 ] Time [s]
m2=100 [g] Theoretical value
(a =1.382 [m/s2])
: Group 1 : Group 2 : Group 3 : Group 4
: Group 5 : Group 6 : Group 7
: Paper tape recorder : Group 8
0.0 0.2 0.4 0.6 0.8 1.0 1.2 1.4
0.0 0.2 0.4 0.6 0.8 1.0 1.2 1.4 A cc el er at io n [ m /s 2 ] Time [s]
m2=50 [g]
Theoretical value
(a =0.743 [m/s2])
: Group 1 : Group 2 : Group 3 : Group 4
: Group 5 : Group 6 : Group 7
From the results for Q1, it is clear that more than 70% of students felt able to participate actively in the experiments. It seems that many tasks, such as graph drawing and reading measured values, gave an impression of active participation. Thus the automation of data collection does not produce a feeling of alienation in the students. From the results for Q2, it can be seen that more than 50% of the students increased their interest in physics. From the results for Q3, nearly 70% of students think that they would like to use AES for other experiments. Part of the reason for the eagerness to use AES again may be indicated in the results for Q4, which show that the students generally found AES easy to use.
From the results for Q5, 70% of the students thought that using AES was useful in considering the results obtained in both experiments. With AES students can perform experiments (measurements) more easily than with the recording timer and can immediately view the relevant graphs. Therefore, this approach is suitable for the rapid testing of hypotheses. The results of Q6 show that more than 70% of the students felt that AES helped them to understand the meanings of graphs in both experiments. This is also clear from the correct answer rates for Q3 and Q4 in the understanding confirmation test.
TABLEII
CONTENTS OF UNDERSTANDING CONFIRMATION TEST.
Q1 How does the velocity of the dynamics trolley change with time?
a: It increases b: It decreases c: It remains constant
Q2 How does the acceleration of the dynamics trolley change with time?
a: It increases b: It decreases c: It remains constant
Q3Which is appropriate as a graph showing the relationship between velocity and time? Choose one of the graphs, a to e, shown below.
Q4 Which is appropriate as a graph showing the relationship between acceleration and time? Choose one of the graphs, a to e, shown below.
a b c
d e
V
el
oc
ity
/
A
cc
el
er
at
io
n
Time Vel
oc
ity
/
A
cc
el
er
at
io
n
Time Velo
ci
ty
/
A
cc
el
er
at
io
n
Time
Ve
lo
ci
ty
/
A
cc
el
er
at
io
n
Time Vel
oc
ity
/
A
cc
el
er
at
io
n
Time
Q5 How does the acceleration of the dynamics trolley change when the mass of the dynamics trolley is increased?
a: It increases b: It decreases c: It remains constant
Q6 (Only experiments on slope) How does the acceleration of the dynamics trolley change when the slope angle is increased
a: It increases b: It decreases c: It remains constant
Q7 (Only experiments on horizontal rail) How does the acceleration of the dynamics trolley change when the mass on the constant acceleration device side is increased?
a: It increases b: It decreases c: It remains constant
TABLEIII
CORRECT ANSWER RATES FOR UNDERSTANDING CONFIRMATION TEST [%].(UPPER ROW:BEFORE EXPERIMENT,BOTTOM ROW:AFTER EXPERIMENT)
Q1 Q2 Q3 Q4 Q5 Q6/Q7
Horizontal 92.3 87.2 66.7 84.6 71.0 89.5
rail 100 94.9 89.7 84.6 84.2 100
Slope
97.5 82.5 82.5 82.5 33.3 94.7
IV.CONCLUSION
We reported on new features added to smart device software (AES) as support for acceleration experiments in junior high and high school and discussed the results of evaluation experiments. The evaluation experiments targeted high school students at the national institute of technology, Ibaraki College, who used AES to perform acceleration experiments on slopes and horizontal rails. Also, to quantitatively investigate the degree to which learner comprehension of velocity and acceleration was attributable to AES experiments, we administered tests of comprehension of the relations between time, velocity, acceleration, changes in acceleration under differing experimental conditions, and related topics. The results indicated some learning promotion effect on velocity and acceleration. Results of questionnaires given after the experiments further showed that AES was easy to use as experimental equipment and that it aided the comprehension of study topics and the meaning of graphs. Some students did not have enough time to address all topics, so as a future task it is necessary to consider improvements to the experimental content. Also, some students provided incorrect answers for filter processing so that we will reconsider the methods for filter processing.
ACKNOWLEDGMENT
This work was supported by JSPS KAKENHI Grant Number JP16K21409.
REFERENCES
[1] Science First web site, Recording timer 120V [Online]. Available: https://shop.sciencefirst.com/
[2] Ministry of Education, Culture, Sports, Science and Technology Japan, “Curriculum Guidelines of Junior high school (Science)”[Online]. Availavle. http://www.mext.go.jp/component
/a_menu/education/micro_detail/__icsFiles/afieldfile/2018/06/12/138 7018_5_2_2.pdf (in Japanese)
[3] Ministry of Education, Culture, Sports, Science and Technology Japan, “Curriculum Guidelines of high school (Science)”[Online]. Availavle. http://www.mext.go.jp/component/a_menu/education /micro_detail/__icsFiles/afieldfile/2018/07/13/1407073_06.pdf (in Japanese)
[4] NaRika Corporation web site, BeeSpiV. [Online]. Available: http://global.narika.jp/product/others/beespi-v
[5] T. Shiomori and Y. Takeuchi, “Research Motion of Objects by Video Camera”, Journal of the Physics Education Society of Japan, Vol.56, No.2, pp.130-131. (2008) (in Japanese).
[6] K.Watarai, “Development of Teaching Materials in the High School Physics Experiment by Use of High-Speed Cameras”, Journal of the Physics Education Society of Japan, Vol.61, No.1, pp.2-7. (2013) (in Japanese).
[7] M. Fuse, M. Suzuki, A. Minato, S. Ozawa and K. Masuda, “Development of a New Teaching Method of High-school Physics by Using Computer Video Image Analysis”, Computer & Education, Vol.13, pp.85-91. (2002) (in Japanese).
[8] H. Katsuta, “Application example of high-speed camera of smartphone for physics education in high school”, Journal of the Physics Education Society of Japan, Vol.66, No.2, p.152. (2018) (in Japanese).
[9] T. Kondo, “Measurement of spring vibration using force sensor and Arduino”, Journal of the Physics Education Society of Japan, Vol.64, No.3, pp.190-193. (2016) (in Japanese).
[10] T. Hoshino, Y. Hamamatsu, “Proposal of Support System for Science Experiments with Smartphone”, The conference on IEEJ Fundamentals and materials (2014) (in Japanese)
[11] T. Hoshino, Y. Ota, K. Tomaru and Y. Hamamatsu: “Development and Evaluation of Software for Smart Devices to Support Educational Experiments on Acceleration”, ICSItech2017, pp. 271-276 (2017).
![Fig. 8 Measured acceleration for the horizontal rail with a 50 [g] mass. Time [s]](https://thumb-us.123doks.com/thumbv2/123dok_us/9983980.1986694/6.595.82.244.62.220/fig-measured-acceleration-horizontal-rail-g-mass-time.webp)
