Service Diversification – a Qualitative and Quantitative Analysis in Mures County
Hotels
Flavia Dana Oltean, Manuela Rozalia Gabor
Petru Maior University of Tirgu Mures
Nicolae Iorga st. 1, 540080, Tirgu Mures, Mures county, Romania E-mail. [email protected], [email protected]
http://dx.doi.org/10.5755/j01.ee.27.5.14153
Service diversification is one of the most important solutions to hotel management because it has a direct influence on the improvement of profitability and competitiveness. This study investigated how service diversification is included in hotels in Mureş County (Romania) and analyzed factors typical of diversification through management decisions in the hotels comprised in the study. Therefore, this research focused on the following dimensions: determination of issues concerning hotel groups in Mures County related to service diversification; typological analysis of hotels in Mures County according to service diversification; analysis of correlations between factors that define service diversification in hotels and performance. The research features examination through total observation using a questionnaire and tests four hypothesis from international literature review. The results indicate that service diversification varies with the classification category of the hotels analyzed in the study. Factors related to diversification were grouped into three categories, which consisted of relaxation and leisure services, services related to business travel and subsidiary (auxiliary) services to accommodation services that complement existing business travel amenities. Also, the results show a positive correlation with performance indicators (respectively income and expenditure) with components of service diversification. The main findings offer valuable insights to both theoreticians and practitioners within the domestic and foreign hotel industry being the first study of this kind in Romania.
Keywords: Service Diversification, Romania, Hotel Industry, Mures County, Qualitative & Quantitative Research.
Introduction
The hotel industry is a key sector in many developed and undeveloped economies (Fraj et al., 2015, p. 31). Intense competition in the lodging industry has been well versed (Lee, 2015, pg. 115) and has led to the emphasis on factors such as service quality, quality-price ratio, service diversification, innovation and a customer-oriented focus (Cristea, 2009, p. 452). Nath et al., (2010, p. 320) suggest that the principal reason for diversification are perceived benefits associated with greater target market, utilization of unused productive capacity, risk reduction in terms of diverse portfolio of business, and capability build-up. The research in the field has not reached the consensus regarding the impact of these factors on hotel business, but what is known is that the relation between service diversification and performance has been frequently investigated in strategic management. However, there has been little academic research effort related to the hospitality industry to evaluate that correlation (Park & Jang, 2012, p. 219). To this effect, we refer to the research about the hotel industry conducted by Lee and Jang, 2007, Kitsios et al., 2009, Orfila-Sintes and Mattson, 2009, Tari et al., 2010, Nath et al., 2010, Tang and Jang, 2010, Moraru, 2011, Wang et al., 2012, Becerra et al., 2013.
Under these circumstances, we reference the findings of other studies devoted to service diversification; therefore, this research focused on three dimensions:
Determination of issues concerning hotel groups in Mures County related to service diversification;
Typological analysis of hotels in Mures County according to service diversification;
Analysis of correlations between factors that define service diversification in hotels and performance.
We also show the importance of this study due to the following reasons:
Dynamism of the hotel industry is governed by the conditional relationships within the competitive environment through the products and services it provides;
Existence of a competitive environment within the hotel industry that is focused on customer satisfaction; this condition implies complex interactions between hotel management and customers;
The industry's economic model structured so that hotels generate the largest portion of their profits from room sales (e.g., hotel lodging charges in the USA achieve profit margins exceeding 80 %) (Yeh et al., 2012, p. 941);
The strength of competitive environment wherein operate suppliers of touristic services – and implicitly hotels – is related to a strong axis regarding policy and strategy developed through the process of service supply that requires service diversification;
Continuous development of the hotel market in Romania - according to the data published by the National Institute of Statistics, tourist arrivals in hotels reached the average annual growth rate of 6.77 % during 2009–2013 and average annual growth of 20.09 % in Mures County;
Mures county represents a significant component of the national touristic supply, through the existence of a wide range of travel reasons, such as medical, dental, spa, business, conference, that drove the rise of competitiveness in the hotel industry.
research that addresses the development of service management in hotels in Mures County, wherein the following elements have been included: services supplied to the hotel unit personnel, food & beverage services, leisure services, additional services and customized services alongside managerial practices through service strategies, service quality, human resources and information technology. The aim of the study is to investigate how service diversification is included in hotels in Mures County (Romania), analyze factors typical of diversification through management decisions in the hotels comprised in the study and analyze the correlations between factors that define service diversification in hotels and performance. The research features examination through total observation using a questionnaire and tests four hypotheses from international literature review using the following statistical methods: the bivariate χ2 association test, the principal component analysis,
cluster analysis and parametric correlation. This study is required due to the fact that there are no studies at the national level, taking into account the fact that Romania is an ex-communist country, having a dynamic hospitality industry and Mures county is developed only the business tourism type.
Conceptual Framework and Hypotheses
Service Diversification in the Hotel Industry
There is a series of studies related to service diversification, most of which relate to improvement of existing services and products but also to the introduction of new services and products. Pantelescu (2009, p. 123) defines diversification as "attracting new markets, adding to the current product line, new versions that provide multiple advantages in different areas (technological, strategically, qualitative, marketing etc.)". The specialty literature has not reached a consensus regarding the diversification model applied in the service field; it is well known that diversification is associated with innovation, but it also relates to providing differentiation by creating something unique (Moraru, 2011, p. 128). However, innovation in management principles and processes has received growing academic interest (Nieves and Segarra-Cipres, 2015, p.51) and takes on two forms: incremental innovation, in response to consumer demand for improvement of existing services and directed toward well-known customers; and radical innovation, which refers to the creation of entirely new services (Moraru, 2011, p. 128 according to Bacher, 2005). According to Lovelock and Wirtz (2004), “new” is one of the most overused words in
marketing practice (Oduori, 2010, p. 3).
With regard to the specialty studies, we refer to the usage and meaning of the terms "new service development" (DNS) (Johnson et al., 2000; Fitzsimmons and Fitzsimmons, 2000; Johne & Storey, 1998) and "new product development" (DNP). The initial research in this field emphasizes that "development of new services" is based on the results of research concerning "development of some new products" (Oduori, 2010, p.3). However, the development of new services remains one of the least studied and understood topics in the literature devoted to service management, despite a significant amount of compelling research and analysis directed toward the development of new products (Menor et al, 2002, p.136). Therefore, we do not feel that this study is exhaustive considering the complexity of the chosen research field, but we believe that the results of this study are of major importance to hotel operators.
Customer loyalty is a primary goal of hotel operators (Tanford et al., 2012, p. 319), and the benefits from supplying new services (Menor et al, 2002, p. 135 according to Storey and Easingwood, 1999) enhance the profitability of existing offerings, attract new customers, improve the loyalty of existing customers, and open markets of opportunity. On the other hand, the services and facilities offered by a hotel are those features of services that lead consumers to choose one service over another (Sohravi et al., 2012, p. 97), and managers continuously attempt to improve the image of their hotels and adapt to changes in tastes and fashion by modifying the retail environments of their properties (Spielmann et al., 2012, p. 360).
Under these circumstances, we suggest that the main concerns related to service diversification in the hotel industry relate to the following:
Development and diversification of accomm-odation services,
Development and diversification of dining choices, Development and diversification of leisure facilities,
Development and diversification of additional amenities.
In foreign practice we find that rates offered at competitive prices generally include minimal services and are intended to generate higher revenue per room from services that are not included in the basic charges (Andrei et al., 2006, p.20). These services are included in and govern the diversification practices observed in the hotel industry (table 1).
Table 1 Services that Contribute to Diversification in the Hotels
Categories Facilities Description
Accommo dation services
Single, double, twin or family rooms; Business executive rooms; Standard and luxury apartments.
Fruit, brewed coffee, instant coffee, tea, sugar; Bath robes, towels, slippers; Magnetic access cards; Business services (folders, ball point pens, envelopes, writing paper, etc.).
Food&b Everage services
Conventional restaurants; Specialized restaurants; Bars; Breakfast bar; Bakeries.
Special event hosting (weddings, engagements, baptism etc.); Corporate event hosting (business dinners, company anniversaries, product promotion, etc.); Variety of food and beverage choices.
Leisure services
Spa centers; Wellness centers; Fitness centers, Gyms; Swimming pools; Sauna, and massage services; Relaxation areas; Animation; Children’s play areas; Sport centers.
Swimming lessons; Aerobics; Physical Education teacher; Physicians for various therapies; Individual programs for various medical conditions.
Additional services
Cultural and art services; Personal services; Medical services; Spaces for conventions, conferences, etc.; Retail spaces; Casinos, night clubs, etc.
Ticket booking for shows, theater, film, concerts, exhibitions, etc.; Internet access in all rooms; Hairdresser, cosmetics, laundry; Video projector, flipchart, etc.
Customized
services Customized products.
Welcome products with hotel name or logo; Gifts and souvenirs with hotel name or logo for guests.
With service diversification as the main objective, hotel unit managers can choose between varieties of extensions to standard services required by legislation in order to meet current demand. Expansion of services should take into consideration the current trends in the field governing the hotel sector and cannot necessarily make allowances for the classification categories. Therefore, the two- and three-star hotels can achieve service diversification by providing individual services such as hair stylists, manicures, wellness centers, and hosting corporate events (company anniversaries, business dinners, events related to product promotion, etc.), thus achieving the desired economic performance. Under these conditions, the following research hypotheses have been submitted for this study:
H1. There are no statistically significant differences with regard to the extent of hotel service diversification according to hotel classification category;
H2. There is a limited number of diversification-related factors implemented by hotel managers;
H3. More than 50 % of hotels in Mures County are targeted toward business travelers.
Firm Performance
In todays global marketplace, a growing number of tourism enterprises strive to increase customer satisfaction with their product and service offerings by relying on the premises that customer satisfaction is one of the most important antecedents of companies financial performance (Albayrak and Camber, 2015, p.43)
Literally speaking, the performance term (Laitinen, 2002) relates to evaluation of indicators as profit, costs and market share (Avci, et al., 2011). Rachel and Haber (2005, p. 683) state that performance can be measured both objectively and subjectively, and hotel managers have unique objectives and own methods to measure performance according to which they evaluate the success of their work. "Objective" is measured by occupancy rate per room, gross operating profit, and gross operating profit per available room per day, and "Perceptual" contains competitive performance and stakeholder satisfaction (Wang et al., 2012, p. 120).
Conceptually diversification should have a positive on firm performance as it helps the firms to achieve economies of scale, greater reach, and leverage its experience in other markets (Rumelt, 1974). However, extand literature suggests that there exists a mixt realation between diversification and firm performance (both positive and negative accordind to the context) (Nath et al., 2010, pg. 320).
Philips (1996) in its attempt to adopt multidimensional approach in evaluation of performances in hotels, uses three dimensions (Rachel & Haber, 2005, p. 683):
Efficacy: occupancy, average daily rate per room etc.,
Efficiency: profit, investment profitability etc., and Adaptability: successful introduction of some new services/products, income that is generated by introducing some new services, respectively.
Under the circumstances, we think that it is important to mention that performance of hotels represents a rather new concept in specialty studies nationally, and managers develop own methods to evaluate the performance of their
work. Therefore, we used within the research the general indicators used in evaluating performance, indicators that focus on the efficiency of work, respectively, such as: turnover for each category of activity, market share, occupancy of accommodations, value of income and value of expenditure. On the above arguments, we propose the following research hypothesis:
H.4. Implementation of service diversification in hotels is positively correlated with performance indicators
Framework considering service diversification in
Mures County
Legislation in Romania (Order of the Regional Development and Tourism Minister no. 1051/2011) outlines compulsory services for hotels to provide but also suggests additional services that hotels should offer according to their classification category. Within our research, we will not review the achievement of compulsory criteria required by regulations in effect but we will evaluate and review the main additional criteria provided by legislation. We also suggest that services included in our research relate to both basic services (accommodation, food&beverage and leisure) and additional services. The unique element is represented by service customization in hotels in Mures County. Service customization in hotels begins with the original products and services travelers should receive, and the possibility of permanent additions to available amenities based on the individual requests of travelers (Pantelescu, 2009, p. 169). Therefore, elements comprised in the study are the following:
Accommodation services: services such as room service, internet connection, satellite or cable television, LCD/LED television sets; brewed coffee, instant coffee, tea, sugar, fruits in common areas; bath robes, towels, slippers and custom stationary; magnetic access cards; air conditioning in common areas; noise free windows; office supplies (folders, pens, envelopes, paper etc.) in common areas; business executive rooms, standard apartments, and luxury apartments;
Food&beverage services: Conventional restaurants, specialized restaurants, breakfast buffets, bars, bakeries; special event hosting (weddings, engagements, baptisms, etc.); corporate event hosting (company anniversaries, business dinners, product promotions, etc.); diversification of food&beverage and beverage choices including 24-hour availability of takeout food&beverage;
Leisure services: Spas, wellness centers, fitness centers, massage services, relaxation areas, children’s play areas, animation, sports centers, and physical therapy and recovery centers;
Customized services: Products intended to welcome visitors, including souvenirs with hotel name and logo.
Methodology
Regardless of the conditions and manner of information, the direct research methods are significantly different with regard to scientific accuracy in the group of scientific background methods (Olteanu et al., 2004, p. 114). In most cases, inquiries through visits to the homes of participants were used (Isaic-Maniu, 2001, p. 185). Under these conditions, we note that the survey is one of the most used data collection methods in quantitative research; therefore, this study features examination through total observation (exhaustive) using a questionnaire. The surveyed population consisted of 42 hotels located in Mures County in all classification categories: 5 stars – 1 hotel,4 stars – 11 hotels, 3 stars – 22 hotels, 2 stars – 7 hotels and 1 star – 1 hotel, using data acquired from the "List of tourist welcome structures with classified accommodation functions" report published by the National Tourism Authority. A significant stage of the research taken into account was pretesting of the questionnaire, which took place in August 2014, during which a management representative from each hotel classification category located in Tirgu-Mures, a total of 15 properties, was chosen to pretest the survey; as a result of the observations from this exercise, the time allotted to participants to complete the questionnaire and other variables were modified.
The measuring scale affects the amount of information contained in the data and indicates the most suitable statistical processing and analysis methods (Anderson et al., 2012, p.6). This study used the Likert ordinal scale through which respondents were asked to describe the extent of variable significance using a scale from 1 (not important) to 5 (very important).
In order to test the research hypotheses, the statistical methods used are as follows:
The bivariate χ2 association test (a non-parametric
significance test), frequently used in quantitative research; Principal Component Analysis (PCA). When using the PCA, the following stages should be met (Sohrabi et al., 2012, p. 100, after Costello and Osborne, 2005): the extraction of the initial factors, the rotation to a terminal
solution and the selection of the number of factors. By using the PCA, the aim is to re-dimension a system described through various more or less interdependent variables, at a representation that assumes a low number of factor independent variables, (Isaic-Maniu et al., 2003, p.190).
Cluster Analysis, the methodological aim of which is to assign elements to different groups;
Parametric correlation (Pearson Coefficient). Every element should be as similar as possible to the other elements included in its assigned group, compared with the elements outside the group (Isaic-Maniu, 2001, p. 188). In this study the main components that resulted from applying the PCA methodology were the basis of the cluster analysis application. Based on the hotel features evaluated, the main “clusters”, or hotel types, were grouped by main component. Because the results of the analysis are applicable to qualitative, ordinary data, the cluster analysis shows the major advantage fields for management; thus classifying respondents in relation to their opinions related to specific characteristics.
Data were derived through the use of SPSS 17.0 (Statistical Packages for Social Sciences) and Microsoft Office Excel software.
Results and Discussion
In order to verify the connection between the extent of diversification of services offered to guests by the hotels comprised in the study and classification categories, we used the bivariate χ2 association test for each category of services
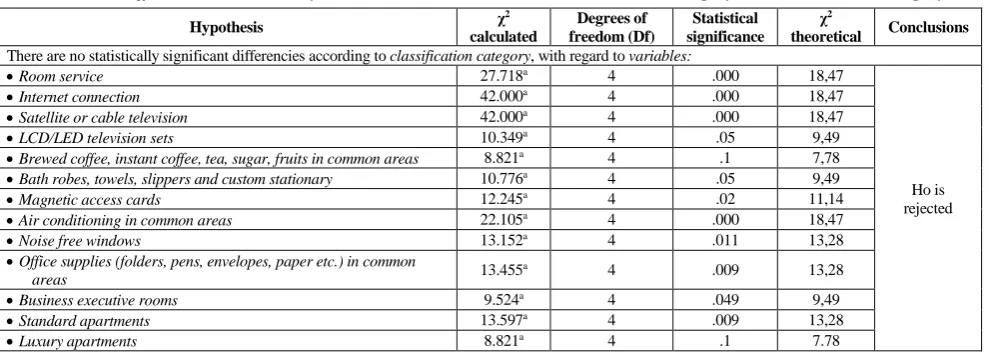
provided within each hotel (accommodations, food&beverage, leisure, additional and customized services). According to table 2 we note that there are statistically significant differences for all services related to accommodation services - room service; internet connection; satellite or cable television; LCD/LED television sets; brewed coffee, instant coffee, tea, sugar, fruits in common areas; bath robes, towels, slippers and custom stationary; magnetic access cards; air conditioning in common areas; noise free windows; office supplies (folders, pens, envelopes, paper etc.) in common areas; business executive rooms, standard apartments, and luxury apartments - consistent with the hotel classification category, that achieve diversification.
Table 2
Results of the χ2 test in Order to verify Association between Accommodation Services Category and Classification Category
Hypothesis χ
2
calculated
Degrees of freedom (Df)
Statistical significance
χ2
theoretical Conclusions
There are no statistically significant differencies according to classification category, with regard to variables:
Room service 27.718a 4 .000 18,47
Ho is rejected
Internet connection 42.000a 4 .000 18,47
Satellite or cable television 42.000a 4 .000 18,47
LCD/LED television sets 10.349a 4 .05 9,49
Brewed coffee, instant coffee, tea, sugar, fruits in common areas 8.821a 4 .1 7,78
Bath robes, towels, slippers and custom stationary 10.776a 4 .05 9,49
Magnetic access cards 12.245a 4 .02 11,14
Air conditioning in common areas 22.105a 4 .000 18,47
Noise free windows 13.152a 4 .011 13,28
Office supplies (folders, pens, envelopes, paper etc.) in common
areas 13.455
a 4 .009 13,28
Business executive rooms 9.524a 4 .049 9,49
Standard apartments 13.597a 4 .009 13,28
Rejection of this hypothesis leads to the conclusion that managerial perceptions in relation to service diversification vary according to the classification category of the hotels included in the study. This conclusion is valid if we consider that the variables that form the accommodation services category contribute toward diversification of business travel related services and that the traveler category takes into account all hotel amenities (internet connection, office supplies, etc.).
The following variables surveyed by application of the χ2 test are found in the food&beverage services category. According to table 3, we observe that, significant values of χ2 statistics have been registered for only four variables included in the food&beverage services category, results
that lead to rejection of the null hypothesis and indicate that there are differences according to hotel classification category; these variances include bars, special event hosting, corporate event hosting and diversification of food&beverage and beverage choices including 24-hour availability of takeout food&beverage. For all other variables that make up the food&beverage services category, the null hypothesis is accepted; therefore, these types of services do not significantly contribute toward diversification based on classification category. The conventional restaurant variable has not registered statistical values because it has been validated by all hotels included in the research.
Table 3
Results of the χ2 test in Order to Verify Association between Food Services Category and Classification Category
Hypothesis χ
2
calculated Df
Statistical significance
χ2
theoretical Conclusions
There are no statistically significant differencies according to the classification category, with relation to variables:
Bars 14.343a 4 .010 13,28
Ho is rejected
Special event hosting 15.932a 4 .003 9,49
Corporate event hosting 15.371a 4 .010 13,28
Diversification of food and beverage choices including 24-hour
availability of takeout food 20.952
a 4 .000 18,47
The third category of variables surveyed by the χ2 test
are represented by components of the leisure services category. Variables that registered significant values (table 4) are: spas, wellness centers, massage services, relaxation areas and physical therapy and recovery centers. The factors that do not significantly differentiate hotels according to classification category are fitness centers, children’s play areas, animation and sport centers. This result can be
explained by the fact that very few hotels have play spaces, animation and sport centers because of the following two reasons: these facilities are not dedicated specifically to business travelers or tourists who travel for treatment, and second, in general, the hotels that have spas, wellness centers or treatment centers generally do not also provide sport centers or fitness centers.
Table 4
Results of the χ2 test in Order to Verify the Association the Leisure Services Category and the ClassificationCategory
Hypothesis χ
2
calculated Df
Statistical significance
χ2
theoretical Conclusions
There are no statistically significant differencies according to the classification category, as regards variables:
Spas 9.192a 4 .010 7,78
Ho is rejected
Wellness centre 9.095a 4 .010 7,78
Massage services 12.502a 4 .020 11,14
Relaxation areas 10.125a 4 .038 9,49
Physical therapy and recovery centre 15.932a 4 .003 9,49
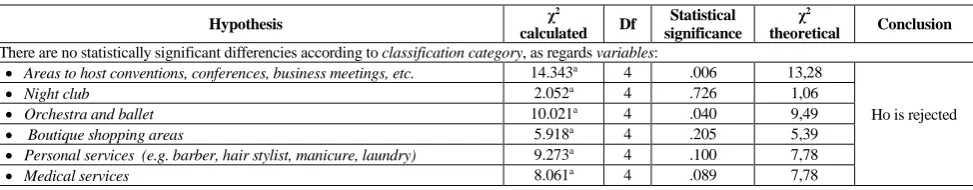
The fourth category of variables surveyed by means of the χ2 test is represented by components of the additional services category. Table 5 shows the results and illustrates that there are statistically significant differences for almost all services, with the exceptions of the casinos and pay television variables. This result can be confirmed by virtue of the fact that the casinos variable has not been validated by
any participant and that the pay television variable has been validated by only 4.7 % of respondents. Hotel managers who evaluated the opinions of travelers concerning their preferences in relation to additional services found that a very low percentage of guests prefer these service categories.
Table 5
Results of the χ2 test in Order to Verify the Association between Additional Services Category and Classification Category
Hypothesis χ
2
calculated Df
Statistical significance
χ2
theoretical Conclusion
There are no statistically significant differencies according to classification category, as regards variables:
Areas to host conventions, conferences, business meetings, etc. 14.343a 4 .006 13,28
Ho is rejected
Night club 2.052a 4 .726 1,06
Orchestra and ballet 10.021a 4 .040 9,49
Boutique shopping areas 5.918a 4 .205 5,39
Personal services (e.g. barber, hair stylist, manicure, laundry) 9.273a 4 .100 7,78
Hypothesis χ 2
calculated Df
Statistical significance
χ2 theoretical
Ho is rejected
The option for customer to pay for services with credit cards 42.000a 4 .000 18,47
wireless internet access in all areas 23.100a 4 .000 18,47
Video projectors 9.174a 4 .100 7,78
Projection screens 9.174a 4 .100 7,78
Fax and copier machines 10.500a 4 .050 9,48
Teleconferences 6.818a 4 .200 5,39
Flipcharts 6.873a 4 .200 5,39
Direct international access telephones 7.416a 4 .200 5,39
Computer access and voicemail 42.000a 4 .000 18,47
Voicemail 21.955a 4 .000 18,47
Customized services represent a very important element in service diversification, and the results of applying the χ2 test over the customized services category and hotel unit classification category (table 6) indicate that there are
statistically significant differences for all services that are included in the customized services category. These findings indicate that service diversification is distinguished according to the hotel unit classification category.
Table 6
Results of the χ2 test in Order to Verify the Association between Customized Services Category and Classification Category
Hypothesis χ
2
calculated Df
Statistical significance
χ2
theoretical Conclusion
There are no statistically significant differencies in line with classification category, as regards variables:
Products intended to welcome visitors 5.621a 4 .229 5,39 Ho is rejected
Souvenirs with hotel name and logo 7.848a 4 .097 7,78
In conclusion, Hypothesis 1 of the research has been partly invalidated, as there are very few variables that show statistically significant differences according to classification category.
In completing these results, we felt that it was necessary to thoroughly study the quantitative analysis by proposing Hypothesis 2: there is a limited number of diversification-related factors implemented by hotel managers. This hypothesis was tested by applying the principal component analysis method (PCA) across all variables that describe the diversification services in hotels in Mures County. Because the method is intended to reduce a large number of variables to a smaller number of new variables, its calculations have been iterated five times; this process was taken in order to retain only those variables having a major contribution to diversification in the survey. Contribution is evaluated based on correlation coefficients automatically calculated by the SPSS software.
The final assessment was conducted on the 10 variables that resulted from the previous analysis, and pointed toward 3 principal components which explain 79.73% of the initial variance. The remaining variables were room service, internet connection, magnetic access cards, business executive rooms, standard apartments, luxury apartments, spas, wellness centers, massage services and relaxation areas.
Values of correlation coefficients related to the final evaluation are shown in the correlation matrix in table 7, and resulted in the following observations: high intensity direct correlations were indicated between the standard apartments and business executive rooms (0.716) variables, between the spas and the wellness centers variables (0.876), between the massage services (0.888) and relaxation areas (0.712) variables, between the wellness centers and massage services variables (0.877), and between the massage services and relaxation areas variables (0.790).
Medium to high intensity direct correlations were indicated between the internet connection and room service variables (0.528), between the magnetic access cards variable and the business executive rooms (0.662) and standard apartments (0.553) variables, between the business executive rooms and the luxury apartments (0.608) variables, between the standard apartments and the luxury apartments (0.612) variables.
The remaining variables have been grouped among three principal components that in total comprise 79.73 % of total variance - the first component explains 35 % of variance, the second factor accounts for 28 % of variance, and the third element represents 17 % of variance.
Table 7
Correlation Matrix for the 10 Final Remaining Variables
R o o m se rv ic e In te rn et co n n ec ti o n M a g n et ic a cc es s ca rd s B u si n es s ex ec u ti v e ro o m s S ta n d a rd a p a rt m en ts L u x u ry a p a rt m en ts S p a s W el ln es s ce n te rs M a ss a g e se rv ic es R el a x a ti o n a re a s
R
o
o
m
se
rv
ic
e
In
te
rn
et
co
n
n
ec
ti
o
n
M
a
g
n
et
ic
a
cc
es
s
ca
rd
s
B
u
si
n
es
s
ex
ec
u
ti
v
e
ro
o
m
s
S
ta
n
d
a
rd
a
p
a
rt
m
en
ts
L
u
x
u
ry
a
p
a
rt
m
en
ts
S
p
a
s
W
el
ln
es
s
ce
n
te
rs
M
a
ss
a
g
e
se
rv
ic
es
R
el
a
x
a
ti
o
n
a
re
a
s
Standard apartments 1.000 .612 .247 .318 .343 .333
Luxury apartments 1.000 .266 .301 .230 .294
Spas 1.000 .876 .888 .712
Wellness centers 1.000 .877 .659
Massage services 1.000 .790
Relaxation areas 1.000
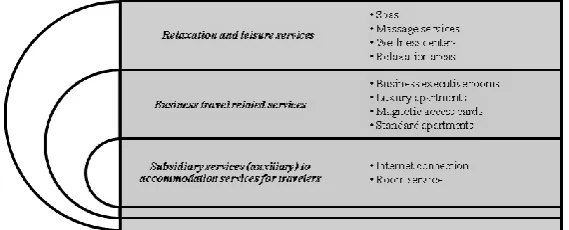
The group of initial variables related to the three principal components are shown in the following list and in table 8:
Principal component 1 (PC1), consists of the variables spas, wellness centers, massage services and relaxation areas and is referred to as relaxation and leisure services; Principal component 2 (PC2), consists of the variables
business executive rooms, luxury apartments, magnetic
access cards and standard apartments and is denoted business travel related services; and
Principal component 3 (PC3), consists of the internet connection and room-service variables and is designated subsidiary services (auxiliary) to accommodation services for travelers.
Table 8
Rotated Component Matrix
Variables Components
1 2 3
Spas .940
Massage services .938
Wellness centers .897
Relaxation areas .789
Business executive rooms .827
Luxury apartments .813
Magnetic access cards .774
Standard apartments .773
Internet connection .915
Room service .728
The remaining variables are those for which the χ2 test
has invalidated the null hypothesis, and as a result, diversification varies according to hotel classification category.
The results of the PCA application acknowledges hypothesis 2 - after several iterations the 51 initial variables that describe diversification services of hotels in Mures County have been reduced to three new factors designated as relaxation and leisure services, business travel related services and subsidiary services (auxiliary) to accommodation services that complement existing business travel related services (figure 1). Based on these indicators,
we suggest that this type of diversification is related to the business and spa travel markets, which are the primary reasons for travel in Mures County. We also note that the remaining variables, for which there are factors typical to diversification, are associated with category three-, four- and five-star hotels.
In order to survey the groups of hotels corresponding to each classification category, we further apply the cluster analysis to the principal components (PC1, PC2 and PC3). To this end, we propose Hypothesis 3: More than 50 % of the hotels comprised in the study are targeted toward business travelers.
In order to establish the number of clusters in this research, we first applied the hierarchical cluster analysis. Based on the results we observe that hotels are grouped between two clusters.
According to the cluster analysis results (table 9) we observe the following aspects:
Cluster 1 is defined by principal component 1 and is not defined by principal component 2; i.e., cluster 1 is associated with the relaxation and leisure services category and is not related to the business travel related services factor. Clusters derived from these components are statistically significant according to the results of ANOVA analysis. We also indicate that there are nine hotels grouped into this cluster that are classified as category three- and four-star properties; consequently, there are nine hotels in Mures County dedicated to relaxation and leisure tourism and not targeted toward business travelers. The hotels grouped in cluster 1 include Black Lord, Business, Ciao, Danubius, Laguna, Perla, President, Marion and Plaza; this grouping can be explained by the fact that these hotels have recently entered the hotel market of Mures County and understand the importance of providing amenities such as wellness centers, spa centers and massage services to domestic and foreign travelers who increasingly seek relaxation and entertainment (a strategy adopted in order to
control seasonal effects). This cluster presents the feature that is also defined complementarily by the principal component CP3 (services subsidiary to accommodation services) and includes internet connection and room service.
Cluster 2 is defined by principal component 2 and is different from principal component 1; i.e., cluster 2 is associated with business travel related services and is unrelated to the relaxation and leisure services segment. According to the results of ANOVA analysis, cluster 2 is statistically significant for the three principal components, and hotels found in this cluster are classified as 3-, 4- and 5-star properties. Therefore, we note that in Mures County there are 23 hotels that are dedicated to business travel and are not focused on the relaxation and leisure travel market. Hotels grouped in cluster 2 are Alesia, Apollo, Arena, Binder Bubi, Casa Wagner, Cavaler, Concordia, Denis, Everest, Grand, Helvetia, Iris, Korona, Poenița, Premier, Rex, Sabis, Sandoria, Transilvania, Darina, Concrete and Valea Regilor. Most of these properties are located in the central areas of the cities or the transit areas of the cities, which explains their inclusion in the business travel related services segment that provides amenities such as business executive rooms, luxury apartments, magnetic access cards and standard apartments.
Table 9
Results of Custer Analysis According to Principal Components
Final Clusters ANOVA
Cluster 1 Cluster 2 Cluster Error
F-test
Statistical significance
Mean square Df Mean square Df
PC 1 .80525 -.31510 8.119 1 .763 30 10.646 .003
PC 2 -.75081 .29379 7.059 1 .798 30 8.845 .006
PC 3 .55637 -.21771 3.876 1 .904 30 4.287 .047
In conclusion, hypothesis 3 is acknowledged, as 55 % of all hotels included in the study are targeted toward business travelers and transient tourism; these 23 hotels account for 66% of the total number of the three-, four- and five-star properties evaluated in the research.
In order to test hypothesis 4 regarding the relation between the principal components (PC1, PC2 and PC3) and performance indicators, we used the Pearson parametric correlation (table 10).
The results emphasize the fact that only for the following variables, values are statistically significant for the study: low intensity direct correlation (p-value=0,05) between subsidiary services and occupancy (Pearson coefficient= 0.370), subsidiary services and market share (Pearson coefficient= 0.353), business travel related services and market share (Pearson coefficient= 0.355); medium intensity direct correlation (p-value=0,01) between:
Table 10 Results of Correlation
Occupancy
Turnover for accomodation
services
Turnover for food&beverage
services
Turnover for other
services
Market
share Income Expenditure
Relaxation and leisure services .253 .121 .132 .164 .231 .458** .513**
Business travel related
services .250 .293 .188 .261 .355
* .544** .541**
Subsidiary services (auxiliary) to
accommodation services for travelers .370
* .240 .416* .284 .353* .023 -.041
Occupancy 1 .876** .793** .776** .736** .572** .500**
Turnover for accomodation services 1 .751** .776** .768** .661** .598**
Turnover for food&beverage services 1 .776** .736** .521** .472**
Turnover for oher services 1 .840** .616** .571**
Marketshare 1 .674** .618**
Income 1 .969**
relaxation and leisure services and income (Pearson coefficient= 0.458), relaxation and leisure services and expenditures (Pearson coefficient= 0.513), business travel related services and income (Pearson coefficient= 0.544), business travel related services and expenditure (Pearson coefficient= 0.541), subsidiary services and turnover (Pearson coefficient= 0.416 and p-value=0,02).In conclusion, hypothesis 4 is partially supported, only for income and expenditures there are medium intensity correlation with components PC1 and PC2 (relaxation and leisure services; business travel related) and for the third component PC3 (subsidiary services) there are low intensity correlation with performance indicators (occupancy, turnover for food & beverage and market share).
Conclusions
and LimitsGiven the fierce competitive environment in the hotel sector, managers should devote significant effort to incorporate service diversification into their management practices in their effort to achieve desired operating results.
Since the beginning of the 1980s, diversification has been considered by researchers as a governing factor in a firm’s operations, contributing toward the development of performance indicators. The relationship between diversification and performance has been surveyed mostly by strategic management researchers, but despite the improvements provided to this field, theoretical arguments and empirical results remain unclear (Park & Jang, 2012). As regards to the hotel industry, studies by Lee and Jang, 2007; Tang and Jang, 2010; Park and Jang, 2012 are among the few that focus on diversification of services. Therefore, this study complements the existing research in the field.
This study emphasizes the connection between the size of service diversification (for all identified segments of hotel services; namely, accommodation, food&beverage, leisure, additional and customized) and classification category of hotels included in the analysis. The results show that managerial perception in relation to service diversification varies according to hotel classification category, and a very low number of services does not progressively contribute toward offering new amenities, such as in food&beverage services (conventional restaurants, specialized restaurants and breakfast bars in hotel lobbies), or in leisure services (children’s play areas, animation and sports centers). Secondly, the study has identified the factors typical of service diversification implemented by hotel managers. The 51 elements that initially describe diversification services in hotels in Mures County, have been reduced to three new factors - relaxation and leisure services, business travel services and subsidiary services (auxiliary) to accommodation services that complement business travel related services. We also mention that the remaining variables for which there are factors typical to diversification are associated with hotels classified as three-, four- or five-star properties.
In conclusion, 55 % of all hotels included in the study are dedicated to the business and transient travel sectors, and account for 66 % of the three-, four- and five-star hotels evaluated in the study. The results of the analysis are relevant to practitioners, as service diversification is
important and increases the ability of hotels to attract customers, enhance reputation and improve performance.
Regarding the relationship between diversification and firm performance we conclude that is not a strength relationship between them. Our results are consistent with empirical literature which highlights that not all firms improve their performance through diversification. On the other hand, extant literature suggests that there exist a mixed relation between diversification and firm performance (both positive and negative according to the text) (Nath et al., 2010). Complementary, our results confirm the results of Park and Jang, 2012 that prove that diversification could affect firm performance (medium correlation between components PC1 and PC2 and income) but firm performance might also influence diversification (medium relationship between components PC1 and PC2 and expenditure). Due to the fact that the indicators included in the study, i.e. revenue and expenditure, have recorded the correlations medium intensity with PC1, PC2 and PC3 indicates that the hotel market in Romania is oriented toward the efficiency and not toward innovation; also in the international literature the service diversification is associated with innovation. This highlights the particularity of the Romanian hotel industry oriented for short-time strategies, proving the managerial orientation toward incremental innovation rather than on radical innovation. The fact that the services that make up the PC1 (relaxation and leisure services), specific to new hotels entrants on the market are correlated with performance indicators (income and expenditure) shows that the strategy adopted by them is oriented toward attracting new market segments, respectively attracting residents in order to combat the effects of tourism seasonality. Also, the results of this study show that Romanian managers do not have an “objective” perception of the performance but a “perceptual” one for competitive performance and stakeholder’s satisfaction.
Under these conditions, we should also address the limitations of the research. The study is exploratory, and the observed and surveyed population included only 42 hotels; therefore, the relevance of the findings should be considered carefully. Additionally, service diversification in the hotel industry is an extremely complex research field; the current study that is focused on service diversification is not exhaustive and can be improved, developed and perfected within the dynamic environment of the research area. Finally, we can conclude:
the surveyed population is small-sized, and as a result, we can decide to include much more hotels in our future research from several geographical areas of the country because studies concluded that geographic boundary among hotels is conditional on product/service differentiation (Lee, 2015);
our study include one hotel pertaining to a chain hotels, hence the ownership of hotels should be analyzed in the future in order to indicate if the implementation of diversification is different in hotels pertaining to an international group (as international diversification is separated studied in literature);
References
Albayrak, T., & Caber, M. (2015). Prioritisation of the hotel attributes according to their influence on satisfaction: A comparison of two techniques. Tourism Management, 46, 43–50. https://doi.org/10.1016/j.tourman.2014.06.009 Anderson, D.R., Sweeney, D.J., & Williams, T.A. (2012). Statistics for Business and Economics, eleventh edition,
South-Western, Cengage Learning, USA.
Andrei, R., Copetchi, M., & Dragnea, L. (2006). Operational techniques in tourism activity, Ed. Ericson, Bucharest. Avci, U., Madanoglu, M., & Okumus F. (2011). Strategic orientation and performance of tourism firms: Evidence from a
developing country. Tourism Management, 32(1), 147–157. https://doi.org/10.1016/j.tourman.2010.01.017 Baker, M., & Hart, S. (1999). Product Strategy and Management, Prentice-Hall, Hemel Hempstead.
Becerra, M., Santalo, J., & Silva, R. (2013). Differetiation, competition, and pricing strategies in the Spanish hotel industry. Tourism Management, 34, 71–79. https://doi.org/10.1016/j.tourman.2012.03.014
Cooper, R. G., & Kleinschmidt, E. J. (1991). New product processes at leading industrial firm. Industrial Marketing Management, 20 (2), 137–147. https://doi.org/10.1016/0019-8501(91)90032-B
Cristea, A. A. (2009). The Reasssesment of the Service Quality System within the Romanian Hotel Industry – a Premise for Increasing the Competition of the Tourist Offer. Amfiteatru Economic, XI(26), 451–461.
Fitzsimmon, J. A., & Fitzsimmons, M. J. (2006). Services Management: Operations, Strategy, Information Technology, fifth edition, New York: McGraw – Hill Irvin.
Fraj, E., Matute, J., & Melero, I. (2015). Environmental strategies and organizational competitiveness in the hotel industry: The role of learning and innovation as determinants of the environmental success. Tourism Management, 46, 30–42. https://doi.org/10.1016/j.tourman.2014.05.009
Isaic-Maniu, Al., Voda, V. G., Wagner, P., Pecican, E., & Stefanescu, D. (2003). Dictionary of general statistics, Ed. Economica, Bucharest.
Johne, A., & Storey, C. (1998). New service development: a review of literature and annotated bibliography. European Journal of Marketing, 32, 184–251. https://doi.org/10.1108/03090569810204526
Johnson, S. P., Menor, L. J., Chase, R. B., & Roth, A. V. (2000). A critical evaluation of the new services development process: integrating service innovation and service design, in Fitzsimmons, J.A. and Fitzsimmons, M.J. (Eds), New Service Development, Creating Memorable Experiences, Sage Publications, Thousand Oaks, CA. https://doi.org/ 10.4135/9781452205564.n1
Jolibert, A., & Jourdan, Ph. (2006). Marketing research – methodes de recherche et d'etudes en marketing, Ed. Dunod, Paris.
Kitsios, F, Doumpos, M., Grigoroudis, E., & Zopounidis, C. (2009). Evaluation of new service development strategies using multicriteria analysis: predicting the success of innovative hospitality services. Operational Research, 9, 17– 33. https://doi.org/10.1007/s12351-008-0025-3
Laitinen, E. (2002). A dinamic performance measurement system: evidence from small Finnish technology companies, Scandinavian Journal of Management, 18(1), 65–99. https://doi.org/10.1016/S0956-5221(00)00021-X
Lee, M. J., & Jang, S. (2007). Market diversification and financial performance and stabil- ity: a study of hotel companies. International Journal of Hospitality Management, 26(2), 362–375. https://doi.org/10.1016/j.ijhm.2006.02.002 Lee, S.K. (2015). Quality differentiation and conditional spatial price competition among hotels. Tourism Management,
46,114–122. https://doi.org/10.1016/j.tourman.2014.06.019
Lovelock, C., &Wirtz, J. (2004). Services Marketing: People, Technology and Strategy, fifth edition, Pearson Prentice Hall, New Jersey Ministry of Regional Development and Public Administration, available on-line http://www.mdrap.ro.
Menor, L. J., Tatikonda, M. V., & Sampson, S. E. (2002). New service development: areas for exploitation and exploration. Journal of Operations Management, 20(2), 135–157. https://doi.org/10.1016/S0272-6963(01)00091-2 Moraru, A. D. (2011). Development and diversification of services - An approach at tourism level in Romania. Annale
Universitatis Apulensis Series Oeconomica, 13(1), 127–133.
Nath, P., Nachiappan, S., & Ramanathan, R. (2010). The impact of marketing capability, operation capability and diversification stratey on performance: A resource-based view. Tourism Management, 39, 317–329.
National Institute of Statistics, available on-line www.insse.ro
Oduori, F.N. (2010). New service development: strategy and process in the hospitality sector in Kenya, 19th EDAMA Summer Academy, Soreze, France. Available from internet: http://www.edamba.eu/userfiles/file/Oduori%2 0EDAMBA%20INITIAL%20RESEARCH%20PROPOSAL.pdf
Olteanu, V., Epure, M., & Bondrea, A. (2004). Marketing research, Ed. Fundației Romania de Maine, Bucharest.
Orfila-Sintes, F., & Mattson J. (2009). Inovation behavior in the hotel industry. The InternationalJournal of Management Science, Omega, 37(2), 380–394. https://doi.org/10.1016/j.omega.2007.04.002
Pantelescu, A. M. (2010). Diversification and personalization of tourism services in the context of economic globalization, Ed. ASE, Bucharest.
Park, K., & Jang (Shawn), S. (2012). Effect of diversification on firm performance: Application of the entropy measure. International Journal of Hospitality Management, 31(1), 218–228. https://doi.org/10.1016/j.ijhm.2011.03.011 Rachel, A., & Haber, S. (2005). A three-sector comparison of the business performance of small tourism enterprises: an
exploratory study. Tourism Management, 26(5), 681–690. https://doi.org/10.1016/j.tourman.2004.03.017
Sohrabi, B., Vanani, I. R., Tahmasebipur, K., & Fazli, S. (2012). An exploratory analysis of hotel selection factors: A comprenhesive survey of Tehran hotels. International Journal of Hospitality Management, 31(1), 96–106. https://doi.org/10.1016/j.ijhm.2011.06.002
Spielmann, N., Laroche, M., & Borges, A. (2012). How service seasons the experience: Measuring hospitality services capes. International Journal of Hospitality Management, 31(2), 360–368. https://doi.org/10.1016/j.ijhm.2011.06.001 Tanford, S., Raab, C., & Kim, Y. S. (2012). Determinants of customer loyalty and purchasing behavior for full-service
and limited-service hotels. International Journal of Hospitality Management, 31(2), 319–328. https://doi.org/10.1016/ j.ijhm.2011.04.006
Tajeddini, K. (2011). Customer orientation, learning orientation, and new service development. An empirical investigation of the swiss hotel industry. Journal of Hospitality&Tourism Research, 35(4), 437–468. https://doi.org/10.1177/1096 348010380599
Tang, C., & Jang, S. (2010). Does international diversification discount exist in the hotel industry?. Journal of Hospitality and Tourism Research, 34(2), 225–246. https://doi.org/10.1177/1096348009350617
Tari, J. J., Claver-Cortes, E., Pereira-Moliner, J., & Molina-Azorin, J. F. (2010). Levels of quality and environmental management in the hotel industry: Their joint influence on firm performance. International Journal of Hospitality Management, 29(3), 500–511. https://doi.org/10.1016/j.ijhm.2009.10.029
Wang, C. H., Chen, K. Y., & Chen, S. C. (2012). Total quality management, market orientation and hotel performance: The moderating effects of external environmental factors. International Journal of Hospitality Management, 31(1), 119–129. https://doi.org/10.1016/j.ijhm.2011.03.013
Wearne, N., & Baker, K. (2002). Hospitality Marketing in the e- Commerce Age, Second Edition, Pearson Education Australia.
Yeh, C. Y, & Chen, C. M. (2012). Business diversification in the hotel industry: a comparative advantage analysis. Tourism Economics, 18(5), 941–952. https://doi.org/10.5367/te.2012.0152