Vol.8 (2018) No. 2
ISSN: 2088-5334
A Research Framework for Data Envelopment Analysis with Upper
Bound on Output to Measure Efficiency Performance of Higher
Learning Institution in Aceh Province
D. Abdullah
*1, Tulus
*, S. Suwilo
*, S. Efendi
*, M. Zarlis
*, H. Mawengkang
* *Department of Computer Science, University of Sumatera Utara, Jalan Universitas No. 9 A, Medan, 20155, Indonesia E-mail: [email protected]
Abstract— The higher education system in Indonesia can be considered not only as an important source of developing knowledge in the country but also could create favourable living conditions for the country. Therefore, it is not surprising that enrollments in higher education continue to expand. Data envelopment analysis (DEA) is a method to evaluate the technical efficiency of production units which have multiple input and output. The higher learning institution considered in this paper is Min Aceh province of Indonesia. This research framework of this research is DEA, with the bounded output. Accordingly, we present some important differences in efficiency performance of higher education institute. Finally, we will discuss the effort from these departments to become efficient.
Keywords— data envelopment analysis; efficiency; higher education; performance measurement; upper bound
I. INTRODUCTION
Analysis of efficiency in Engineering and Economics traditionally done using the classical efficiency ratio based on input and output weights for all Decision Making Units (DMU) that is being evaluated [1]. The benchmarking process is a process for measuring a performance that is expected to improve efficiency in the implementation of activity [2] and can also be used to formulate performance standards that can support organizational growth [3]. Farrel in [4] proposes a method that can measure efficiency by using multiple outputs and inputs called relative efficiency, by calculating the ratio of the weight of the output sum and the weight of the input sum. Charnes, Cooper, and Rhodes in [5] developed the Farrel [4] idea to develop a method for evaluating the relative efficiency of the Decision Making Unit (DMU) set. Charnes, Cooper, and Rhodes have proposed The Model for Measurement of DEA Efficiency [5], known as DEA Charnes, Cooper, and Rhodes (DEA CCR) and has been used by some researchers for the measurement of relative efficiency by using DEA. Eskelinen [6] uses the DEA CCR Model for efficiency measurement in a retail bank. Lin and Chen [7] have used DEA CCR to measure the relative efficiency of capital and resource placement. Researchers have applied the DEA model to address corporate, regional and national sustainability issues as well as those related to the supply chain [8].
DEA has become one of the most appropriate methods for comparing the various Decision Making Units (DMU) associated with public services such as universities [9]. There is currently no performance measurement process undertaken either by the government for the higher education level in Aceh Province. Higher Education has a huge role in improving the quality of human life. In Indonesia, universities as institutions of higher education have a great responsibility to improve the quality of life of the community, to develop the welfare of the state and to increase scientific knowledge. For this reason, the Government of Indonesia has sought to raise funds to support the education process. It is common in the higher education sector in Indonesia to gain some financial support from public funding, especially from the cost of student education. The same situation also occurred in the existing universities in the province of Aceh, Indonesia.
number of students. Similar research has previously been conducted by Johnes and Yu [12] using DEA method to measure relative efficiency by researching 109 colleges in China in 2003 and 2004. In their research, Impact measurements and research productivity were made as output Variables and as input variables used the number of teaching staff, the number of graduates, capital, and resources.
In general Data Envelopment Analysis, the data, in general, is assumed to be non-negative with no specific limitations. However, some cases require some restrictions on the data [13]. Cooper et al. assumed that each DMU has a range of values for each input and output measurement. The rationale is that each DMU has limits for input and output [14]. It uses lower bounds input and upper bounds output to define the limits of efficiency measurement [14]. Branda suggests a DEA-oriented method of studying the relationship between input and output [15].
Wu et al. have examined that an unexpected number of outputs may arise in the form of a deviation of the resulting output, based on the existing input parameters, if there is no limit to the output [16]. This is seen in the study by Smirlis, Maragos, Despotis conducted a study on the efficiency of school performance in Greece using the lower bound on the input and upper bound on the output, where an inefficient Decision Making Unit (DMU) can occur [17]. The primary constraint when establishing bounded on input and output based on the results of research conducted by Wei and Wang is the presence of imprecise data [18].
Research conducted by experts so far there has been no research that discusses the upper bound output to fixed input. Where, for reasons of the quality of college performance efficiency measurement, the input bound is assumed to be fixed, and the output will increase proportionally along with the utilization of the existing input. Fixed input is caused by the addition of resources at the university especially for the input of the teaching staff, and the number of students has a quota set by the Ministry of Research, Technology and Higher Education which cannot be added, but who want to increase is an increase in output (Upper bound on output). The Data Envelopment Analysis (DEA) with Upper Bound on Output is aimed at measuring the efficiency of university performance in Aceh using two main inputs: Number of Lecturers and Number of Students as well as 2 (two) main outputs: Number of Research And Number of Graduates. This research is needed to describe the performance efficiency level of each university.
II. MATERIAL AND METHOD
Measurements and Comparison are necessary for the Benchmarking process to achieve higher performance. Benchmarking in this research is to measure the relative performance efficiency. Relative efficiency is the measurement of efficiency for multiple inputs and multiple outputs, which can be defined as the ratio of total weighted output divided by total weighted input / total weighted input. [16] have examined that an unexpected number of outputs may arise in the form of the resulting output deviation, based on the existing input parameters, if there is no limit to the output. Research conducted by experts so far there has been
no research that discusses the upper bound output to fixed input.
Research conducted by experts so far there has been no research that discusses the upper bound output to fixed input. Where, for the reason of the quality of college performance efficiency measurement, the input bound is assumed to be fixed, and the output will increase proportionally along with the increase of the explored input. Data Envelopment Analysis (DEA) with Upper Bound on Output is aimed at measuring the efficiency of the performance of universities in Aceh using two main inputs: Number of Teaching Staff and Number of Students as well as 2 (two) main outputs: Number of Research and Number of Graduates.
A. Data
The data source for benchmarking in this research is data of university in Aceh Province. There are several variables observed for performance measurement, namely: Number of Lecturers, Number of Students, Number of Research, and Number of Graduates.
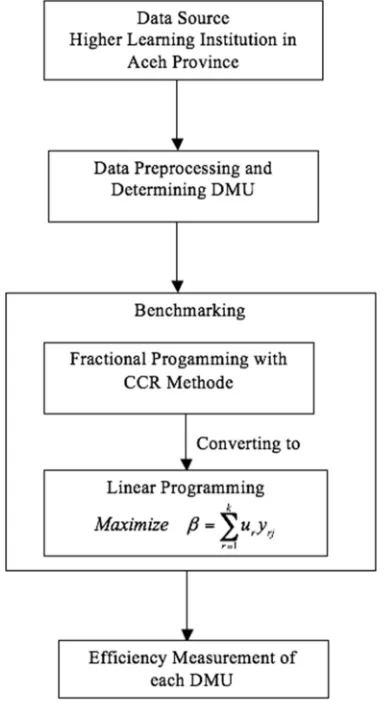
B. Research Process
The phase of the research process can be seen in Fig. 1.
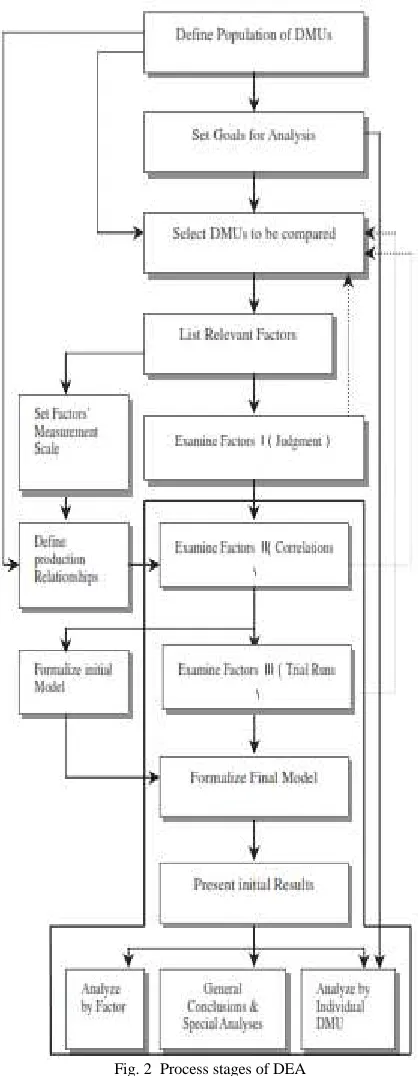
C. DEA Process
The process stages of DEA can be seen in Fig. 2 [19].
Fig. 2 Process stages of DEA
D. Fractional Programming with CCR Method
Fractional Programming with CCR Method can be modeled by the following equation.
0 1
0 1
k
r r r
l s s s
u y
Maximize
v x
α
==
=
(1)
Limit or constraint function:
,
0;
1,..., ;
1,...,
r s
u v
≥
r
=
k
s
=
l
(2)Where:
α = Efficiency of object s
k = output of object s observed
yis= the number of outputs i produced by object s xjs= number of inputs i used by object s
ui= the output weight i produced by object s vj= the input weight i given by object s
In the model, there are n number of DMUs with k number of outputs resulting from l number of inputs. yrj (>0) are the
number of output of the jth DMU and (>0) are the number of input of the jth DMU, vs are the variable weights to be
determined after solving the model.
E. Linear Programming with CCR Method
The model (1) is in the form of fractional programming, it would be computationally intractable particularly when the number of DMUs is large. Therefore it is necessarily to convert the model (1) into a linear programming problem, as proposed by [4], which can be written as follows (output oriented).
1
k r rj r
Maximize β u y =
=
(3)
Subject to
1
1 1
1;
0;
l s sj s
k l
r rj s sj
r s
v x
u y v x j
=
= =
=
− ≤ ∀
, 0 ,
r s
u v ≥ ∀ ∀r s
III. FRAMEWORK OF THE OPTIMIZATION MODEL A. Mathematical Model Formulation
Seresht et al. [20] have proposed linear programming models to generate bounded intervals as can be seen in Equations 4 and 5.
1
k
r rj r
Maximize
β
u y
=
=
− ≥ 0, = 1,2, … . ,
= 1
, ≥∈, ∀ ,
(4)
It can be seen that in the Equation 4, DMU is in an under evaluation state in the sense that the issued input is still greater than the maximum output produced. This equation can be refined to produce an output bounder by using linear programming as can be seen in Equation 5.
1
k r rj r
Maximize
β
u y =−
=1
≥ 0, = 1,2, … .,
!
=1
" ∗
=1
−
!=1
= 0
= 1
!
=
,
≥∈,∀ ,
(5)DMU as can be seen in Equation 5, is in an under evaluation state in the sense that the issued input is still greater than the maximum output produced. This equation can be refined to produce an output bounder by using linear programming as can be seen in Equation 6.
= 1
!
=
,
≥∈,∀ ,
(6)
The value of θ is essentially the result of a linear equation
for the sum of the input values of each DMU. Where θ is the upper bound interval. θ itself can be obtained by using Equation 7.
= 1
!
=
,
≥∈,∀ ,
(7) Where θ is essentially the result of a linear equation for the sum of the input values of each DMU and will use as an upper bound interval.
B. Feasible Neighborhood Heuristic Search Algorithm
The Branch-and-bound approach is a general method for solving linear integer programming problem. However, for large-scale problems such a procedure would be prohibitively expensive in terms of total computing time, and frequently the algorithm terminates without solving the problem. In reducing the problem, we assume that the integer variables is constant and only varying in the discrete step. The procedure may be summarized as follows [21] :
1) Step 1: Solve the problem to get the optimal solution
and ignore the integral problem
2) Step 2 : Obtain a (sub-optimal) integer feasible
solution, using heuristic rounding of the continuous solution.
3) Step 3: Divide the set S of integer variables into the
set S1 and give all the variables in their bounds, where
nonbasic at the continuous solution S2 and S = S1+ S2 4) Step 4 : Perform a search on the objective function,
maintaining the variables in S1 at their bounds and S2 as
continuous variables only been allowed in discrete change
5) Step 5: At the solution obtained in step 4, examine the
reduced input and increased output of the variables in S1 and
if there are the variable that must be released in the continuous variable, released them and put them into set S2.
For more details, suppose there are DMUs with inputs and outputs as can be seen in Table 1.
TABLEI
LIST OF DMU WITH INPUT AND OUTPUT
No. DMU
Input Output
Number of Teaching
Staff
Number of Students
Number of Research
Number of Graduates
1 Information
Technology 17 588 5 610
2 Civil
Engineering 26 747 5 533
3 Architectural
Engineering 15 396 5 195
4 Industrial
Engineering 17 467 5 300
5 Chemical
Engineering 25 348 5 252
6 Mechanical
Engineering 23 499 5 224
7 Electrical
Engineering 19 420 5 326
8 Agribusiness 17 689 5 273
9
Agro-Technology 34 822 5 284
10 Aquaculture 10 501 5 204
11 Communication
Science 11 719 5 273
12 Political
Science 11 262 5 183
13 Sociology 13 487 5 204
14 Anthropology 9 173 5 116
15 Jurisprudence 50 1096 10 467
16 Medicine 30 278 4 257
17 Management 48 1265 5 1302
18 Economic
Development 11 853 5 290
19 Accounting 23 1127 5 417
To perform the Upper Bound process of output with the Feasible Neighborhood Heuristic Search Algorithm can be done using Software LINDO Release 6.1 Demo Version. In the LINDO this problem can be solved using Equation (8). Maximize 610 U1 + 5 U2
Subject to
17 V1 + 588 V2 = 1 (8)
204 U1 + 5 U2 - 13 V1 - 487 V2 <= 0 116 U1 + 5 U2 - 9 V1 - 173 V2 <= 0 467 U1 + 5 U2 - 50 V1 - 1096 V2 <= 0
257 U1 + 5 U2 - 30 V1 - 278 V2 <= 0 1302 U1 + 5 U2 - 48 V1 - 1265 V2 <= 0
290 U1 + 5 U2 - 11 V1 - 852 V2 <= 0 417 U1 + 5 U2 - 23 V1 - 1127 V2 <= 0
U1, U2, V1, V2 >= 0 END
We use software LINDO Release 6.1 Demo Version. The expression (3) is in LINDO format.
The result is as follows.
OBJECTIVE FUNCTION VALUE 1) 1.000000
VARIABLE VALUE REDUCED COST U1 0.001639 0.000000
U2 0.000000 0.000000 V1 0.058824 0.000000 V2 0.000000 0.000000
It can be seen that DMU 1 is efficient, as the value of β is 1.0. The score of efficiency for all DMUs can be found in Table 2.
TABLEII
RESULT OF EFFICIENCIES FOR EACH DMUUSING OUTPUT-ORIENTED DEA
No DMU DEA Score
1 Information Technology 1,0
2 Civil Engineering 0,6982436
3 Architectural Engineering 0,6818709
4 Industrial Engineering 0,7045490
5 Chemical Engineering 0,8069085
6 Mechanical Engineering 0,5265533
7 Electrical Engineering 0,8263003
8 Agribusiness 0,6639550
9 Agrotechnology 0,3810771
10 Aquaculture 1,0
11 Communication Science 0,9912544
12 Political Science 0,9152225
13 Sociology 0,7845375
14 Anthropology 1,0
15 Jurisprudence 0,4226586
16 Medical 1,0
17 Management 0,9921286
18 Economic Development 1,0
19 Accounting 0,5871874
From Table 2 we would be able to observe that DMU1, DMU10, DMU14, DMU16, and DMU18 are efficient. However, if the output variable the number of research (y2)
is increased significantly, then the corresponding DMU would be efficient. For example, DMU2 is inefficient. If y2
is increased from 5 to 15, then it would be efficient. DMU3 is inefficient formerly if we increase y2 from 5 to 10, it
would be efficient. Need to know of staff for DMU2 and DMU3, respectively, are 26 and 15.
In order to control the flexibility of output variables, it is necessary to add the constraints in the model (2) with the bounded output.
$%&≤ & ≤ (%&
(9)
Where LB is lower bound, and UB is upper bound for DMU j.
IV. CONCLUSION
The efficiency assessment of all Higher Education Institute in Aceh Province is carried out using CCR output for oriented model. The analysis of efficiency can be done by varying the output variables, while the input variables are kept fixed. Nevertheless, the output variables should be upper bounded. It is found out that the main important to be efficient is to have more number of research. This finding is synchronized with the urge from Indonesia Government about to have more research scheme.
REFERENCES
[1] W.D. Cook, J.L. Ruiz, I. Sirvent, and J. Zhu, "Within-Group Common Benchmarking Using DEA", European Journal of
Operational Research, vol. 256 (3), pp. 901-910, 2017
[2] Ding, Y., Z. Zhang, Q. Zhang, W. Lu, Z. Yang, and N. Zhu, "Benchmark Analysis of Electricity Consumption for Complex Campus Building in China", Applied Thermal Engineering vol. 131, pp. 428-436, 2018
[3] Claro, D.P.. and W.A. Kamakura, "Identifying Sales Performance Gaps with Internal Benchmarking", Journal of Retailing vol. 93(4), pp. 401-419, 2017
[4] M.J. Farrell, "The Measurement of Productive Efficiency", Journal
of The Royal Statistical Society Series A. General, vol. 120, pp.
253-281, 1957
[5] A. Charnes, W. W. Cooper, and E. Rhodes, European J. of Oper.
Res, vol. 2, pp. 429-444, 1978
[6] J. Eskelinen, "Comparison of Variable Selection Technique for Data Envelopment Analysis in a Retail Bank", European Journal of
Operational Research, pp. 1-11, 2016
[7] R. Lin, and Z. Chen, "Fixed Input Allocation Methods Based on Super CCR Efficiency Invariance and Practical Feasibility", Applied
Mathematical Modelling, vol. 40: pp. 5377-5392, 2016
[8] Zhou, H., Y. Yang, Y. Chen, and J. Zhu, "Data Envelopment Analysis Application in Sustainability: The Origins, Development, and Future Directions", European Journal of Operational Research vol. 264 (1), pp. 1-16, 2017
[9] T. Rosenmayer, T. "Review of Economic Perspectives", vol. 14, pp. 34-54, 2014
[10] N. Hussein, S. Omar, F. Noordin, and N.A. Ishak. "Learning Organization Culture, Organizational Performance and Organizational Innovativeness in a Public Institution of a Higher Education in Malaysia: A Preliminary Study". Procedia Economics
and Finance, vol. 37, pp. 512-519, 2016
[11] H. Etzkowitz and C. Zhou. "University-Industry-Government Interaction: the Triple Helix Model of Innovation". Asia Pacific Tech
Monitor, vol. 24, pp. 14-23, 2007
[12] J. Johnes, J. and L. Yu, China Economic Review, vol. 19, pp. 679-696, 2008
[13] J. Du, J. Huo, and J. Zhu. "Data Envelopment Analysis with Output-Bounded Data". Asia-Pacific Journal of Operational Research, vol. 33 (6), pp. 1650050-1 - 1650050-17, 2016
[15] M. Branda, "Reformulations of Input-Output Oriented DEA Tests With Diversification", Operation Research Letters, vol. 41, pp. 516-520, 2013
[16] J. Wu, P. Yin, J. Sun, J. Chu, and L. Liang, "Evaluating the Environmental Efficiency of a Two-Stage System with Undesired Outputs by a DEA Approach: An Interest Preference Perspective",
European Journal of Operational Research, vol. 35, 2016
[17] Y.G. Smirlis, E.K. Maragos, and D.K. Despotis. "Data Envelopment Analysis with Missing Values: An Interval DEA Approach", Applied
Mathematics and Computation, vol. 177, pp. 1-10, 2006
[18] G. Wei and J. Wang. "A Comparative Study of Robust Efficiency Analysis and Data Envelopment Analysis with Imprecise Data",
Expert Systems with Applications, vol. 81, pp. 28-38, 2017
[19] C.L. Mei, H.C. Huang, and W.K. Wang, "Designing a Based System for Benchmarking: A DEA Approach",
Knowledge-Based Systems, vol. 24, pp. 662-671, 2011
[20] M. Z. Seresht, G. R. Jahanshahloo, and J. Jablonsky. "A Robust Data Envelopment Analysis Model with Different Scenarios", Applied
Mathematical Modelling, vol. 52, pp. 306-319, 2017
[21] Fajrian, and H. Mawengkang. "Optimization Model for Group Decisions Based on Consensus in Social Network", International