Available Online At www.ijpret.com
INTERNATIONAL JOURNAL OF PURE AND
APPLIED RESEARCH IN ENGINEERING AND
TECHNOLOGY
A PATH FOR HORIZING YOUR INNOVATIVE WORK
VIRTUAL INSTRUMENT SOFTWARE FOR PLOTTING V-I CHARACTERISTICS OF
SILICON DETECTOR USING 6487PICOAMMETER
SULOCHANA DEVI
Information Technology, Xavier Institute of Engineering, Mumbai, India Accepted Date:
27/02/2013 Publish Date:
01/04/2013 Keywords
Virtual instrument
Software;
GPIB;
LabVIEW
Corresponding Author Ms. Sulochana Devi
Abstract
In this paper, a PC-based virtual instrument (VI) that has been
developed for plotting VI characteristics of silicon detector
using a high resolution bus-programmable (RS-232 and
IEEE-488) picoammeter (model 6487) is demonstrated. The virtual
instrument can be used to test a silicon detector. While
performing semiconductor device testing it is able to produce
and analyze Voltage Vs. current (V-I) characteristics of
electronic device and also to store the measured data in a file
specified by user for future processing and analysis. The
proposed VI is based on the Lab VIEW (Laboratory Virtual
Instrument Engineering Workbench) language under the
workbench of the MS Windows 95/98 operating system. The
capability of the proposed method can be expanded according
Available Online At www.ijpret.com INTRODUCTION
LabVIEW (National Instruments, Austin,
TX) is a data acquisition and programming
environment that allows flexible
acquisition and processing of analog and
digital data. The main feature that
distinguishes LabVIEW from other data
acquisition programs is its highly modular
graphical programming language, “G,” and
a large library of mathematical and
statistical functions. The advantage of
graphical programming is that the code is
flexible, reusable, and self-documenting.
Subroutines can be saved in a library and
reused without modification in other
programs. This dramatically reduces
development time and enables
researchers to develop or modify their
own programs. LabVIEW uses a large
amount of processing power and
computer memory, thus requiring a
powerful computer. A large-screen
monitor is desirable when developing
larger applications. LabVIEW is excellently
suited by testing new monitoring
paradigms, analysis algorithms, or user
interfaces. [1] The best virtual
instrumentation system that has been
developed so far is LabVIEW. LabVIEW is
an application development program that
was developed by National Instruments in
1986 to integrate science and engineering
tasks by interfacing computers with
instruments for collecting, storing,
analyzing, and transmitting data while, at
the same time, providing an effective user
interface. Different from other
development software such as C/C++,
FORTRAN, Basic, etc., LabVIEW utilizes its
own integrated programming language
known as the Graphical Programming
Language, which uses graphics as code
sequences in the application being
developed, making the software
development process significantly easier.[2]
LabVIEW is powerful programming
software that can interface with over
7,000 instruments to provide data
acquisition, industrial measurement,
automated testing, and instrument
control. [5]
GPIB (General Purpose Interface Bus) is an
essential tool in computer-controlled
instrumentation. National Instruments'
LabVIEW provides an effective alternative
to conventional text based languages by
utilizing a graphical programming
environment to control GPIB instruments.
From a pedagogical perspective, it offers
Available Online At www.ijpret.com programming, particularly for visual
learners. [2]
I. INSTRUMENT COMMUNICATION USING VARIOUS METHODS
There are different types of
communication methods available for
controlling laboratory instruments as well
as optical components. These methods are
serial, parallel, GPIB, VXI, PXI and others,
which the choice is mainly based on the
applications. Two most common
instrument communication methods are
GPIB and serial port communication. In
1965, Hewlett Packard designed the
Hewlett-Packard Interface Bus (HP-IB) to
connect their line of programmable
instruments to their computers. Because
of its high transfer rates (nominally 1
MB/s), this interface bus quickly gained
popularity. It was later accepted as IEEE
Standard 488-1975. Today, the General
Purpose Interface Bus (GPIB) is more
widely used than the HP-IB. This is due to
its ability to connect to different devices to
the same GPIB bus.
Any devices must have a unique GPIB
address between 0 and 30, so that the
data source and destinations can be
specified by this number. Address 0 is
assigned to the GPIB interface board. The
GPIB has one Controller, usually a
computer that controls the bus
management functions. The LabVIEW GPIB
VI automatically handles the addressing
and most other bus management
functions, saving user from the hassle of
low-level programming. To use GPIB as
part of in any virtual instrumentation
systems, the GPIB driver software is
required and can be installed in our
computer according to the directions that
accompany LabVIEW or the board. [4].
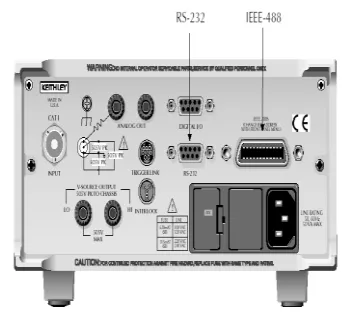
IEEE-488 connector is shown in figure 1.
Figure 1: IEEE-488 connector
II. INTERACTING WITH 6487
PICCOAMMETER THROUGH PC
The Model 6487 is a high-resolution
bus-programmable (RS-232 and IEEE-488)
picoammeter. The Model 6487 has the
following current measurement ranges: 8
Available Online At www.ijpret.com range. The Model 6487 also has a built-in
±500V DC voltage source.
The Model 6487 conforms to these
standards:
• IEEE-488.1-1987
• IEEE-488.2-1992
These standards define a syntax for
sending data to and from instruments,
how an instrument interprets this
data, what registers should exist to record
the state of the instrument, and a
group of common commands.
• SCPI 1996.0 (Standard Commands for
Programmable Instruments)
This standard defines a command
language protocol. It goes one step further
than IEEE-488.2-1992 and defines a
standard set of commands to control every
programmable aspect of an instrument.
A. Instrument control
All the instruments are connected through
a GPIB bus. A simple piece of LabVIEW
software is used to access each instrument
either for configuration or data retrieval.
Other means of hardware communication
can be used for this system; however,
since GPIB ports were already
incorporated in all of these instruments,
GPIB was selected for instruments
communication and control. A test is
selected on the front panel. These test are
predefined in the software, however, the
instrument setup must be changed
manually in order to retrieve meaningful
data. During a test cycle, current and
voltage are measured and retrieved trough
the GPIB port at predefined increments [3].
Figure 2 and 3 show front and rear panel
of model 6487.
Figure 2: Model 6487 Front Panel
Figure 3: Model 6487 IEEE-488 and RS-232
Available Online At www.ijpret.com
B. Configuring the GPIB interface
We select the GPIB interface from the
COMM menu structure (access by pressing
the COMM key while in local). After
selecting the GPIB interface, we press the
CONFIG key and then the COMM key to
configure the GPIB address and language.
From this menu we can check or change
the following settings:
• Primary address: 0–30
• Language: SCPI (SCPI 1996.0 which
includes 488.2), 488.1, or DDC
We press the RANGE keys to scroll
through ADDress and LANGuage available.
To make changes to a setting, we press
the cursor right key.
Then use the RANGE keys and the cursor
keys to select and modify the value as
desired. ENTER is pressed to save the
changes and stay in the menu (pressing
EXIT also saves the changes but leaves the
menu).
III. VIRTUAL INSTRUMENT SOFTWARE FOR
PLOTTING V-I CHARACTERISTICS OF SILICON DETECTOR
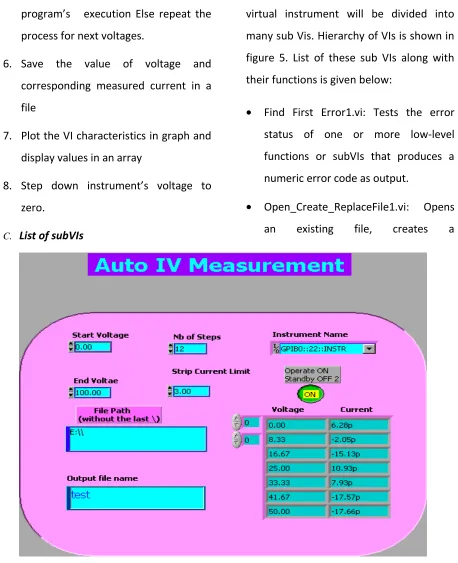
A. Front Panel Control
All the instruments are connected
through a GPIB bus. To control the
instrument 6487 first front panel is
designed. In the front panel we provide
input as given below:
• Start voltage • End voltage • Strip current limit • Numbers of steps • Instrument name • File path and • Output file name.
To pass these parameters to instrument
we are using SCPI commands. The front panel control is shown in figure 4.
B. Steps followed
Computation of Voltage and current
require start and end voltage divided into
predefined steps. To measure voltage and
current following steps have to be
followed:
1. Initialize the instrument
2. Set ranges for the various parameters
3. Give voltage to instrument
4. Read value of current measured from
instrument
5. Compare strip current limit with
measured current If current exceeds
Available Online At www.ijpret.com voltage to zero and abort the
program’s execution Else repeat the
process for next voltages.
6. Save the value of voltage and
corresponding measured current in a
file
7. Plot the VI characteristics in graph and
display values in an array
8. Step down instrument’s voltage to
zero.
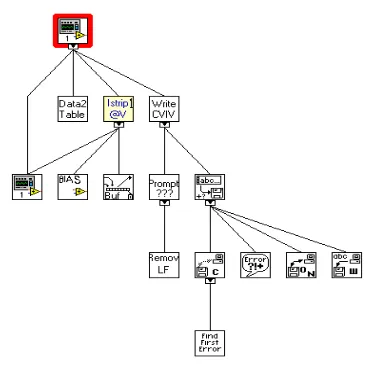
C. List of subVIs
In order to complete the processing this
virtual instrument will be divided into
many sub Vis. Hierarchy of VIs is shown in
figure 5. List of these sub VIs along with
their functions is given below:
• Find First Error1.vi: Tests the error
status of one or more low-level
functions or subVIs that produces a
numeric error code as output.
• Open_Create_ReplaceFile1.vi: Opens
an existing file, creates a
Available Online At www.ijpret.com New file or replaces an existing file,
programmatically or interactively using a file
dialog box.
• Write File1+ (string).vi: Write a string of characters to a byte stream file at a
specified location; the default location is
at the end of file. The VI does incoming
and internal error checking and does not
write if an incoming error occurs.
• V-RAMP-64871.vi: Passes the given voltage to instrument.
• 6487 -read-1CHNL1.vi: This VI reads the measured current from instrument
• XY Chart Buffer_new.vi: This reentrant VI
uses an XY graph to mimic the behavior
of an XY chart, in that it plots a
stipulated amount of the most recently
acquired data points. The chart data is
stored in a static local variable of the
output XY chart indicator.
• [email protected]: This VI plots the measured current in a graph at each of
given voltage.
Figure 5: Hierarchy of VIs.
IV. OUTPUT DISPLAY
In this program output comes in two
forms, one as a graph display and another
as a data saved in a notepad file. For
displaying output as a graph subVI
[email protected] is used. I-allStrip-Pane VI will
plots the measured current in a graph at
each of given voltage. This VI takes Bias
voltage control, number of steps and step
number as a input and display strip current,
strip current exceed limit as a output. The
connector pane of this Sub-VI is shown in
figure 6.
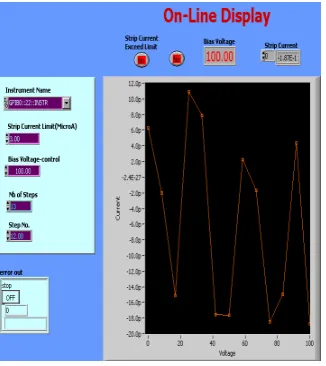
Available Online At www.ijpret.com This sub VI is directly connected to main VI
and gets the input from main VI. When all
inputs are passed, this subVI plots a graph
for measured current at each step of given
voltage. This on line display graph is shown
in figure 7.
Figure 7: Online graph display
At the same time this voltage and
corresponding measured current is also
saved in a notepad file. File location and
name is specified by user at the time of
executing this program. Output stored for
this program is shown below:
At the same time this voltage and
corresponding measured current is also
saved in a notepad file. File location and
name is specified by user at the time of
executing this program. Output stored for
this program is shown below:
V. CONCLUSION
LabVIEW is a wonderful tool to initiate a
simple approach to evaluate VI
characteristics of semiconductor devices.
The software has a high potential for the
analysis of device characteristics and
displaying output. The uses of the built-in
functions of LabVIEW help to test basic of
these devices. Online graph display is one of
the advantage over normal output. In this
paper, a PC-based virtual instrument (VI)
that has been developed for plotting VI
characteristics of silicon detector using a
high resolution bus-programmable (RS-232
and IEEE-488) picoammeter(model 6487) is
demonstrated. Measured current for each
voltage step is displayed in the form of
Available Online At www.ijpret.com
VI. FUTURE SCOPE
In this paper we have used one 6487
picoammeter is used to test VI
characteristics of a silicon detector. VI
characteristics of a transistor also can be
tested using two 6487 picoammeter. For
that we have to provide two voltages as
gate voltage and drain voltage and
corresponding current can be measured.
REFERENCES
1. Cor J. Kalkman “LabVIEW: A software
system for data acquisition, data analysis,
and instruement control”, J Clin monit
1995, pp. 51-58.
2. R. A. Sherry and S. M. Lord, "LabVIEW as
an Effective Enhancement to an
Optoelectronic Laboratory Experiment", In
Process Frontier Conference, pp. 897– 900.
1997
3. R. A. Sherry and S. M. Lord, "LabVIEW as
an Effective Enhancement to an
Optoelectronic Laboratory Experiment", In
Process Frontier Conference, pp. 897– 900.
1997
4. J.R. Noriega, A.Vera- Marquina, C. Acosta
Enriquez “Automation of An I-V
characterization system”, Journal of Applied
Research and Technology, Vol.8 No.2
August 2010, pp. 200-210.
5. "GPIB Instrument Control Tutorial".
National Instruments. August 2009..
6. M.Z. Zulkifli, S.W. Harun, K.
Thambiratnam and H. Ahmad,
"Self-Calibrating Automated Characterization
System for Depressed Cladding EDFA
Applications using LabVIEW Software with
GPIB", IEEE Transaction on Instrumentation
and Measurement, vol. 57, no. 11,