ISSN: 2306-9007 Tsao & Yang (2017) 758
I
www.irmbrjournal.com June 2017I
nternationalR
eview ofM
anagement andB
usinessR
esearchV
ol. 6 Issue.2R
M
B
R
Factors that Influence the Intention to Use Mobile Shopping
Platforms Which Feature Virtual Shelves and QR Codes –
Based on TAM
WEN-CHIN TSAO
Associate Professor of Department of Business Administration, National Chin-Yi University of Technology, Taipei, Taiwan, Republic of China.
E-mail: [email protected] Tel: +886-4-23924505 ext. 7775
Fax: +886-4-23929584
FENG-JUI YANG
Postgraduate of Department of Business Administration, National Chin-Yi University of Technology, Taipei, Taiwan, Republic of China.
E-mail: [email protected]
Tel: +886-978855568 Fax: +886-978855568
Abstract
The widespread popularity of smart handheld devices has prompted the booming development of the mobile shopping market but also formed new models of mobile shopping that consumers may or may not accept. The objective of this study was to identify the factors that will help consumers accept and use a new form of mobile shopping with quick response codes and virtual shelves. This study conducted a questionnaire survey, collected 541 samples, and tested our hypotheses and model using structural equation modeling. The results indicated that the visual attractiveness of the virtual shelves has the greatest impact on the acceptance of this new way of mobile shopping, followed by the interactivity of user interface, novelty seeking, and perceived time risk. Although the influence of Wi-Fi accessibility in the overall model was not significant, its significance was revealed when this study only looked at consumers who did not have internet access on their phones. Managerial implications for online retailers as well as directions for future research are also discussed.
Key Words: QR code, Wi-Fi accessibility, Visual attractiveness, Novelty seeking, Mobile shopping, Cloud Stores.
Introduction
ISSN: 2306-9007 Tsao & Yang (2017) 759
I
www.irmbrjournal.com June 2017I
nternationalR
eview ofM
anagement andB
usinessR
esearchV
ol. 6 Issue.2R
M
B
R
services, and/or information, including mobile banking services, mobile payment services, mobile news or information, mobile retailing and shopping, and mobile gaming or entertainment (Skiba et al., 2000; Barnes, 2002; Zhang et al., 2013). Mobile shopping is a new online shopping medium that allows consumers to use SHDs to order and/or pay for products (Hung et al., 2012). The most popular ways to access online mobile shopping platforms are via quick response code (QR code) or mobile shopping apps.
QR codes, which are black-and-white matrix barcodes, have become increasingly common in recent years. Indeed, over the past few years, QR codes have become widely used in marketing communications, advertisements, and sales promotion, whereby they can now be seen everywhere, from magazines, newspapers, and posters to packaging, labels, receipts, billboards, and television advertisements (Okazaki et al., 2012). The use of QR codes to link conventional print media to clouds allows marketing communication information to be integrated, expanded, and updated more easily (Okazaki et al., 2012; Sun et al., 2007; Ebner, 2008). A prime example of the application of QR codes in marketing channels is Homeplus, a retail chain in South Korea that was an investment of British retailer Tesco. Homeplus installed virtual displays with QR codes in subway stations, which allowed consumers to shop while they waited for the subway by linking to shopping websites via QR codes (AlSaeed, 2011). The development of virtual shelf technology was in-turn driven by the fact that consumers are often too busy to go to physical stores. Virtual shelves provide commuters with easy access to product information (such as appearance, price, or promotional information), and commuters only need to scan QR codes with their smartphones to shop (Darrell, 2011). The virtual shelf approach is unlike the complete virtuality of other mobile shopping apps; it is novel but accounts for the fact that consumers are accustomed to seeing the actual products when they shop. The primary concept underlying cloud stores is that smartphones serve as shopping carts.
Countries such as Japan, South Korea, and China foresaw the increasing trend in mobile shopping and are currently actively promoting its development. While in Taiwan, wireless communication technology is mature and digital literacy is high, government and corporate efforts to promote the use of QR codes in mobile shopping have not been as successful (Chiu, 2012). At present, the majority of research that has been conducted on QR codes has focused on marketing communication applications (such as digital tour guides, cognitive surveys, advertising, and link content) (Bamoriya, 2014; Atkinson, 2013; Okazaki et al., 2012; Probst, 2012). However, some studies have also examined design aspects of QR codes, such as a study which explored the possibility of adding aesthetic elements to the conventional black-and-white squares in order to improve appeal and recognizability without affecting scannability (Lin et al., 2013). Nonetheless, very few studies have investigated the application of QR codes in mobile shopping, and even fewer studies have investigated consumer acceptance of mobile shopping applications that feature virtual shelves with QR codes.
ISSN: 2306-9007 Tsao & Yang (2017) 760
I
www.irmbrjournal.com June 2017I
nternationalR
eview ofM
anagement andB
usinessR
esearchV
ol. 6 Issue.2R
M
B
R
Theoretical Development
The incorporation of QR codes and virtual shelves into mobile shopping applications represents a new technological development. However, whether consumers adopt this new technology depends on whether it adequately meets their needs. In marketing research, the theory of reasoned action (TRA) and the technology acceptance model (TAM) are commonly used to gauge the level of consumer acceptance towards new technology. The TRA was proposed in 1967 as a way to examine how consistently the relationship between attitude and behavior persists across multiple studies (Fishbein and Ajzen, 1975), while the TAM is a theory and model extended from the causal relationships in the TRA. The TAM provides a simplified framework and theoretical foundation that can help explain the relationship between cause and effect variables. TAM has been widely applied in various fields to predict and explain how a new technology will become accepted by consumers (Suki et al., 2011). Kang (1998) pointed out the importance of external variables to the TAM, variables such as those we know have impact on personal and social beliefs: user characteristics, information technology characteristics, task characteristics, and environmental characteristics. Once external variables are added to the TAM as antecedents, they increase the explanatory power of the model (Venkatesh and Davis, 2000). This study therefore employed the TAM as the theoretical foundation of our conceptual framework.
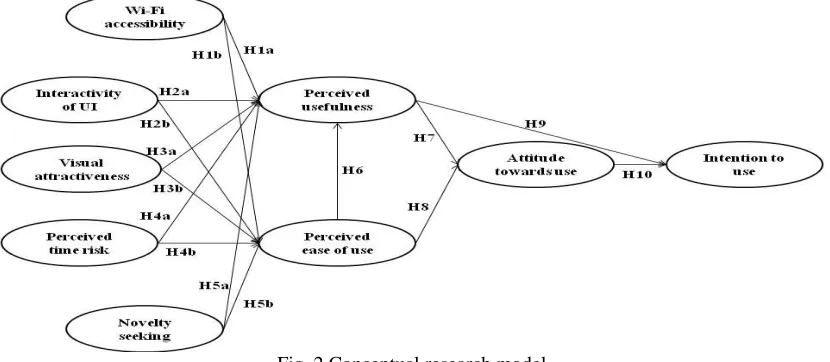
Our study investigated numerous characteristics of virtual shelves with QR codes. Specifically, we performed a comprehensive literature review and conducted expert interviews to complete an exploratory investigation into external variables that could potentially influence consumer acceptance of mobile shopping applications that feature virtual shelves with QR codes. The possible external variables are as follows. First, as mobile shopping requires wireless internet access, the availability of Wi-Fi influences the willingness of consumers to engage in mobile shopping as well as their attitudes towards it (Varshney and Vetter, 2002). Second, consumers must scan and decode QR codes to successfully connect to the shopping platform and browse shopping websites. Therefore, the degree of interactivity between users and the SHD interface influences the speed of information response after users encounter it. Third, virtual shelves use backlit images to display products, so the visual appeal of shelf displays determines whether they are able to attract user attention and stimulate willingness to shop. Fourth, mobile shopping applications that feature virtual shelves with QR codes place significant emphasis on speed and the smoothness of the shopping experience (which is in-turn affected by the complexity of the shopping process and the speed at which products are presented) can influence how much time is spent shopping (Crespo et al., 2009; Hsieh and Tsao, 2014). Finally, during the initial adoption period, the novelty-seeking behaviors of consumers themselves play a crucial role in determining whether they will be willing to adopt new products or services (Hirschman, 1980). Based on the above, this study considered five external variables in developing our conceptual research model: Wi-Fi accessibility, interactivity of user interface, visual attractiveness, perceived time risk, and novelty seeking behavior of consumers. These variables are explained in greater detail over subsequent sections.
Literature Review and Development of Hypotheses
External variables and conceptual model
Wi-Fiaccessibility
ISSN: 2306-9007 Tsao & Yang (2017) 761
I
www.irmbrjournal.com June 2017I
nternationalR
eview ofM
anagement andB
usinessR
esearchV
ol. 6 Issue.2R
M
B
R
Previous research has indicated that consumer perceptions pertaining to the usefulness and ease of use of SHD applications are greatly influenced by Wi-Fi accessibility and bandwidth (Kim et al., 2012). Relevant studies have also revealed that Wi-Fi plays a significant role in the mobile shopping environment because the corporate service quality perceived by consumers is heavily influenced by internet access and mobile resources of the consumers. Enabling users to roam across multiple networks facilitates mobile shopping; therefore Wi-Fi connections that are reliable and fast can help consumers complete online shopping orders efficiently and effectively at any time and place (Varshney and Vetter, 2002). In other words, the more easily that Wi-Fi can be accessed, the smoother the consumer shopping experience will be. Readily accessible Wi-Fi networks also reduce frustration and help consumers master the shopping process more easily. Accordingly, this study proposes the following hypotheses:
H1a: Greater Wi-Fi accessibility has a positive influence on the perceived usefulness of mobile shopping with virtual shelves and QR codes.
H1b: Greater Wi-Fi accessibility has a positive influence on the perceived ease of use of mobile shopping with virtual shelves and QR codes.
Interactivity of interface
A human-computer interface (HCI), also known as human-computer interaction (HCI), refers to an interface or environment that allows users to interact (e.g. exchange messages) with one another via the internet. User cognition plays an important role in these communication exchanges and, for this reason, HCIs are also referred to user interfaces (UIs) (McKnight et al., 1996). Moran (1981) defined a UI as anything that a user can employ to connect to a system physically, perceptually, and conceptually. In other words, UIs facilitate two-way interactions between users and a system. The afore-cited literature has led us to believe that HCIs and UIs share a similar definition; however, the term “HCI” is generally used for hardware, and the term “UI” is generally used for software. This study adopted UI as our research variable, as it was a better fit for our research topic and study goals.
Interactivity has long been considered a crucial feature of interface design and a key feature of human-computer communication (Gu et al., 2013). Over the past three decades, interactivity has been widely discussed in numerous fields, including advertising, marketing, communication, information systems, and computer science (McMillan and Hwang, 2002). Steuer (1992) suggested that interactivity is “the extent to which users can participate in modifying the format and content of a mediated environment in real time”. Therefore, this study combined UI and interactivity to derive a new external variable: interactivity of UI. Green and Pearson (2011) previously reported that UIs which are characterized by greater interactivity generally provide consumers with better control over website content (such as website design, product categories, and service items). This customizability tends to improve user perceptions of usefulness. Chang and Wang (2008) further indicated that websites which feature a greater number of interactive functions, such as search engines and online dialogue, allow users to obtain the information they need more quickly, thereby reducing time and effort. Furthermore, websites with high interactivity facilitate better user understanding, which in-turn increases user participation and enriches user experience. Based on these previous findings, this study posits the following hypotheses:
H2a: Greater UI interactivity has a positive influence on the perceived usefulness of mobile shopping with virtual shelves and QR codes.
ISSN: 2306-9007 Tsao & Yang (2017) 762
I
www.irmbrjournal.com June 2017I
nternationalR
eview ofM
anagement andB
usinessR
esearchV
ol. 6 Issue.2R
M
B
R
Visual attractiveness
Sight is the sense that people use the earliest and most commonly before encountering things in the outside world. Good use of color, light, and images can attract visual attention, and the visual dimensions of an object include color, lighting, size, and shape. The concept of shopping with virtual shelves and QR codes originates from the offline-to-online (O2O) approach of the click-and-mortar business model. Therefore, in an offline state, backlit image technology is required to change walls into shelves that resemble those of physical retail stores and to make the products appear real. Visually appealing virtual shelves are more eye-catching and tend to enhance the purchase intention of consumers (Darrell, 2011).
Previous research on consumer behavior has revealed that, when all other conditions are equal, visually attractive products lead to more favorable purchase attitudes than do visually unattractive products (van der Heijden, 2003). In 2003, van der Heijden defined perceived visual attractiveness as “the degree to which a person believes that the website is aesthetically pleasing to the eye”. The study of van der Heijden demonstrated that the visual attractiveness of websites is associated with positive consumer beliefs. In other words, website designs with greater visual attractiveness should enhance consumer perceptions of usefulness and ease of use. Van der Heijden also noted that the most eye-catching visual elements of a website are color and overall layout. In a psychological experiment, Dion et al. (1972) reached the conclusion that “what is beautiful is usable”. This implies that external visual cues can change how an individual judges the inherent nature (e.g. capability, performance, usefulness, and ease of use) of people, matters, or objects. In the context of this study, van der Heijden’s findings can be interpreted to mean that visually attractive virtual shelves are likely to be perceived as having greater usefulness and better ease of use than unattractive virtual shelves. Therefore, this study posits:
H3a: Greater visual attractiveness has a positive influence on the perceived usefulness of mobile shopping with virtual shelves and QR codes.
H3b: Greater visual attractiveness has a positive influence on the perceived ease of use of mobile shopping with virtual shelves and QR codes.
Perceived time risk
In a marketing context, perceived risks include the degree of uncertainty that consumers feel and the adverse consequences that consumers expect when purchasing a product or service (Dowling and Staelin, 1994). Relevant research has shown that consumers who shop online are most easily affected by risks associated with time, money, and the product itself (Bhatnagar and Ghosh, 2004; Forsythe and Shi, 2003; Forsythe et al., 2006). As mobile shopping applications that feature virtual shelves with QR codes place significant emphasis on speed, the greatest difference between these mobile shopping platforms and traditional online shopping platforms that are operated using a PC is the time required to complete the shopping process. If the Wi-Fi reception is poor, the shopping process may be slowed and/or product information will not be fully displayed. This unnecessarily prolongs the time required to complete an online shopping transaction, thereby frustrating consumers.
ISSN: 2306-9007 Tsao & Yang (2017) 763
I
www.irmbrjournal.com June 2017I
nternationalR
eview ofM
anagement andB
usinessR
esearchV
ol. 6 Issue.2R
M
B
R
Mobile shoppers who attach significant importance to speed tend to be especially frustrated by wasted time that results from difficulty viewing products or complex purchase procedures. This wasted time can in-turn
affect consumer perceptions of mobile shopping.Therefore, this study proposes the following hypotheses:
H4a: Lower perceived time risk has a positive influence on the perceived usefulness of mobile shopping with virtual shelves and QR codes.
H4b: Lower perceived time risk should help to improve consumer perceptions pertaining to the ease of use of mobile shopping applications that feature virtual shelves and QR codes.
Novelty seeking
Novelty seeking is a personality trait that dictates how inclined to try new products, services, or ideas a customer will be. Novelty seeking is driven by an inherent tendency to seek diversity (Khare et al., 2010), and Hirschman (1980) indicated that the novelty seeking behavior of a consumer influences his or her willingness to seek information about new products. This trait plays a crucial role during the introduction period of a novel product. Consumers who exhibit high novelty-seeking behavior tend to view new technology positively; therefore, they tend to actively seek new products or services and greatly enjoy new experiences (Jansson, 2011; Kim et al., 2010; Son and Han, 2011).
Bourlakis et al. (2009) observed that consumers tend to consider the virtual world to be a second world. In the virtual world, consumers use virtual identities to search for and interact with people or things that they are interested in. Furthermore, consumers can use the virtual world to compensate for novel experiences that may be lacking in the real world. Consumers who exhibit high novelty-seeking behavior tend to be more willing to pursue experiences and address challenges in the virtual world.
Venkatesh (2000) reported that consumer perceptions pertaining to the usefulness and ease of use of a system vary according to their personal knowledge, capabilities, and experiences. Furthermore, when a consumer is more familiar or experienced with a given system, they will tend to perceive that system as being more useful and easy to use (Domina et al., 2012; Venkatesh, 2000). Hirschman (1980) and Manning et al. (1995) indicated that consumers who exhibit high novelty-seeking behavior tend to be more willing to look for, approach, and try new things. Resultantly, these consumers also gain greater knowledge about computer systems and mobile shopping platforms and are able to operate them earlier. In other words, experience allows consumers to learn how to apply technology more easily and thereby complete tasks more successfully. Therefore, this study proposes the following hypotheses:
H5a: Greater novelty-seeking behaviour in consumers has a positive influence on the perceived usefulness of mobile shopping with virtual shelves and QR codes.
H5b: Greater novelty-seeking behaviour in consumers has a positive influence on the perceived ease of use of mobile shopping with virtual shelves and QR codes.
TAM and associated hypotheses
ISSN: 2306-9007 Tsao & Yang (2017) 764
I
www.irmbrjournal.com June 2017I
nternationalR
eview ofM
anagement andB
usinessR
esearchV
ol. 6 Issue.2R
M
B
R
Fig 1. Technology Acceptance Model (TAM). Source: Davis et al. (1989)
TAM is the most commonly applied theory in the field of information systems, particularly when addressing issues related to the internet (Crespo et al., 2009). Previous studies have used TAM to analyze the adoption of online shopping (Crespo et al., 2009) and handheld internet devices (Bruner II and Kumar, 2005). Therefore, investigations related to online shopping behavior and the adoption of m-commerce systems have provided much support for the various hypotheses derived from TAM. Hence, this study proposes the following research hypotheses:
H6: Consumer perceptions pertaining to the usefulness and ease of use of mobile shopping applications that feature virtual shelves and QR codes are correlated.
H7: High levels of perceived usefulness should positively influence consumer attitudes towards mobile shopping applications that feature virtual shelves and QR codes.
H8: High levels of perceived ease of use should positively influence consumer attitudes towards mobile shopping applications that feature virtual shelves and QR codes.
H9: High levels of perceived usefulness should positively influence consumer intentions to use mobile shopping applications that feature virtual shelves and QR codes.
H10: Improved attitudes towards mobile shopping applications that feature virtual shelves and QR codes should positively influence consumer intention to use these platforms when making purchases.
Figure 2 illustrates the conceptual model developed by this study based on the aforementioned literature and hypotheses.
ISSN: 2306-9007 Tsao & Yang (2017) 765
I
www.irmbrjournal.com June 2017I
nternationalR
eview ofM
anagement andB
usinessR
esearchV
ol. 6 Issue.2R
M
B
R
Methods
Measure development
The following section defines the external variables which were included in our conceptual model. Wi-Fi accessibility was defined as the degree to which Wi-Fi can be accessed and used by consumers (Gajević et. al., 2013; Ismail, 2013). Interactivity of UI was defined as the degree to which consumers can use their mobile device to customize the format and content of the website as well as the degree to which consumers are able to immediately communicate and interact with the system (Moran, 1981; Steuer, 1992; McMillan and Hwang, 2002). Visual attractiveness refers to the visual appeal perceived by consumers when examining the overall appearance of virtual shelves (van der Heijden, 2003). Perceived time risk refers to the amount of time that can potentially be lost as a result of inconveniences encountered during the shopping process. These inconveniences often involve difficulty viewing webpages, difficulty placing orders, or delays in receiving the product (Forsythe, et. al., 2006). Novelty seeking behavior refers to the tendency of a consumer to try new products, services, or ideas in order to gain fresh, variable, and stimulating experiences (Khare, et. al., 2010; Hamer and Copeland, 1998).
For endogeneous variables, perceived usefulness refers to consumer perceptions about the degree to which a given information technology or information technology system promotes the efficient completion of tasks or the enhancement of work performance (Davis, 1989). Perceived ease of use refers to consumer perceptions about the amount of effort required to use (or to learn how to use) a given information technology or information technology system (Davis, 1989). Attitude towards use refers to the subjective feelings that consumers have about whether a certain information technology or information technology system will benefit or damage them (Taylor and Todd, 1995). Intention to use refers to the willingness of consumers to use a given information technology or information technology system in the future (Taylor and Todd, 1995). The nine constructs above were measured using 44 question items and a seven-point Likert scale, with values from 1 to 7 indicating strong disagreement to strong agreement, respectively. Question content and related references are provided in Appendix A.
Study subjects and data collection
The subjects of this study were consumers that had experience scanning QR codes using SHDs. This study adopted a questionnaire survey method based on the convenience sampling approach. Subjects were asked to watch a video about shopping with virtual shelves and QR codes to gain a better understanding of this shopping model prior to completing the research questionnaire. Locations associated with this shopping model were chosen as testing venues. Specifically, testing was conducted in areas where large numbers of people wait for transportation, such as train stations, bus stations, and metro stations.
The interviewers contacted a total of 600 potential subjects. After eliminating 59 invalid questionnaires, a total of 541 valid questionnaires were available for analysis. Structural equation modeling (SEM) requires a minimum sample size. Bentler and Chou (1987) stated that, to establish a robust SEM, when the data conform to a normal distribution, the sample size needs to be at least five times larger than the number of variables included in the model. Conversely, when data do not present a normal distribution, the sample size must be at least than 15 times larger than the number of variables included in the model. Loehlin (1992) further proposed that SEM analysis should include a minimum of 100 samples; however, including 200 samples will improve the reliability of results. Therefore the 541 valid questionnaires analysed by this study easily exceeds the number of samples required to perform reliable statistical analysis.
ISSN: 2306-9007 Tsao & Yang (2017) 766
I
www.irmbrjournal.com June 2017I
nternationalR
eview ofM
anagement andB
usinessR
esearchV
ol. 6 Issue.2R
M
B
R
majority of subjects (384 or 71%) was a bachelor’s degree, while 95 subjects (18.1%) had attained a master’s degree. In terms of occupation, students comprised the largest group of subjects (188 or 34.8%), whereas the next largest group (131 or 24.2%) worked in the service industry. In terms of internet access, 474 subjects (87.6%) had internet access on their cell phones, and 67 subjects (12.4%) did not have internet access on their cell phones.
Analysis and Results
Structural equation modeling (SEM) was used to test the model of this study, and standardized solutions were computed in SmartPLS 2.0 software using the partial least squares (PLS) approach. PLS is a component-based SEM analysis tool. Grounded in analysis of variance techniques, PLS is based on the core concept of regression and uses the principal component method to predict and explain linear
relationships among constructs (Aiken and West, 1991; Wilson, 2010; Tsao et al., 2016).Thanks to looser
restrictions with regard to sample distribution and size, a superior capacity to analyze complex prediction models, and easy application, PLS has become popular with researchers in various fields (Chin and Newsted, 1999; Wang et al., 2004).
Measurement model
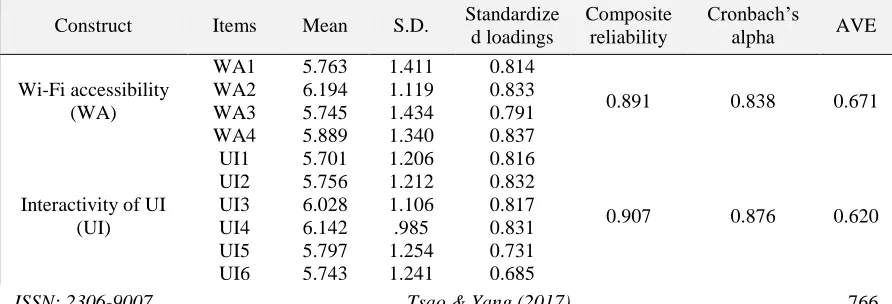
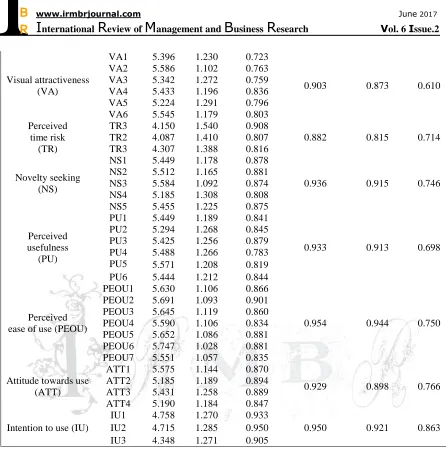
Measurement models mainly serve to assess the quality of question item design, which depends greatly on whether the manifest variables (i.e., the question items) adequately evaluate and explain their corresponding constructs. Common evaluation indices include reliability, convergent validity, and discriminant validity (Anderson & Gerbing. 1988; Wang et al., 2011). This study applied confirmatory factor analysis to determine the unidimensionality of each construct (Anderson & Gerbing, 1988). As illustrated in Table 1, all Cronbach’s alpha estimates were > 0.7 (ranging from 0.815 to 0.944), and composite reliabilities were > 0.6. Therefore, the final return shows that all nine constructs present high internal consistency (Fornell, 1992).
Construct validity was verified using convergent validity and discriminant validity. With regard to convergent validity, researchers suggest that (1) factor loadings should exceed 0.5 (Hair et al. 1998) and (2) the composite reliability of constructs should exceed 0.6 (Fornell 1992). The constructs used in this research (Table 1) met both of these standards; therefore, the questionnaire used by this paper possesses convergent validity. Fornell and Larcker (1981) reported that, to ensure discriminant validity, the shared variance among any two constructs (i.e., the square of the intercorrelation) must be less than the AVE of each construct. For each construct, AVE values (shown in Table 2) exceeded values which define the variance that is shared with other constructs. This is a clear indication that the nine constructs employed in this study exhibit discriminant validity.
Table 1 Descriptive statistics for measurement scales (latent variables)
Construct Items Mean S.D. Standardize
d loadings
Composite reliability
Cronbach’s
alpha AVE
Wi-Fi accessibility (WA)
WA1 5.763 1.411 0.814
0.891 0.838 0.671
WA2 6.194 1.119 0.833
WA3 5.745 1.434 0.791
WA4 5.889 1.340 0.837
Interactivity of UI (UI)
UI1 5.701 1.206 0.816
0.907 0.876 0.620
UI2 5.756 1.212 0.832
UI3 6.028 1.106 0.817
UI4 6.142 .985 0.831
UI5 5.797 1.254 0.731
ISSN: 2306-9007 Tsao & Yang (2017) 767
I
www.irmbrjournal.com June 2017I
nternationalR
eview ofM
anagement andB
usinessR
esearchV
ol. 6 Issue.2R
M
B
R
Visual attractiveness (VA)
VA1 5.396 1.230 0.723
0.903 0.873 0.610
VA2 5.586 1.102 0.763
VA3 5.342 1.272 0.759
VA4 5.433 1.196 0.836
VA5 5.224 1.291 0.796
VA6 5.545 1.179 0.803
Perceived time risk
(TR)
TR3 4.150 1.540 0.908
0.882 0.815 0.714
TR2 4.087 1.410 0.807
TR3 4.307 1.388 0.816
Novelty seeking (NS)
NS1 5.449 1.178 0.878
0.936 0.915 0.746
NS2 5.512 1.165 0.881
NS3 5.584 1.092 0.874
NS4 5.185 1.308 0.808
NS5 5.455 1.225 0.875
Perceived usefulness
(PU)
PU1 5.449 1.189 0.841
0.933 0.913 0.698
PU2 5.294 1.268 0.845
PU3 5.425 1.256 0.879
PU4 5.488 1.266 0.783
PU5 5.571 1.208 0.819
PU6 5.444 1.212 0.844
Perceived ease of use (PEOU)
PEOU1 5.630 1.106 0.866
0.954 0.944 0.750
PEOU2 5.691 1.093 0.901
PEOU3 5.645 1.119 0.860
PEOU4 5.590 1.106 0.834
PEOU5 5.652 1.086 0.881
PEOU6 5.747 1.028 0.881
PEOU7 5.551 1.057 0.835
Attitude towards use (ATT)
ATT1 5.575 1.144 0.870
0.929 0.898 0.766
ATT2 5.185 1.189 0.894
ATT3 5.431 1.258 0.889
ATT4 5.190 1.184 0.847
Intention to use (IU)
IU1 4.758 1.270 0.933
0.950 0.921 0.863
IU2 4.715 1.285 0.950
IU3 4.348 1.271 0.905
Table 2 Results of the Formell-Larcker test for the nine constructs
Construct WA UI VA TR NS PU PEOU ATT IU
WA 0.671a
UI 0.332 0.620
VA 0.083 0.209 0.610
TR 0.013 0.001 0.001 0.714
NS 0.036 0.086 0.150 0.006 0.746
PU 0.097 0.229 0.255 0.013 0.130 0.698
PEOU 0.096 0.212 0.173 0.032 0.119 0.357 0.750
ATT 0.056 0.155 0.226 0.011 0.142 0.393 0.296 0.766
IU 0.034 0.082 0.141 0.039 0.096 0.368 0.226 0.518 0.863
aAverage variance extracted is shown on the diagonal; squares of intercorrelations are shown below the
ISSN: 2306-9007 Tsao & Yang (2017) 768
I
www.irmbrjournal.com June 2017I
nternationalR
eview ofM
anagement andB
usinessR
esearchV
ol. 6 Issue.2R
M
B
R
Structural model and hypothesis Testing
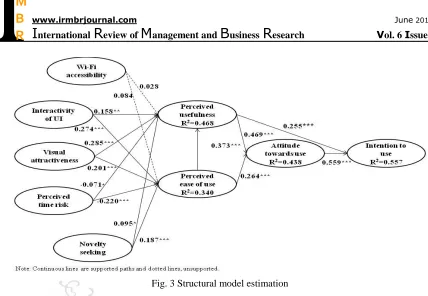
PLS does not require that the latent variables conform to a particular distribution; therefore, a bootstrap resampling technique should be employed to determine whether any of the paths in the structural model are significant (Wakeling and Morris, 2005; Chin, 2010). The statistics included in analytical results include
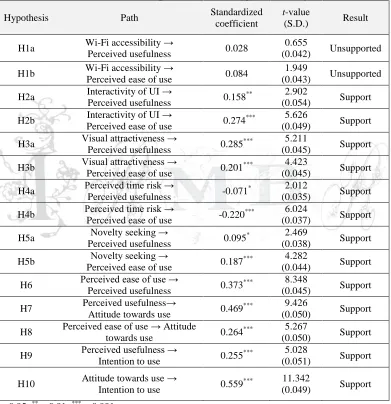
path coefficients, t-values, p-values, and R2 values, which are provided in Table 3 and Fig. 3. As shown in
Fig. 3, the proportions of variance explained (R2) by the constructs of perceived usefulness, perceived ease
of use, attitude towards use, and intention to use ranged between 0.33 and 0.67, and therefore have moderate explanatory power according to standards established by Chin (1998).
Table 3 Structural equations results for hypothesis testing
Hypothesis Path Standardized
coefficient
t-value
(S.D.) Result
H1a Wi-Fi accessibility →
Perceived usefulness 0.028
0.655
(0.042) Unsupported
H1b Wi-Fi accessibility →
Perceived ease of use 0.084
1.949
(0.043) Unsupported
H2a Interactivity of UI →
Perceived usefulness 0.158
** 2.902
(0.054) Support
H2b Interactivity of UI →
Perceived ease of use 0.274
*** 5.626
(0.049) Support
H3a Visual attractiveness →
Perceived usefulness 0.285
*** 5.211
(0.045) Support
H3b Visual attractiveness →
Perceived ease of use 0.201
*** 4.423
(0.045) Support
H4a Perceived time risk →
Perceived usefulness -0.071
* 2.012
(0.035) Support
H4b Perceived time risk →
Perceived ease of use -0.220
*** 6.024
(0.037) Support
H5a Novelty seeking →
Perceived usefulness 0.095
* 2.469
(0.038) Support
H5b Novelty seeking →
Perceived ease of use 0.187
*** 4.282
(0.044) Support
H6 Perceived ease of use →
Perceived usefulness 0.373
*** 8.348
(0.045) Support
H7 Perceived usefulness→
Attitude towards use 0.469
*** 9.426
(0.050) Support
H8 Perceived ease of use → Attitude
towards use 0.264
*** 5.267
(0.050) Support
H9 Perceived usefulness →
Intention to use 0.255
*** 5.028
(0.051) Support
H10 Attitude towards use →
Intention to use 0.559
*** 11.342
(0.049) Support
ISSN: 2306-9007 Tsao & Yang (2017) 769
I
www.irmbrjournal.com June 2017I
nternationalR
eview ofM
anagement andB
usinessR
esearchV
ol. 6 Issue.2R
M
B
R
Fig. 3 Structural model estimation
As shown in Table 3, the external variables which exerted a significant positive influence on perceived usefulness and perceived ease of use were interactivity of UI, visual attractiveness, perceived time risk, and novelty seeking. As a result, H2a, H2b, H3a, H3b, H4a, H4b, H5a, and H5b are supported, but H1a and H1b are not. From these results, this study can infer that consumer perceptions of high interactivity in SHD interfaces, greater visual attractiveness in the virtual shelves, and less time wasted during the shopping process in addition to greater novelty-seeking behavior in the consumers themselves all promote their perceptions of usefulness and ease of use in this type of mobile shopping. In contrast, accessibility of Wi-Fi was not found to be an important consumer consideration. Table 3 also shows that (1) perceived ease of use had a significant positive influence on perceived usefulness; (2) both perceived usefulness and perceived ease of use had significant positive influences on attitude towards use; and (3) perceived usefulness and attitude towards use had significant positive influences on intention to use. Therefore, H6-H10 are all supported.
Furthermore, to obtain a detailed understanding about the overall influence of these five external variables (i.e. Wi-Fi accessibility, interactivity of UI, visual attractiveness, perceived time risk, and novelty seeking behavior) on intention to use, this study conducted a path analysis and a total effect analysis. As shown in Table 4, visual attractiveness had the greatest total effect, followed by interactivity of UI, novelty seeking behavior, and perceived time risk. In contrast, the total effect of Wi-Fi accessibility was not found to be significant.
Table 4 Results of total effect analysis
Path Total effect t-value (S.D.) Ranking
Wi-Fi accessibility → Intention to use 0.043 1.618 (0.027) --
Interactivity of UI → Intention to use 0.175*** 5.154 (0.034) #2
Visual attractiveness → Intention to use 0.190*** 7.080 (0.037) #1
Perceived time risk → Intention to use -0.112*** 5.214 (0.021) #4
Novelty seeking → Intention to use 0.113*** 4.514 (0.025) #3
ISSN: 2306-9007 Tsao & Yang (2017) 770
I
www.irmbrjournal.com June 2017I
nternationalR
eview ofM
anagement andB
usinessR
esearchV
ol. 6 Issue.2R
M
B
R
Discussion
Summary of findings
Path coefficients and total effect analysis revealed that interactivity of UI, visual attractiveness, perceived time risk, and novelty seeking behavior all had a critical influence on consumer intention to use mobile shopping platforms that feature virtual shelves and QR codes. Visual attractiveness was found to have the greatest total effect, whereby consumers perceived greater usefulness and better ease of use when they regarded the overall appearance of the virtual shelves (characterized by factors such as color matching, merchandise display, image presentation, and lighting effects) as being aesthetically pleasing. This in turn promoted positive attitudes towards the mobile shopping platform and ultimately influenced intention to use. The importance of visual attractiveness in increasing perceived usefulness and perceived ease of use was demonstrated in the study conducted by van der Heijden (2003) as well. Specifically, results of that study also found that higher interactivity in mobile interfaces promoted the two-way and concurrent communication of shopping information to consumers, thereby enabling consumers to download product information quickly, which in-turn promotes greater intention to use. Furthermore, our findings showed that perceived time risk (which is affected by factors such as how easily consumers can search for products and the complexity of the order placement process) negatively impacts perceptions pertaining to the usefulness and ease of use of mobile shopping platforms that feature virtual shelves and QR codes and also reduces consumer willingness to adopt this mobile shopping technology. Finally, this study also revealed that consumers who enjoy trying out new things and pursuing new experiences tend to be more accepting of new technologies and novel ways of engaging in mobile shopping. As for the two essential positive beliefs of perceived ease of use and perceived usefulness in the model, they both positively influenced the attitude and intention of consumers with regard to the use of this type of mobile shopping as expected (H6 through H10). This result also corresponds to the findings of other studies (Gordon et al., 2003; Crespo et al., 2009; Bruner II and Kumar, 2005), which again demonstrate the stability of the TAM.
This study sought to explain why our model did not identify the influence of Wi-Fi accessibility as being significant by dividing subjects into two groups and then comparing them. Specifically, one group comprised subjects who had internet access (3G/4G) on their cell phones and the other group comprised subjects who did not. Results of this comparison revealed that, in the group that had internet access on their cell phones (474 subjects), the influence of Wi-Fi accessibility on perceived usefulness (β = 0.032, t = 0.652) and perceived ease of use (β = 0.073, t = 1.548) was not significant. However, in the group that did not have internet access on their cell phones (67 subjects), the influence of Wi-Fi accessibility on perceived usefulness (β= 0.058, t = 2.029*) and perceived ease of use (β= 0.152, t = 3.746**) was significant. Based on these findings, this study can infer that whether a personal SHD has internet access capabilities confounds the influence of Wi-Fi accessibility in our model. This study therefore speculates that H1a and H1b were rejected because the majority of subjects (88%) in this study owned an SHD with internet access. Our study further suspects that, in countries or regions where mobile internet is uncommon due to high fees or inadequate infrastructure, Wi-Fi accessibility remains a crucial factor in the successful promotion of mobile shopping platforms that feature virtual shelves and QR codes. Indeed, the importance of Wi-Fi accessibility helps explain why Facebook intends to setup 20,000 Wi-Fi hotspots in conjunction with its entrance into the Indian internet market (UND, 2017).
Managerial implications and contributions
ISSN: 2306-9007 Tsao & Yang (2017) 771
I
www.irmbrjournal.com June 2017I
nternationalR
eview ofM
anagement andB
usinessR
esearchV
ol. 6 Issue.2R
M
B
R
Andrusiewicz, 2004). When properly employed, digital signage can create a shopping mall-like atmosphere, provide product information, explain the shopping process, and make shopping more interesting (Newman et al., 2006). Furthermore, digital signage allows manufacturers to instantly adjust product displays, prices, and promotional information, which in-turn helps reduce installation costs and allows managers to be flexible with regard to product pricing and promotions. This study therefore suggests that virtual shelves should be installed using large liquid crystal screens or digital signage with good sound and lighting effects to better promote mobile shopping. Moreover, incorporating Universal Touching Point (UTP) technology into digital signage to link to near-end m-commerce services, should promote greater interactivity and integration between retailers and consumers in different spaces via offline to online to offline (O2O2O) (China Times, 2013). O2O2O applications involve retailers incorporating UTP technology into virtual shelf systems so that when consumers complete their shopping, they can also obtain information on related offers or promotions from the physical stores of said retailers or other retailers on their SHD. By shaking their SHD, they can then download a voucher for the offer or promotion. In this way, consumers can be promoted to return from shopping via virtual channels to shopping via physical channels.
This study also found that the degree of interactivity between the user and SHD interface was a crucial determinant of consumer willingness to use mobile shopping applications that feature virtual shelves and QR codes. This study suggests that, in establishing the shopping process, special attention is paid to software aspects (such as the mobile shopping app and the layout of product information) and the ability of the user interface to operate smoothly on SHDs of different brands. If possible, retailers should conduct tests to identify and eliminate possible issues that users may encounter while interacting with virtual shelves and QR codes on different SHD brands. Troubleshooting tips can also be provided on the mobile sites which host the virtual shelves. Furthermore, given that consumers with high novelty-seeking behavior exhibit increased acceptance of mobile shopping and virtual shelf technology, it is suggested that retailers include a greater number of novel, innovative, fun, and interactive elements that support marketing strategies aimed at target consumers (such as commuters who are pressured for time). Finally, this study suggests that retailers (1) display instructions which explain the dynamic shopping process next to the virtual shelves and (2) either provide free Wi-Fi within the vicinity of the virtual shelves or install the virtual shelves in public areas that already offer free Wi-Fi. This will ensure that consumers can access a stable and smooth internet connection, thereby lowering expectations that mobile shopping applications will cause them to waste time.
Limitations and future research
This study has a number of limitations. First, the five external variables that were included in the research model were compiled from a literature review and expert interviews but did not take into account opinions from consumers themselves. This study suggests that future research include pilot studies in order to integrate opinions from both retailers and consumers. Such pilot studies should ensure greater objectivity and provide the external variables with a stronger theoretical foundation. Second, time and resource limitations required that testing be restricted to Taipei City, the area of Taiwan where Wi-Fi is the most widespread. Therefore, the conclusions of this study may not be applicable in central or southern Taiwan, where Wi-Fi is less common. It is suggested that future research take regional differences into account when choosing test locations in order to increase the generalizability of results.
ISSN: 2306-9007 Tsao & Yang (2017) 772
I
www.irmbrjournal.com June 2017I
nternationalR
eview ofM
anagement andB
usinessR
esearchV
ol. 6 Issue.2R
M
B
R
intentions of new consumers with regard to mobile shopping applications that feature virtual shelves and QR codes.
References
Aiken, L. S. & West, S. G. (1991). Multiple regression: Testing and interpreting interactions. Newbury Park, CA: Sage Publications.
AlSaeed, M. (2011). Tesco: Homeplus Subway Virtual Store [Movie], available at:
https://youtu.be/nJVoYsBym88 (accessed 22 June 2016).
Anderson, J., & Gerbing, D. (1988). Structural equation modeling in practice: A review and recommended two-step approach. Psychological bulletin, 103(3), 411-423.
Atkinson, L. (2013). Smart shoppers? Using QR codes and 'green' smartphone apps to mobilize sustainable
consumption in the retail environment. International Journal of Consumer Studies,37, 387-393.
Balasubramanian, S., Peterson, R. A., & Jarvenpaa, S. L. (2002). Exploring the implications of
m-commerce for markets and marketing. Journal of the Academy of Marketing Science, 30(4), 348-361.
Bamoriya, H. (2014). QR Code based marketing in India and Japan. Singidunum Journal of Applied
Sciences,11(2), 20-29. doi:10.5937/sjas11-5504
Barnes, S. J. (2002). The mobile commerce value chain: Analysis and future developments. International
Journal of Information Management, 22(2), 91-108.
Bentler, P. M. & Chou, C. P. (1987). Practical issues in structural modelling. Sociological Methods & Research,16(1), 78-117.
Bhatnagar, A., & Ghosh, S. (2004). A latent class segmentation analysis of e-shoppers. Journal of Business Research,57(7), 758-767.
Bourlakis, M., Papagiannidis, S., & Li, F. (2009). Retail spatial evolution: paving the way from traditional
to metaverse retailing. Electronic Commerce Research, 9(1/2), 135-148.
Bruner II, G. C. & Kumar, A. (2005). Explaining consumer acceptance of handheld Internet devices.
Journal of Business Research,58, 553-558.
Chang, H. H., & Wang, I. C. (2008). TAM and flow theory for investigating on user communication
behavior in computer mediated environments. Advances in Consumer Research - European
Conference Proceedings, 8, 158-159.
Chin, W. W. (1998). Issues and opinion on structural equation modeling. MIS Quarterly,22(1), 7-16.
Chin, W. W. (2010). Bootstrap cross-validation indices for PLS path model assessment. In Vinzi, V. E., Chin, W. W., Henseler, J. & Wang, H. (Ed.), Handbook of Partial Least Squares (pp. 83-97). Springer, Heidelberg.
Chin, W. W., & Newsted, P. R. (1999). Structural equation modelling analysis with small samples using partial least squares. In R. H. Hoyle (Ed.), Statistical strategies for small sample research (pp. 307-341). Thousand Oaks, CA: Sage.
Chinatimes. (2013). Institute For Information Industry develops the program of near-field mobile
commerce, available at: http://www.chinatimes.com/realtimenews/20130927002632-260410 (accessed 11 May 2017).
Chiu, C. Y. (2012). A Study on user's adoption QR code in different scenarios (unpublished master's thesis).
Department of Information Management at the National Central University.
Crespo, A., del Bosque, I., & de los Salmones Sanchez, M. (2009). The influence of perceived risk on
internet shopping behavior: A multidimensional perspective. Journal of Risk Research,12(2), 259-277.
Dabholkar, P. A., & Bagozzi, R. P. (2002). An attitudinal model of technology-based self-service: Moderating effects of consumer traits and situational factors. Journal of the Academy of Marketing Science,30(3), 184-201.
Darrell, R. (2011). The shopping of future. Harvard Business Review, 3-12.
Davis, F. D. (1989). Perceived usefulness, perceived ease of use, and user acceptance of information
ISSN: 2306-9007 Tsao & Yang (2017) 773
I
www.irmbrjournal.com June 2017I
nternationalR
eview ofM
anagement andB
usinessR
esearchV
ol. 6 Issue.2R
M
B
R
Davis, F. D., Bagozzi, R. P. & Warshaw, P. R. (1989). User acceptance of computer technology: A
comparison of two theoretical models. Management Science, 35(8), 982-1003.
Dion, K., Berscheid, E., & Walster, E. (1972). What is beautiful is good. Journal of Personality and Social Psychology, 24(3), 285-290.
Domina, T., Lee, S., & MacGillivray, M. (2012). Understanding factors affecting consumer intention to shop in a virtual world. Journal of Retailing & Consumer Services, 19(6), 613-620.
Dowling, G. R. & Staelin, R. (1994). A model of perceived risk and intended risk-handling activity.
Journal of Consumer Research,21, 19-134.
Ebner, M. (2008). QR code-The business card of tomorrow?, available at:
http://www.academia.edu/2699498/QR_Code-the_Business_Card_of_Tomorrow (accessed 15
December 2016).
Faqih, K. S. (2013). Exploring the influence of perceived risk and internet self-efficacy on Consumer
online shopping intentions: Perspective of technology acceptance model. International Management
Review, 9(1), 67-77.
Featherman, M. S., & Pavlou, P. A. (2003). Predicting e-services adoption: A perceived risk perspective.
International Journal of Human-computer Study,59, 451-474.
Fishbein, M., & Ajzen, I. (1975). Belief, attitude, intention, and behavior: An introduction to theory and
research. MA: Addison-Wesley Publishing Company.
Fornell, C. (1992). A national customer satisfaction barometer: the Swedish experience. Journal of Marketing,56(1), 6-21.
Fornell, C., & Larcker, D. F. (1981). Evaluating structural equation models with unobservable variables
and measurement error. Journal of Marketing Research (JMR),18(1), 39-50.
Forsythe, S. M., & Shi, B. (2003). Consumer patronage and risk perceptions in internet shopping. Journal
of Business Research, 56(11), 867-875.
Forsythe, S., Liu, C. L., Shannon, D., & Gardner, L. C. (2006). Development of a scale to measure the perceived benefits and risks of online shopping. Journal of Interactive Marketing, 20(2), 55-75. Gajević, L., Danković, V., & Milovanović, M. (2013). Orijentir - Interactive City Guide for All. In
Manfred SCHRENK, Vasily V. POPOVICH, Peter ZEILE, Pietro ELISEI (Eds.), Proceedings REAL
CORP 2013 Tagungsband (pp. 1305-1308).
Green, D. T., & Pearson, J. (2011). Integrating website usability with the electronic commerce acceptance model. Behaviour & Information Technology, 30(2), 181-199.
Gu, R., Oh, L., & Wang, K. (2013). Differential impact of web and mobile interactivity on e-retailers'
performance. Journal of Organizational Computing & Electronic Commerce,23(4), 325-349.
Hair, Jr. R., Anderson, R. E., Tatham, R. L., & Black, W. C. (1998). Multivariate data analysis. New York: Macmillan Press.
Hamer, D. & Copeland, P. (1998). Living With Our Genes:Why They Matter More Than You Think. New York: Doubleday.
Harrison, J. V. & Andrusiewicz, A. (2004). A virtual marketplace for advertising narrowcast overdigital signage networks. Electronic Commerce Research and Applications, 3(2), 163-175.
Hirschman, E. L. (1980). Innovativeness, novelty seeking, and consumer creativity. Journal of Consumer
Research, 7, 283-295.
Hsieh, M., & Tsao, W. (2014). Reducing perceived online shopping risk to enhance loyalty: a website quality perspective. Journal of Risk Research,17(2), 241-261.
Hung, M. C., Yang, S. T., & Hsieh, T. C. (2012). An examination of the determinants of mobile sopping
continuance. International Journal of Electronic Business Management, 10(1), 29-37.
Ismail, N. (2013). Information accessibility in the selection of information sources in higher education: The
relevance of marketer controlled sources. Journal of Global Management,6(1), 11-21.
Jansson, J. (2011). Consumer eco-innovation adoption: Assessing attitudinal factors and perceived product characteristics. Business Strategy & The Environment (John Wiley & Sons, Inc), 20(3), 192-210. Kang, S. (1998). Information technology acceptance: Evolving with the changes in the network
ISSN: 2306-9007 Tsao & Yang (2017) 774
I
www.irmbrjournal.com June 2017I
nternationalR
eview ofM
anagement andB
usinessR
esearchV
ol. 6 Issue.2R
M
B
R
Khare, A., Singh, S., & Khare, A. (2010). Innovativeness/novelty seeking behaviour as determinants of
online shopping behavior among Indian youth. Journal of Internet Commerce, 9(3/4), 164-185.
Kim, H., Fiore, A. M., Niehm, L. S., & Jeong, M. (2010). Psychographic characteristics affecting behavioral intentions towards pop-up retailing. International Journal of Retail and Distribution Management, 38(2), 133-154.
Kim, K., Proctor, R. W., & Salvendy, G. (2012). The relation between usability and product success in cell phones. Behaviour & Information Technology, 31(10), 969-982.
Lee, M. (2009). Factors influencing the adoption of internet banking: An integration of TAM and TPB with perceived risk and perceived benefit. Electronic Commerce Research & Applications, 8(3), 130-141.
Lin, Y., Luo, S., & Chen, B. (2013). Artistic QR code embellishment. Computer Graphics Forum,32,
137-146.
Liang, D.X. (2012). The report of wireless internet usage survey in Taiwan in 2012, Taiwan Network Information Center.
Loehlin, J. C. (1992). Latent variable analysis. Lawrence Erlbaum Associates, New Jersey, NJ.
Manning, K. C., Bearden, W. O., & Madden, T. J. (1995). Consumer innovativeness and the adoption
process. Journal of Consumer Psychology,4(4), 329-345.
McKnight, C., Dillon, A., & Richardson, J. (1996). User-centered design of hypertext/hypermedia for
education. In R. B. Kozma (Ed.), Handbook of research for educational communications and
technology (pp. 622-633). Association for Educational Communications and Technology.
McMillan, S. J., & Hwang, J. (2002). Measures of perceived interactivity: An exploration of the role of direction of communication, user control, and time in shaping perceptions of interactivity. Journal of Advertising,31(3), 29-42.
Moran, T. (1981). An applied psychology of the user. ACM Computing Surveys, 13(1), 1-12.
Newman, A., Dennis, C. E., & Zaman, S. (2006). Marketing images and consumers’ experiences in selling
environments. Marketing Management Journal (fall), 515-599.
Okazaki, S., Li, H., & Hirose, M. (2012). Benchmarking the use of QR code in mobile promotion. Journal
of Advertising Research, 52(1), 102-117.
Probst, A. (2012). The expectations of quick response (QR) codes in print media: An empirical data
research anthology. UW-L Journal of Undergraduate Research, 15, 1-13.
Saidi, E. (2009). Mobile opportunities, mobile problems: Assessing mobile commerce implementation
issues in Malawi. Journal of Internet Banking and Commerce, 14(1), 1-10.
Skiba, B., Johnson, M., Dillon, M., & Harrison, C. (2000). Moving in mobile media mode. Lehman Brothers, available at: http://www.regisoft.com/articles/lehman.pdf (accessed 20 September 2016). Son, M., & Han, K. (2011). Beyond the technology adoption: Technology readiness effects on
post-adoption behavior. Journal of Business Research, 64(11), 1178-1182.
Steuer, J. (1992). Defining virtual reality: dimensions determining telepresence. Journal of Communication, 42(4), 73-93.D
Suki, N. M., Ramayah, T., Loh, M. Y., & Amin, H. (2011). An empirical investigation of wireless
application protocol (WAP) services usage determinants. International Journal of e-Business
Management, 5(1), 2-15.
Sun, A., Sun, Y. & Liu, C. (2007). The QR code reorganization in illegible snapshots taken by mobile phones. Proceedings of the Fifth International Conference on Computational Science and Applications. Taylor, S., & Todd, P. A. (1995). Understanding information technology usage: A test of competing
models. Information System Research, 6(2), 144-176.
Tsang, Ai. (2016). Gold cross of e-commerce! M-commerce becomes retailing mainstream, available at: https://www.bnext.com.tw/article/41321/criteo-report-claims-mobile-commerce-is-mainstream
(accessed 11 May 2017).
Tsao, W. C., Hsieh, M. T., & Lin, T. M. (2016). Intensifying online loyalty! The power of website quality and the perceived value of consumer/seller relationship. Industrial Management & Data Systems,
116(9), 1987-2010.
UND. (2017). Facebook enters India, setting up 20 thousands Wi-Fi hotspots, available at:
ISSN: 2306-9007 Tsao & Yang (2017) 775
I
www.irmbrjournal.com June 2017I
nternationalR
eview ofM
anagement andB
usinessR
esearchV
ol. 6 Issue.2R
M
B
R
van der Heijden, H. (2003). Factors influencing the usage of websites: the case of a generic portal in The Netherlands. Information & Management, 40(6), 541.
Varshney, U., & Vetter, R. (2002). Mobile commerce: framework, applications and networking support.
ACM/Kluwer Journal on Mobile Networks and Applications (MONET),7(3), 185-198.
Venkatesh, V. (2000). Determinants of perceived ease of use: integrating control, intrinsic motivation, and
emotion into the technology acceptance model. Information Systems Research, 11(4), 342-365.
Venkatesh, V., & Davis, F. D. (2000). A theoretical extension of the technology acceptance model: four
longitudinal field studies. Management Science, 46(2), 186-204.
Wakeling, I. N. & Morris, J. J. (2005). A test of significance for partial least squares regression. Journal of Chemometrics,7(4), 291-304.
Wang, Y. S., Wu, S. C., Lin, H. H., & Wang, Y. Y. (2011). The relationship of service failure severity, service recovery justice and perceived switching costs with customer loyalty in the context of e-tailing.
International Journal of Information Management,31(4), 350-359.
Wang, Y., Lo, H., & Yang, Y. (2004). The constituents of core competencies and firm performance: evidence from high-technology firms in china. Journal of Engineering & Technology Management, 21(4), 249-280.
Wilson, B. (2010). Using PLS to investigate interaction effects between higher order branding constructs.
In Vinzi, V. E., Chin, W. W., Henseler, J & Wang, H. (Ed.), Handbook of Partial Least Squares (pp.
621-653). Springer, Heidelberg.
Zhang, R., Chen, Jim Q., & Lee, C. J. (2013). Mobile commerce and consumer privacy concerns. Journal
of Computer Information Systems, 53(4), 31-38.
Appendix A. Content of the questionnaire
This appendix contains the statements that were used in the questionnaire survey. Respondents were asked to report the degree to which they agreed or disagreed with the statements using a seven-point Likert scale.
Wi-Fi accessibility (adapted from Ismail, 2013, α= .838) When I use mobile shopping with QR codes, …..
WA1 …..Wi-Fi is available when I need it. WA2 …..the Wi-Fi connection process is simple.
WA3 …..I can easily understand how to set-up a Wi-Fi account and password. WA4 …..Wi-Fi is easy to access and use.
Interactivity of UI (adapted from McMillan and Hwang, 2002, α= .876)
When I use mobile shopping platforms that feature virtual shelves and QR codes, the user interface of my mobile device…
UI1 …..enables two-way communication of shopping information.
UI2 …..enables concurrent communication of shopping information and the receipt of instant responses.
UI3 …..loads the shopping information that I need quickly. UI4 …..operates at high speed.
UI5 …..displays a variety of shopping information.
UI6 …..keeps my attention with the shopping information displayed.
Visual attractiveness (adapted from van der Heijden, 2003, α= .873) The virtual shelves...
VA1 …..use matched colors that are attractive. VA2 …..have an attractive layout.
ISSN: 2306-9007 Tsao & Yang (2017) 776
I
www.irmbrjournal.com June 2017I
nternationalR
eview ofM
anagement andB
usinessR
esearchV
ol. 6 Issue.2R
M
B
R
VA5 …..have appealing lighting effects.
VA6 Overall, I find that that the virtual shelves look attractive.
Perceived time risk (adapted from Forsythe et. al., 2006, α=.815) I feel that this type of mobile shopping platform...
TR1 …..has an overly complicated ordering process. TR2 …. makes it difficult to find the products I need.
TR3 ….. requires a lot of time to display product information and pictures.
Novelty seeking (adopted from Dabholkar and Bagozzi, 2002; Khare et. al., 2010, α=.915) NS1 I am always seeking new ideas and experiences.
NS2 When things get boring, I like to try new and unfamiliar experiences.
NS3 I enjoy going to places where I will be exposed to information about new products and services. NS4 I enjoy participating in various activities.
NS5 I like to experience novelty and change in my daily routine.
Perceived usefulness (adapted from Davis, 1989; 1993, α=.913) This type of mobile shopping platform will...
PU1 …..enable me to complete my shopping more quickly. PU2 …..increase my shopping effectiveness.
PU3 …..help me shop more efficiently. PU4 …..reduce my shopping costs. PU5 …..make shopping simpler.
PU6 Overall, this way of shopping is useful.
Perceived ease of use (adapted from Davis, 1989; 1993, α= .944) This method of mobile shopping…..
PEOU1 …..is easy to learn. PEOU2 …..is easy to operate.
PEOU3 …..does not require too much effort. PEOU4 …..is easy to grasp.
PEOU5 …..is clear and easy to understand. PEOU6 …..is easy to get the hang of.
PEOU7 Overall, this way of shopping is easy to use.
Attitude towards use (adapted from Taylor and Todd, 1995, α= .898) Shopping with this type of mobile platform…..
ATT1 …..is a good idea. ATT2 …..is a wise idea. ATT3 …..is pleasant.
ATT4 I like the idea of using this type of mobile shopping platform.
Intention to use (adapted from Taylor and Todd, 1995, α= .921)
In the future, I ….. mobile shopping platforms that feature virtual shelves and QR codes. UI1 …..intend to use…
UI2 …..intend to frequently use…