Copyright © 2018 by Academic Publishing House Researcher s.r.o.
Published in Slovak Republic
European Journal of Economic Studies
Has been issued since 2012.E-ISSN: 2305-6282
2018, 7(2): 58-68
DOI: 10.13187/es.2018.7.58
www.ejournal2.com
Articles and Statements
The Dynamic Causal Links between Energy Consumption, Trade Openness and Economic Growth: Time Series Evidence from Upper Middle Income Countries
Murat Cetin a , *, Eyyup Ecevit b
a Namik Kemal University, Tekirdag, Turkey b Erciyes University, Kayseri, Turkey
Abstract
This study investigates the dynamic causal links between energy consumption, trade openness and economic growth for upper middle income countries over the period 1971-2014. The ARDL bounds test is used to examine the presence of cointegration between the variables. The VECM Granger causality method is also used to explore causality between the variables. Empirical results indicate that i) the variables are stationary at first differences, ii) there exists cointegration between the variables in Turkey, China, Colombia, Ecuador, Jamaica and Peru, iii) there exists important causal linkages among the variables in the long run, iv) the energy-led-growth and trade-led-energy-led-growth hypotheses are demonstrated for Turkey, China, Colombia, Jamaica and Peru.
Keywords: energy, openness, growth, cointegration, causality.
1. Introduction
The energy consumption-income link has been significantly discussed in economic growth literature. Especially, the causal linkages between these variables lead us to the several theoretical approaches. In this context, there exists four hypotheses related with energy-growth link. According to the growth hypothesis, energy is a vital source for production function. This hypothesis implies that energy consumption causes economic growth (Masih and Masih, 1998). The conservation hypothesis expresses that economic growth causes energy consumption.
A reduction in energy demand does not affect economic growth very much. The presence of a bi-directional causal linkage between the variables is called as the feedback hypothesis. Finally, the
neutrality hypothesis assumes that there exists no causality between energy consumption and economic growth (Kumar et al., 2015).
The growth literature has also discussed the importance of trade opennes on economic growth. The Heckscher-Ohlin model suggests that trade openness can increase productivity and incomes in countries (Stensnes, 2006). According to Krugman (1979), the total output increases in a free trade environment. Grossman and Helpman (1995) explain that free trade can promote the rate of economic growth through the diffusion of knowledge and technology across countries.
* Corresponding author
Romer (1991) states that trade openness can stimulate economic growth through innovation, efficiency and technological improvement.
In this context, this study deals with the dynamic causal links between energy consumption, trade openness and economic growth for upper middle income countries over the period 1971-2014. The ARDL bounds test and VECM Granger causality method are employed to examine the presence of cointegration and causal links between the variables.
The remainder of the study is outlined in five sections. Section two deals with the literature. Section three presents the model specification and data. Section four reports the methodology. The empirical results are provided in section five. Finally, the study provides a conclusion and policy implication.
2. Literature Review
Kraft and Kraft (1978) analyses the link between energy consumption and economic growth. This study indicates that economic growth causes energy consumption and energy consumption causes economic growth. This finding implies that there exsists empirical evidence supporting the conservation hypothesis for USA.
Using the Granger causality approach, Yu and Choi (1985) examine the link between these variables. In the study, it is found that economic growth causes energy consumption in South Korea. This implies the presence of conservation hypothesis. No causality is found for USA, UK and Poland implying the presence of neutrality hypothesis.
Glasure and Lee (1997) investigate the economies of Singapore and South Korea. The study presents the bi-directional causal linkage between the variables indicating the existence of feedback hypothesis.
Stern (2000) uses a VAR model for USA economy. In 3 of the 5 models, the causality from energy use to economic growth is found. In the other models, the presence of bi-directional causality between the variables is found. The study presents empirical findings supporting the presence of growth and feedback hypotheses.
Asafu-Adjaye (2000) adds energy prices to the analyses in the Asian developing countries. This study uses the Johansen-Juselius test and VECM Granger causality method. In the long run, it is found that energy consumption causes economic growth in India and Indonesia. In the long run, it is also found that economic growth causes energy consumption in Thailand and Phillippines. The results imply the validity of growth hypothesis for India and Indonesia, and conservation hypothesis for Thailand and Phillippines.
Soytas and Sari (2003) test the causal link between energy consumption and GDP in G-7 countries and emerging economies. The VECM Granger causality analysis reveals the existence of the bi-directional causality between these variables in Argentina. It is determined that economic growth causes energy consumption in Italy and Korea. It is also determined that energy consumption causes economic growth in Turkey, France, Germany and Japan. The study supports the presence of feedback hypothesis for Argantina, conservation hypothesis for India and Indonesia. The study also supports growth hypothesis for Turkey, France, Germany and Japan.
Applying a multivariate cointegration analysis, Ghali and El-Sakka (2004) examine the link between energy consumption and growth in case of Canada. The findings reveals the presence of the bi-directional causal linkage between the variables. The result implies the persence of feedback hypothesis for Canada.
Using panel data methodology, Lee (2005) examines the relationship between the variables in developing countries. The results reveal that energy consumption causes economic growth. This is an empirical evidence for the growth hypothesis.
Caraiani et al. (2015) deal with the causal link between the variables by applying a three-step analysis for emerging European countries. The results support the conservation hypothesis for Hungary, Poland and Turkey. The results indicate the existence of growth hypothesis for Romania. The feedback hypothesis is valid for Bulgaria.
economic growth causes energy consumption. This indicates the validity of conservation hypothesis for Angola.
From the empirical perspective, there exists a wide range of paper dealing with the link between trade openness and growth. Applying the Granger causality analysis, Jung and Marshall (1985) examine the exports-economic growth link for 37 countries. The causality analysis reports that there exists no causality between these variables.
Hsiao (1987) also examines the exports-economic growth link for Asian countries. The study indicates that economic growth causes exports in case of Hong Kong.
Frankel and Romer (1999) deal with the link between trade and economic growth using panel data analysis. The study does not analyze causality between the variables. This study show that trade is not linked with economic growth. Hassan (2005) investigates the link between international trade and economic growth in case of Bangladesh. The empirical results show that there exists the uni-directional causality from trade openness to economic growth.
Gries and Redlin (2012) examine the relationship between trade openness and economic growth through a panel causality analysis. The panel GMM estimation results indicate the peresence of the long run bi-directional causality between the variables. This means that trade openness is a crucial factor of economic growth in the long term.
Okuyan and Ozun (2012) test the relationship between the variables in developing countries. This study usess the ARDL boundst test and Yamamoto causality method. The Toda-Yamamoto causality analysis revals that in four countries there exists a causal linkage from trade openness to economic growth. The Toda-Yamamoto causality analysis also revals that economic growth causes trade openness in the other countries.
Arif and Ahmad (2012) analyze the link between trade openness and economic growth using the Granger causality approach. The empirical results indicate that there exists the bi-directional causal linkage between trade openness and economic growth.
In recently, there has been an empirical literature investigating the relationship between energy consumption, trade and economic growth. This encompasses the studies of Shahbaz et al. (2013); Kumar et al. (2015); Kyophilavong et al. (2015) and Katırcıoğlu et al. (2016). Shahbaz et al. (2013) explore the link between energy use, trade openness, financial development, capital and economic growth in China. This study uses the ARDL bounds test and VECM Granger causality method. The Granger causality analysis shows that there exists the uni-directional causal link from energy use to economic growth. This indicates that the growth hypothesis is valid for China. In addition, the bi-directional causal link between the variables is determined.
Using the ARDL bounds test, Bayer and Hanck cointegration technique and Toda-Yamamoto causality approach, Kumar et al. (2015) investigate the South African economy. The results reveal that energy consumption causes economic growth. The results also reveal the presence of the bi-directional causal link between these variables. Therefore, the growth and feedback hypotheses are valid for South Africa.
Applying the Bayer and Hanck cointegration method, Kyophilavong et al. (2015) examine the link between energy use, openness and growth in Thailand. The study reveals that the feedback hypothesis is valid for Thailand. The study also reveals that there exists the bi-directional causal linkage between openness and growth in the long run.
Katırcıoğlu et al. (2016) deal with the relationship between energy consumption, trade and real income in case of Canada. This study uses the ARDL bounds test and VECM Granger causality approach. The causality test reveals the existence of the bi-directional causal link between energy consumption and economic growth. The study also reveals the existence of the bi-directional causality between trade and growth. The results support the presence of feedback hypothesis.
3. Model Specification and Data
The present study aims at dealing with the link between energy use, trade openness and economic growth by employing the log-lineer model. Following Kyophilavong et al. (2015), the relationship between the variables is specified as follows:
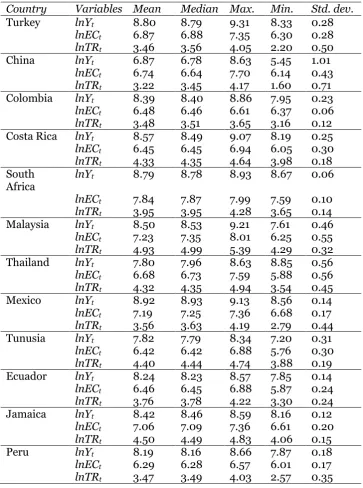
where, lnYt, lnECt and lnTRt represent per capita real GDP (in constant 2010 US dollars), per capita energy consumption (in kg of oil equivalent) and trade openness which is obtained by dividing the sum of exports and imports by GDP. All the variables are transformed into logarithm. α0 is the constant, α1 and α2 denote the elasticity coefficient of energy concumption per capita and trade openness, respectively. The term εt is a random error term. The study covers 12 upper-middle income countries (Turkey, China, Colombia, Costa Rica, South Africa, Malaysia, Thailand, Mexico, Tunusia, Ecuador, Jamaica and Peru). Annual time series from 1971 to 2014 are obtained from World Development Indicators (World Development Indicators, 2016). According to the World Bank classification, the main feature of these countries is that they have the same per capita income levelin 2016. Table 1 presents the descriptive statistics.
Table 1. Descriptive Statistics
Country Variables Mean Median Max. Min. Std. dev.
Turkey lnYt 8.80 8.79 9.31 8.33 0.28
lnECt 6.87 6.88 7.35 6.30 0.28
lnTRt 3.46 3.56 4.05 2.20 0.50
China lnYt 6.87 6.78 8.63 5.45 1.01
lnECt 6.74 6.64 7.70 6.14 0.43
lnTRt 3.22 3.45 4.17 1.60 0.71 Colombia lnYt 8.39 8.40 8.86 7.95 0.23
lnECt 6.48 6.46 6.61 6.37 0.06
lnTRt 3.48 3.51 3.65 3.16 0.12 Costa Rica lnYt 8.57 8.49 9.07 8.19 0.25
lnECt 6.45 6.45 6.94 6.05 0.30
lnTRt 4.33 4.35 4.64 3.98 0.18 South
Africa lnYt 8.79 8.78 8.93 8.67 0.06
lnECt 7.84 7.87 7.99 7.59 0.10
lnTRt 3.95 3.95 4.28 3.65 0.14 Malaysia lnYt 8.50 8.53 9.21 7.61 0.46
lnECt 7.23 7.35 8.01 6.25 0.55
lnTRt 4.93 4.99 5.39 4.29 0.32 Thailand lnYt 7.80 7.96 8.63 8.85 0.56
lnECt 6.68 6.73 7.59 5.88 0.56
lnTRt 4.32 4.35 4.94 3.54 0.45 Mexico lnYt 8.92 8.93 9.13 8.56 0.14
lnECt 7.19 7.25 7.36 6.68 0.17
lnTRt 3.56 3.63 4.19 2.79 0.44 Tunusia lnYt 7.82 7.79 8.34 7.20 0.31
lnECt 6.42 6.42 6.88 5.76 0.30
lnTRt 4.40 4.44 4.74 3.88 0.19 Ecuador lnYt 8.24 8.23 8.57 7.85 0.14
lnECt 6.46 6.45 6.88 5.87 0.24
lnTRt 3.76 3.78 4.22 3.30 0.24 Jamaica lnYt 8.42 8.46 8.59 8.16 0.12
lnECt 7.06 7.09 7.36 6.61 0.20
lnTRt 4.50 4.49 4.83 4.06 0.15
Peru lnYt 8.19 8.16 8.66 7.87 0.18
lnECt 6.29 6.28 6.57 6.01 0.17
4. Econometric Methodology
Firstly, the stationarity properties of the variables are examined through the ADF, DF-GLS and PP tests. Secondly, the cointegration analysis is implemented by the ARDL bounds test. Thirdly, the study investigates the causal links between the variables through the VECM Granger causality test. In this stage, both short-run and long-run causality between the variables is analyzed.
4.1. Cointegration Analysis
Several cointegration methods suggested by Engle and Granger (1987), Johansen and Juselius (1990), Phillips and Hansen (1990), Stock and Watson (1993) have been used to investigate the long run relationship among the variables in the empirical studies. These are univariate or multivariate cointegration approaches and require that the variables should be integrated at I(1).
This study uses the ARDL bounds test to examine the presence of long run link between energy consumption, trade openness and economic growth. The ARDL bounds test is a single cointegration approach and has several important advantages in comparison with other cointegration techniques. In the ARDL approach, the regressors may be integrated I(0) or I(1). This method provides efficient results for small sample data. In addition, a dynamic unrestricted error correction model (UECM) can be obtained from the ARDL model. The UECM encompasses both short-run and long-run dynamics (Pesaran, Shin, 1999). In this study, the following ARDL model is employed:
where, α0 is the constant, Δ is the first difference operator and εt is the random error term. The appropriate lag order is determined by the AIC and SBC. In the bounds testing approach, the computed F-statistic is compared with the upper critical bound (UCB) and lower critical bound (LCB). These critical bounds are generated by Pesaran et al. (2001). This cointegration procedure tests the null hypothes of no cointegration against the alternative hypothesis of cointegration. The null hypothesis can not be rejected if the computed F-statistic exceeds the UCB. This means that there exists a cointegration between the variables. The null hypothesis can be rejected if the computed F-statistic below the LCB. This indicates that there exists no cointegration between the variables. If computed F-statistic falls between the UCB and LCB, the result is uncertain.
Using some diagnostic tests such as serial correlation, functional form, normality of error term and heteroskedasticity, we can investigate the robustness of the ARDL model. In addition, we can examine the stability of the ARDL parameters through the cumulative sum of recursive residuals (CUSUM) and the cumulative sum of squares of recursive residuals (CUSUMsq) tests of Brown et al. (1975).
4.2. Causality Analysis
This study employs the VECM Granger causality method to estimate the causal links between the variables. After applying a cointegration approach, the VECM Granger causality method can be used. The empirical specification of this causality method is expressed as follows:
)
3
(
ln
ln
ln
)
1
(
ln
ln
ln
)
1
(
3 2 1 1 1 1 1 33 32 31 23 22 21 13 12 11 1 3 2 1
t t t t t t t i i i i i i i i i p i t t tECT
TR
EC
Y
x
a
a
a
a
a
a
a
a
a
L
TR
EC
Y
L
between the variables. If F-statistic on the first differences of the variables is significant, there exists a causal linkage between the variables in the short run.
5. Empirical Results
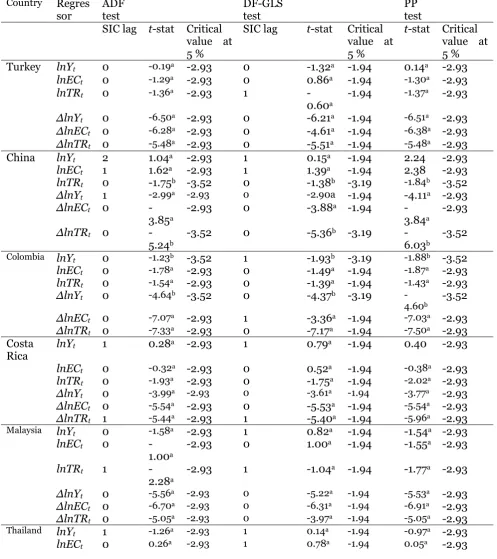
We apply ADF, DF-GLS and PP tests to implement unit root analysis of the variables. The results presented in Table 2 indicate that the variables have an unit root at level but stationary at first difference. The results also indicate that the ARDL bounds test can be employed to analyze the existence of a cointegration between the variables.
Table 2. The Results of Unit Root Tests
Country Regres
sor ADF test DF-GLS test PP test
SIC lag t-stat Critical value at 5 %
SIC lag t-stat Critical value at 5 %
t-stat Critical value at 5 % Turkey lnYt 0 -0.19a -2.93 0 -1.32a -1.94 0.14a -2.93
lnECt 0 -1.29a -2.93 0 0.86a -1.94 -1.30a -2.93
lnTRt 0 -1.36a -2.93 1
-0.60a
-1.94 -1.37a -2.93
∆lnYt 0 -6.50a -2.93 0 -6.21a -1.94 -6.51a -2.93
∆lnECt 0 -6.28a -2.93 0 -4.61a -1.94 -6.38a -2.93
∆lnTRt 0 -5.48a -2.93 0 -5.51a -1.94 -5.48a -2.93
China lnYt 2 1.04a -2.93 1 0.15a -1.94 2.24 -2.93
lnECt 1 1.62a -2.93 1 1.39a -1.94 2.38 -2.93
lnTRt 0 -1.75b -3.52 0 -1.38b -3.19 -1.84b -3.52
∆lnYt 1 -2.99a -2.93 0 -2.90a -1.94 -4.11a -2.93
∆lnECt 0
-3.85a
-2.93 0 -3.88a -1.94
-3.84a
-2.93
∆lnTRt 0
-5.24b -3.52 0 -5.36
b -3.19
-6.03b -3.52
Colombia lnYt 0 -1.23b -3.52 1 -1.93b -3.19 -1.88b -3.52
lnECt 0 -1.78a -2.93 0 -1.49a -1.94 -1.87a -2.93
lnTRt 0 -1.54a -2.93 0 -1.39a -1.94 -1.43a -2.93
∆lnYt 0 -4.64b -3.52 0 -4.37b -3.19
-4.60b -3.52
∆lnECt 0 -7.07a -2.93 1 -3.36a -1.94 -7.03a -2.93
∆lnTRt 0 -7.33a -2.93 0 -7.17a -1.94 -7.50a -2.93
Costa
Rica lnYt 1 0.28
a -2.93 1 0.79a -1.94 0.40 -2.93
lnECt 0 -0.32a -2.93 0 0.52a -1.94 -0.38a -2.93
lnTRt 0 -1.93a -2.93 0 -1.75a -1.94 -2.02a -2.93
∆lnYt 0 -3.99a -2.93 0 -3.61a -1.94 -3.77a -2.93
∆lnECt 0 -5.54a -2.93 0 -5.53a -1.94 -5.54a -2.93
∆lnTRt 1 -5.44a -2.93 1 -5.40a -1.94 -5.96a -2.93
Malaysia lnYt 0 -1.58a -2.93 1 0.82a -1.94 -1.54a -2.93
lnECt 0
-1.00a
-2.93 0 1.00a -1.94 -1.55a -2.93
lnTRt 1
-2.28a
-2.93 1 -1.04a -1.94 -1.77a -2.93
∆lnYt 0 -5.56a -2.93 0 -5.22a -1.94 -5.53a -2.93
∆lnECt 0 -6.70a -2.93 0 -6.31a -1.94 -6.91a -2.93
∆lnTRt 0 -5.05a -2.93 0 -3.97a -1.94 -5.05a -2.93
Thailand lnYt 1 -1.26a -2.93 1 0.14a -1.94 -0.97a -2.93
lnTRt 0 -1.20a -2.93 0 0.27a -1.94 -1.21a -2.93
∆lnYt 0 -3.93a -2.93 0 -3.63a -1.94 -3.93a -2.93
∆lnECt 0 -4.82a -2.93 0 -4.78a -1.94 -4.92a -2.93
∆lnTRt 0 -6.91a -2.93 0 -6.83a -1.94 -6.91a -2.93
Mexico lnYt 0 -2.21a -2.93 0 0.08a -1.94 -2.14a -2.93
lnECt 0 -3.07b -3.52 0 -1.36b -3.19 -2.99b -3.52
lnTRt 0 -1.19a -2.93 0 -0.03a -1.94 -1.21a -2.93
∆lnYt 0 -5.06a -2.93 0 -4.58a -1.94 -4.99a -2.93
∆lnECt 0 -5.07b -3.52 0 -5.05b -3.19 -5.09b -3.52
∆lnTRt 1 -5.86a -2.93 1 -5.92a -1.94 -7.62a -2.93
Tunusia lnYt 0 -2.70b -3.52 0 -2.16b -3.19 -2.84b -3.52
lnECt 0 -3.34b -3.52 1 -1.37b -3.19 -3.24b -3.52
lnTRt 0 -2.53a -2.93 0 -0.71a -1.94 -2.55a -2.93
∆lnYt 0 -8.95b -3.52 0 -4.98b -3.19 -8.70b -3.52
∆lnECt 0
-10.52 b
-3.52 0
-10.27b
-3.19 -10.53 b
-3.52
∆lnTRt 0 -5.96a -2.93 0 -6.03a -1.94 -5.99a -2.93
Ecuador lnYt 0 -1.65a -2.93 0 1.12a -1.94 -1.66a -2.93
lnECt 0 -1.75a -2.93 0 0.31a -1.94 -1.76a -2.93
lnTRt 0 -1.64a -2.93 0 -0.68 -1.94 -1.54a -2.93
∆lnYt 0 -4.24a -2.93 0 -4.28a -1.94 -4.21a -2.93
∆lnECt 0 -6.46a -2.93 0 -6.47a -1.94 -6.46a -2.93
∆lnTRt 0 -7.04a -2.93 0 -7.01a -1.94 -8.66a -2.93
Jamaica lnYt 1 -1.67a -2.93 1 -1.60a -1.94 -1.28a -2.93
lnECt 1 -2.31b -3.52 1 -2.35b -3.19 -1.82b -3.52
lnTRt 0
-2.90b
-3.52 0 -2.90b -3.19 -2.75b -3.52
∆lnYt 0 -6.14a -2.93 0 -2.41a -1.94 -6.18a -2.93
∆lnECt 0 -4.77b -3.52 0 -3.87b -3.19 -4.76b -3.52
∆lnTRt 1 -6.53b -3.52 1 -6.62b -3.19
-13.68 b
-3.52
Peru lnYt 1 -0.41a -2.93 1 -0.58a -1.94 0.87a -2.93
lnECt 1 -1.05a -2.93 1 -1.00a -1.94 -1.10a -2.93
lnTRt 0 -1.45a -2.93 0 -1.45a -1.94 -1.44a -2.93
∆lnYt 0 -3.79a -2.93 0 -3.83a -1.94 -3.77a -2.93
∆lnECt 0 -4.34a -2.93 0 -4.20a -1.94 -4.35a -2.93
∆lnTRt 0 -5.53a -2.93 0 -5.55a -1.94 -5.88a -2.93
Notes: a and b show the model with constant and constant-trend, respectively. The optimal lag
length is selected using SBC.
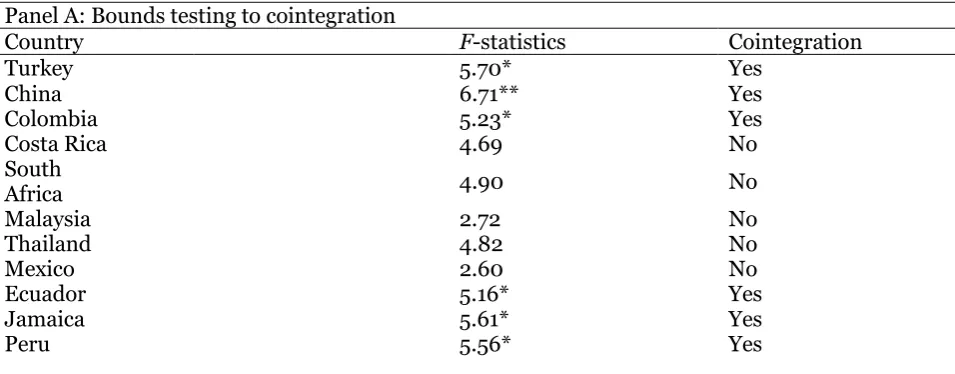
In order to empirically examine the existence of a long run relationship between the variables, the ARDL cointegration method is applied. The bounds test uses the joint F-statistic. The optimal lag selection is based on SBC. The cointegration results are reported in Table 3. The bounds-F test results show that there exists the long-run relationship among the variables because F-statistic (6.71) is higher than the UCB value (5.85) at the 5 % level in China. In addition, the results also show that that there exists the long-run relationship betweent the variables because
Table 3. The Results of Bounds F-test for Cointegration
Panel A: Bounds testing to cointegration
Country F-statistics Cointegration
Turkey 5.70* Yes
China 6.71** Yes
Colombia 5.23* Yes
Costa Rica 4.69 No
South
Africa 4.90 No
Malaysia 2.72 No
Thailand 4.82 No
Mexico 2.60 No
Ecuador 5.16* Yes
Jamaica 5.61* Yes
Peru 5.56* Yes
Panel B: Peseran et al. (2001) critical value bounds of the F-statistic: unristricted intercept and unrestrected trend
Significance level Lower bounds, I(0) Upper bounds, I(1)
1% 6.34 7.52
5% 4.87 5.85
10% 4.19 5.06
Panel C:
Diagnostic tests R2 Fstatistics - J-B normality Ramsey RESET ARCH LM B-G LM Turkey 0.82 10.98*** 2.24 (0.32) [2]: 0.14 [1]: 0.11 [2]: 0.12 China 0.72 2.72** 5.23 (0.07) [1]: 0.69 [1]: 0.13 [1]: 0.18 Colombia 0.68 2.33** 1.72 (0.42) [1]: 0.05 [1]: 0.54 [4]: 0.13 Costa Rica 0.85 4.16*** 1.26 (0.53) [1]: 0.00 [1]: 0.59 [1]: 0.46 South
Africa 0.74 4.39** 3.82 (0.14) [1]: 0.84 [1]: 0.72 [1]: 0.85 Malaysia 0.41 2.40** 1.54 (0.46) [1]: 0.00 [1]: 0.34 [1]: 0.38 Thailand 0.84 5.88*** 3.06 (0.21) [2]: 0.18 [1]: 0.84 [1]: 0.71 Mexico 0.79 7.49** 3.47 (0.17) [1]: 0.88 [1]: 0.95 [1]: 0.97 Tunusia 0.58 3.14*** 1.44 (0.48) [1]: 0.37 [3]: 0.16 [1]: 0.51 Ecuador 0.79 2.81** 0.75 (0.68) [1]: 0.63 [1]: 0.27 [1]: 0.55 Jamaica 0.81 4.60*** 7.93 (0.01) [1]: 0.79 [1]: 0.29 [1]: 0.88 Peru 0.68 7.35*** 1.52 (0.46) [3]: 0.05 [1]: 0.27 [1]: 0.25
Notes: Figures in parentheses are probabilities. ***, ** and * denote the significant at 1 %, 5 % and
10 % level of significance, respectively.
The results of cointegration test used in the study indicate that the VECM Granger causality method can be used to examine the causal linkages between the variables for Turkey, China, Colombia, Malaysia, Ecuador, Jamaica and Peru.
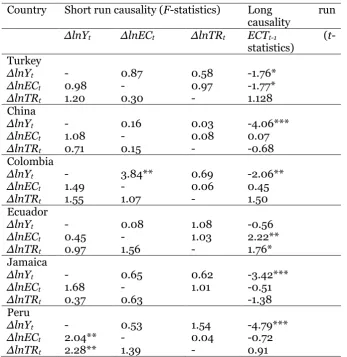
The results of VECM Granger causality method are reported in Table 4. The results indicate that there exists the long-run bi-directional causality between economic growth and energy consumption in Turkey. In the long run, trade openness causes energy consumption and economic growth in Turkey. The results also indicate the presence of the long-run uni-directional causality from energy consumption and trade openness to economic growth in China, Colombia, Jamaica and Peru. For Ecuador, the bi-directional causality between energy consumption and trade openness is determined in the long run. It is also found that in the long run economic growth causes energy consumption and trade openness in Ecuador.
Table 4. The Results of VECM Granger Causality Analysis
Country Short run causality (F-statistics) Long run causality
∆lnYt ∆lnECt ∆lnTRt ECTt-1 (t
-statistics) Turkey
∆lnYt - 0.87 0.58 -1.76*
∆lnECt 0.98 - 0.97 -1.77*
∆lnTRt 1.20 0.30 - 1.128
China
∆lnYt - 0.16 0.03 -4.06***
∆lnECt 1.08 - 0.08 0.07
∆lnTRt 0.71 0.15 - -0.68
Colombia
∆lnYt - 3.84** 0.69 -2.06**
∆lnECt 1.49 - 0.06 0.45
∆lnTRt 1.55 1.07 - 1.50
Ecuador
∆lnYt - 0.08 1.08 -0.56
∆lnECt 0.45 - 1.03 2.22**
∆lnTRt 0.97 1.56 - 1.76*
Jamaica
∆lnYt - 0.65 0.62 -3.42***
∆lnECt 1.68 - 1.01 -0.51
∆lnTRt 0.37 0.63 -1.38
Peru
∆lnYt - 0.53 1.54 -4.79***
∆lnECt 2.04** - 0.04 -0.72
∆lnTRt 2.28** 1.39 - 0.91
Notes: The model with constant is used for causality analysis. The optimal lag length is selected
using SBC. ***, ** and * denote the significant at 1 %, 5 % and 10 % level of significance, respectively.
6. Conclusion
In recent years, the relationship between energy, trade and economic growth has been significantly discussed by theoretical and empirical studies. This study intensifies on the dynamic causal links among energy consumption, trade openness and economic growth for upper middle income countries over the period 1971-2014. After examining the unit root analysis, The ARDL bounds test is used to investigate cointegration between the variables. The Granger causality test based on VECM approach is also applied to examine the causal links between the variables.
The unit root test results show that the variables used in the study are integrated at I(1). This implies that the ARDL bounds test can be employed to examine the presence of long run relationship between the variables. The ARDL bounds test results show that there exists cointegration between the variables in Turkey, China, Colombia, Ecuador, Jamaica and Peru. The VECM Granger causality results show that there exists the long-run bi-directional causality between economic growth and energy consumption in Turkey. In the long run, trade openness causes energy consumption and economic growth in Turkey. The results also indicate the presence of the long-run uni-directional causality from energy consumption and trade openness to economic growth in China, Colombia, Jamaica and Peru. For Ecuador, the bi-directional causality between energy consumption and trade openness is determined in the long run. It is also found that in the long run economic growth causes energy consumption and trade openness in Ecuador.
context, the governments should diversify energy resources and export partners to raise and sustain the rate of economic growth. For future research on the links between energy consumption, trade openness and economic growth, the number of countries and independent variables used in the study can be increased. In addition, more comparative analyses can be conducted. Finally, the long-run and short-run coefficients can be estimated through several econometric methods.
References
Arif, Ahmad, 2012 - Arif, A., Ahmad, H. (2012). Impact of Trade Openness on Output
Growth: Cointegration and Error Correction Model Approach. International Journal of Economics
and Financial Issues, 2(4), 379–385.
Asafu-Adjaye, 2000 – Asafu-Adjaye, J. (2000). The Relationship between Energy
Consumption, Energy Prices and Economic Growth: Time Series Evidence from Asian Developing Countries. Energy Economics, 22(6), 615–625.
Caraiani et al., 2015 – Caraiani, C., Lungu, C.I., Dascalu, C. (2015). Energy Consumption
and GDP Causality: A Three-step Analysis for Emerging European Countries. Renewable and
Sustainable Energy Reviews, 44, 198–210.
Dickey, Fuller, 1981 – Dickley, D.A., Fuller, W.A. (1981). Likelihood Ratio Statistics for
Autoregressive Time Series with a Unit Root. Econometrica, 49(4), 1057–1072.
Engle, Granger, 1987 – Engle, R.F., Granger, C.J.(1987). Cointegration and Error Correction
Representation, Estimation and Testing. Econometrica, 55(2), 251–278.
Frankel, Romer, 1999 – Frankel, J.A., Romer, D. (1999). Does Trade Cause Growth?
The American Economic Review, 89(3), 379–399.
Gjali, El-Sakka, 2004 – Ghali, K.H., El-Sakka, M.I.T. (2004). Energy Use and Output Growth
in Canada: A Multivariate Cointegration Analysis. Energy Economics, 26(2), 225–238.
Glasure, Lee, 1997 – Glasure, Y.U., Lee, A.R.(1997). Cointegration, Error Correction, and the
Relationship between GDP and Energy: The Case of South Korea and Singapore. Resource and
Energy Economics, 20(1), 17–25.
Hassan, 2005 – Hassan, A.F.M.K. (2005). Trade Openness and Economic Growth: Search
for a Causal Relationship. South Asian Journal of Management, 12(4), 38–51.
Gries, Redlin, 2012 – Gries, T., Redlin, M. (2012). Trade Openness and Economic Growth:
A Panel Causality Analysis. Centre for International Economics, Working Paper No. 06, 1–19.
Hsiao, 1987 – Hsiao, M.W. (1987). Tests of Causality and Exogeneity between Export Growth
and Economic Growth. Journal of Economic Development, 12, 143–159.
Jung, Marshall, 1985 – Jung, W., Marshall, P. (1985). Exports, Growth and Causality in
Developing Countries. Journal of Development Economics, 18(1), 1–12.
Johansen, Juselius, 1990 – Johansen, S., Juselius, K. (1990). Maximum Likelihood
Estimation and Inference on Cointegration with Application to the Demand for Money”. Oxford
Bulletin of Economics and Statistics, 52(2), 169–210.
Katırcıoğlu et al., 2016 – Katırcıoğlu, S., Fethi, S., Kalmaz, D.B., Cağlar, D. (2016).
Interactions between Energy Consumption, International Trade, and Real Income in Canada: An Empirical Investigation from a New Version of the Solow Growth Model. International Journal
of Green Energy, 13(10), 1059–1074.
Kraft, Kraft, 1978 – Kraft, J., Kraft, A. (1978). On the Relationship between Energy and GNP.
Journal of Energy and Development, 3(2), 401–403.
Krugman, 1979 – Krugman, P.R. (1979). Increasing Returns, Monopolistic Competition and
International Trade. Journal of International Economics, 9, 469–479.
Kumar et al., 2015 – Kumar, R.R., Stauvermann, P.J., Loganathan, N., Kumar, R.D. (2015).
Exploring the Role of Energy, Trade and Financial Development in Explaining Economic Growth in South Africa: A Revisit. Renewable and Sustainable Energy Reviews, 52, 1300–1311.
Kyophilavong et al., 2015 – Kyophilavong, P., Shahbaz, M., Anwar, S., Masood, S. (2015).
The Energy-growth Nexus in Thailand: Does Trade Openness Boostup Energy Consumption?.
Renewable and Sustainable Energy Reviews, 46, 265–274.
Lee, 2005 – Lee, C.C. (2005). Energy Consumption and GDP in Developing Countries:
Masih, Masih, 1998 – Masih, A.M.M., Masih, R. (1998). A Multivariate Cointegrated Modeling Approach in Testing Temporal Causality between Energy Consumption, Real Income and Prices with an Application to two Asian LDCs. Applied Economics, 30(10), 1287–1298.
Okuyan, Ozun, 2012 – Okuyan, H.A., Ozun, A. (2012). Trade Openness and Economic
Growth: Further Evidence without Relying on Data Stationarity. International Journal of
Commerce and Management, 22(1), 26–35.
Pesaran et al., 2001 – Pesaran, M.H., Shin, Y., Smith, R.J. (2001). Bounds Testing
Approaches to the Analysis of Level Relationship. Journal of Applied Economics, 16(3), 289–326.
Pesaran, Shin, 1999 – Pesaran, M., Shin, Y. (1999). An Autoregressive Distributed Lag
Modeling Approach to Cointegration Analysis, In: Strom, S. (Ed.), Econometrics and Economic Theory in the 20th Century: The Ragnar Frisch Centennial Symposium. Cambridge University Press, Cambridge.
Phillips, Hansen, 1990 – Phillips, P.C.B., Hansen, B. (1990). Statistical Inference in
Instrumental Variables Regression with I(1) Processes. Review of Economic Studies, 57(1), 99–125.
Phillips, Perron, 1988 – Phillips, P.C.B., Perron, P. (1988). Testing for a Unit Root in Time
Series Regression. Biometrika, 75(2), 335–346.
Shahbaz et al., 2013 – Shahbaz, M., Khan, S., Tahir, M.I. (2013). The Dynamic Links
between Energy Consumption, Economic Growth, Financial Development and Trade in China: Fresh Evidence from Multivariate Framework Analysis. Energy Economics, 40, 8–21.
Sharmin, Khan, 2016 – Sharmin, F., Khan, M.R. (2016). A Causal Relationship between
Energy Consumption, Energy Prices and Economic Growth in Africa. International Journal of
Energy Economics and Policy, 6(3), 477–494.
Soytas, Sari, 2003 – Soytas, U., Sari, R. (2003). Energy Consumption and GDP: Causality
Relationship in G-7 Countries and Emerging Markets. Energy Economics, 25(1), 33–37.
Stensnes, 2006 – Stensnes, K. (2006). Trade Openness and Economic Growth:
Do Institutions Matter? Norwegian Institute of International Affairs, Paper No. 702, 1–66.
Stern, 2000 – Stern, D. (2000). A Multivariate Cointegration Analysis of the Role of Energy
in the US Macroeconomy. Energy Economics, 22(2), 267–283.
Stock, Watson, 1993 – Stock, J.H., Watson, M.W. (1993). A Simple Estimator of
Cointegrating Vectors in Higher Order Integrated Systems. Econometrica, 61(4), 783–820.
World Bank, 2016 – World Bank (2016). World Development Indicators, Washington, DC.
Yu, Choi, 1985 – Yu, S.H., Choi, J.Y. (1985). The Causal Relationship between Energy and