https://doi.org/10.3926/jiem.3031
Top Management Role in Improving the State of QMS
under the Influence of Employee’s Involvement:
Best Practice from the Food Processing Industry
Marija Stanojeska1 , Robert Minovski2 , Bojan Jovanoski2 1QC, QA & RD Manager, Nipromteks Ltd Skopje (Macedonia) 2Faculty of Mechanical Engineering. Ss. Cyril and Methodius University (Macedonia)
[email protected], [email protected], [email protected]
Received: October 2019
Accepted: January 2020
Abstract:
Purpose: The role of the top management in Quality Management System (QMS) is undeniable and emphasized by many researchers. On the other hand, the employees’ involvement is recognized as one of the main prerequisites for improvement of QMS. Although investigated to a certain extent, the influence of the top management and the employees’ involvement on the successful transition from ISO 9001 QMS to Total Quality Management (TQM) is still a vague area especially when it comes to the dynamics of this process. The main objective of this paper is to analyze the dynamic transition of the QMS to TQM under the influence of the top management commitment and its stimulus of the employee’s motivation.
Design/methodology/approach: Such research purpose requires quantitative methodology with the System Dynamics (SD) in its core. The main steps of the methodology are the following: literature review, determination of the of the main influential factors (variables for the simulation model), design of the conceptual model, gathering data, design of the simulation model, experimentation with the simulation model and analysis and discussions of the findings. For the sake of determination of the main influential factors, survey of 82 companies in the Macedonian food processing industry was conducted.
Findings: As a result, the findings demonstrate how the top management can influence the state of QMS and implementation of TQM practices in a shorter period of time. In that sense, numerous experiments with SD moodel have been carried out and the most appropriate ratio of coefficient of commitment of top management has been determined.
Research limitations: Although the survey was conducted in the Macedonian food industry, the respondents were only on the managerial level and the model encompasses limited number of factors, the research gives the general directions for enlightening the QMS transition process towards TQM.
Originality/value: This paper offers a definition of the quantitative levels of development of the QMS to TQM through QMS Maturity Matrix as an essential prerequisite for dynamic analysis of this transition process under the influence of employees’ motivation. The designed simulation model represents a platform for better understanding of this process and better decision making in direction of obtaining completion of this transition process in shorter period of time.
To cite this article:
Stanojeska, M., Minovski, R., & Jovanoski, B. (2020). Top management role in improving the state of QMS under the influence of employee’s involvement: Best practice from the food processing industry. Journal of Industrial Engineering and Management, 13(1), 93-119. https://doi.org/10.3926/jiem.3031
1. Introduction
The requirement for Quality Management System (QMS) in the organizations is widely accepted and undisputable. Despite all reported problems and difficulties in their implementation (Solomon, Bester & Moll, 2017), complemented by the inability to always confirm the link between the success of the organization and QMS (Pérez & Gutiérrez, 2013; Solomon et al., 2017; Fonseca, Domingues, Machado & Calderon, 2017), their importance is not questioned. What is called into question are the ways of implementation, especially connected with the motives for QMS implementation (Martínez-Costa, 2008; Psomas & Fotopoulos, 2009; Magd, 2008; Oliveira, Correa, Balestrassi, Martins & Turrioni, 2017).
It is widely accepted that QMS based on the ISO 9001 (as globally most spreaded QMS) is a good starting point for introducing the quality in the organizations (Psomas & Fotopoulos, 2009; Oliveira et al., 2017; Karapetrovic, Casadesus & Saizarbitoria, 2010; Larson & Kerr, 2007; Ilkay & Emre, 2012). However, they only give the structure of the QMS. So, in order to bring the essence to the QMS supplementary approaches like TQM, lean and others, have to be deployed (Mehrjerdi, 2011; Karthi, Devadasan, & Murugesh, 2011; Karthi, Devadasan, Selvaraju, Sreenivasa, & Sivaram, 2014). In other words, in order to support the qualitative growth of the QMS, additional different approaches have to be consulted and introduced. This fact brings ambiguity in defining the development stages of the QMS and their features in those stages.
Additionally, various factors for successful QMS implementation and its transition to more advanced levels are investigated (Respati & Ami, 2014; McLein, Antony & Dahlgaard, 2017; Oliveira et al., 2017). There are not many enigmas concerning that. Importance of the factors like, dedication of the top management, customer focus, process management …, remains as a focus in numerous researches (Koh & Low, 2010; Psychogios, Wilkinson & Szamosia, 2009; Das, Paul & Sweirczek, 2008; Tang & Wu, 2010; Chang, Chiu & Chen, 2010; Mardani & Kazemilari 2012; Andersson, 2011; McLein et al., 2017). Employees’ motivation and involvement are among the most reported influential factors (Jurburg, Viles, Tanco & Mateo, 2016; Bakotic & Rogosic, 2015; Chang et al., 2010; Psychogios et al., 2009; Dubey & Bansal, 2012; Swartling & Poksinska, 2013; Khan, 2011; Das et al., 2008; Pheng & Teo, 2004; Yasamis, Arditi & Mohammadi 2002;). Yet, most of these analyses are of static nature, depicting the state of the QMS in certain momentum of its development. Analysis of the dynamic development of the QMS still represents a quite vague research area. The reasons behind are numerous. The most important ones could be found in the complexity of the process of QMS implementation, as well as, its time-consuming aspect due to the numerous influential factors and especially their interdependencies, the different understanding about development stages of the QMS and its associated characteristics.
philosophy to the employees and involve them in improvement activities. On the other hand, the employees’ motivation through their participation in the improvement of the QMS influences the commitment of the top management to further invest in its improvement (Khan, 2011). In doing so, only by brief analysis of just two influential factors, one can come to a closed loop situation where both factors have impact on each other, as a clear example how the interdependences of the influential factors contribute to the complexity of the development process of QMS.
Despite all aforementioned challenges, the need connected with the analysis of the QMS dynamic development becomes more and more significant. Namely, in today’s dynamic environment, where time often plays the most important role, it is particularly essential to plan the dynamics of the development of every system, including the QMS. It is simply not enough to create a good QMS. It is at least equally important to create it as soon as possible. One of the most widely used approaches for coping with dynamics of the systems is the SD. It is a simulation approach that enables the design of models which recognizes the essence of dynamic behavior in complex systems (Sterman, 2000). In that direction, SD can be used as a powerful tool to create models that actually represent a true picture of the interconnectedness between the influencing factors in QMS and TQM. Implementation of SD in QMS and TQM area is nothing new (Bauer, Reiner, & Schomschule, 2000; Khanna, Vrat, Shankar, & Sahay, 2004). The application of dynamic models in TQM organizations allows managers to make decisions for long-term success in operation (Bauer et al., 2000). Nevertheless, the analysis of the dynamic transition of initial levels of QMS towards their advanced levels is still not well investigated area.
To sum up, the design of QMS is a complex and time-consuming process and the dynamics of its development is yet to be researched. Although investigated to certain extent, the influence of the top management and the employees’ motivation and involvement on the successful development of QMS is still a vague area, especially from the dynamic point of view. In that direction, the main research challenge presented in this paper is to analyze the dynamic transition of the QMS to TQM under the influence of the top management commitment and its stimulus of the employee’s motivation. In this research, SD has been utilized for deriving better understanding on how to handle the transition phases of the QMS. In order to simplify the process and obtain more reliable outputs, this research is focused on the Macedonian food processing industry, as a good example for a small developing country. The paper is structured as follows. In the following section, literature review that covers the relationship among QMS, top management commitment, employee motivation and their involvement in quality improvement and application of SD methodology is presented. The literature review is followed by the section where the theoretical framework and research methodology are explained. The next section deals with the results and discussion of the research where the conceptual model, the dynamic model and derived experiments are presented. At the end, the main conclusions and recommended directions for future research are discussed.
2. Literature Review
The defined objectives guide the research in several areas: QMS and its transition to TQM, influential factors, employee motivation and involvement and application of SD approach in the area of QMS.
2.1. QMS and its Transition to TQM
and could be provided as decisive as a mediating variable for ISO 9000 towards the Company Performance (Respati & Ami, 2014; McLein et al., 2017). The state which structured the quality and process improvement approaches, started with the development of Lean Manufacturing, Six Sigma, and Lean Six Sigma (Pfeifer et al., 2004; Mehrjerdi, 2011; Aboelmaged, 2010; Smith, 2003; Karthi et al, 2011; Dahlgaard & Dahlgaard-Park, 2006). TQM implies an all-encompassing, quality focused management approach for providing products and services that satisfy customer requirements (Kuo, Chang, Hung & Lin, 2009; Al-Ababneh, 2014). Prajogo and Sohal (2006) have used the six criteria of TQM practices identified by the MBNQA, which include: leadership, strategic planning, customer focus, human resource management, process management and information and analysis. The synthesis of the principles of the TQM proponents in studies has yielded eight possible elements to perceive the TQM spirit (Koh & Low, 2010): customer management, supplier management, quality information management, process management, organizational learning, continuous improvement, top management commitment and people management. The breaf literature review related to each of the TQM elements i.e. influental factors is following.
2.2. Influential Factors
focus on performance of the employees and incentives that can contribute toward their performance and their operations’ productivity (Brewer & Selden, 2000).
2.3. Employee Motivation and Involvement
In that direction, the literature review of employee motivation factors is carried out. According to Respati and Ami (2014), employee behavior, such as quality awareness, employee competence and motivation to create quality products, becomes a strategy to improve organizational performance. The inclusion of employees gives them an opportunity to improve their personal abilities, to gain appropriate knowledge, to increase their confidence, to express the individual creativity and to participate in solving specific problems (Bakotic & Rogosic, 2015; Rice, 1993; Chang et al., 2010; Psychogios et al., 2009; Dubey & Bansal, 2012; Swartling & Poksinska, 2013; Pool, 2000; Saraph et al., 1989; Ahire et al., 1996; Agus, 2005; Chase, 1993; Yasamis et al., 2002; Black & Porter, 1996; Koh & Low, 2010). Managers in business organizations face challenges of managing motivational factors of their employees by satisfying their personal and career needs in order to enhance their job performance (Alonso & Lewis, 2001; Swartling & Poksinska, 2013; Mohsan, Nawaz, Khan, Shaukat & Aslam, 2011; Dubey & Bansal, 2012). In order to improve the product quality, the employees need to improve their skills (Chowdhury, Paul & Das, 2007; Kappelmen & Prybutok, 1995). Regarding to Milne (2007), employees want to be noticed and recognized for their work. The top management roles should include initiating and devising credible reward systems that recognize employees’ contributions to total quality objectives (Ugboro & Obeng, 2000; Nohria, Groysberg & Lee, 2008; Manzoor, 2011; Aselstine & Alletson, 2006; Daily, 2003; Govender & Parumasur, 2010). According to Manzoor (2011), the more the employees are empowered for tasks accomplishment, the higher the organizational performance and the success. Personal coaching process focused on broadening employees’ knowledge and skills can represent opportunities for individual growth and development and results in advantageous outcomes such as more proficient team-related skills, increased workforce flexibility and enhanced employee involvement (Leitch, Nieves, Burke, Little & Gorin, 1995; Choo & Bowley, 2007; Sultan, 2012). The opinions of Jayaweera (2015) and Korzinsky (2013), are that the environmental conditions significantly affect job performance. The attitude of Nohria et al. (2008) is that the employee motivation can be improved by creating jobs that are meaningful, interesting, and challenging within the company. According to Aarabi (2013), employees consider the condition of job security just at the beginning of their careers so as to feel confident about the future. The paper of Latham and Locke (2006) explains that the employees are motivated to fulfill the objectives of the organization, anchored in the individual plans. Speaking about motivation, it has to be stressed that employees are extremely motivated to achieve goals if they know that advancement awaits them (Kerestesova, 2012). Many of authors are focused on the following motivation factors: teamwork (Daily, 2003; Osterloh, Frost & Frey, 2002; Pieterse, 2013), respect (Maslow, 1954), well-being (Lu, 1999; Shepherd, Haynie & Patzelt, 2013), trust (Jafri, 2012; Manzoor, 2011), autonomy and skill variety (Sultan, 2012; Osterman, 1994), job satisfaction (Elias, Smith & Barney, 2012; Christ, Emett, Summers & Wood, 2012; Chang et al. 2010), etc.
2.4. Application of SD Approach in the Area of QMS
In the reviewed papers the assumption suggests that the introduction of ISO 9001 is a precondition for transition into TQM and the motivation of the employees has a positive impact on improving the state of QMS. The SD methodology can be used for deriving better insight to handle the transition phases of QMS through optimal management of employee motivation. Still, no papers with designed SD model of the transition from ISO 9001 towards TQM depending on the motivation of the employees have been met.
3. Theoretical Framework of the Research
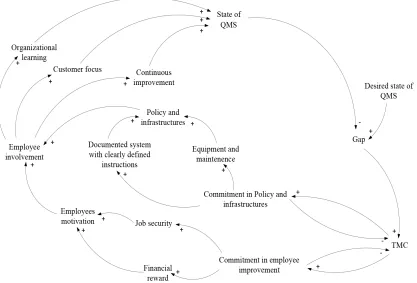
The theoretical model of this research is presented in Figure 1.
Figure 1. The theoretical model of the research
This theoretical model is aligned with the research objective – to investigate the influence of top management on the state of QMS, through optimal management of employees’ motivation. The research methodology, designed to encompass this theoretical framework and to fulfill the research objective consists of the following steps: (I) Literature review of the most influential factors on the EM and on the state of the QMS, and the means of influence of TMC on the state of the QMS, (ii) Determination of the variables for the simulation model, (iii) Design of the conceptual model, (iv) Gathering data, (v) Design of the simulation model, (vi) Experimentation with the simulation model and (vii) Analysis and discussions of the findings (accepting or rejecting the hypothesis). There are several main challenges that this research is faced with: (1) selection of the most influential factors on EM, (2) selection of the most influential factors on TQM (state of the QMS), (3) means of influence of TMC on the state of the QMS, particularly concerning the dynamic analysis, (4) determination of the levels of QMS and the way of their presentation and (5) conditions for transition from one level to another.
process management, supplier management, quality information management, organizational learning, customer focus and continuous improvement, as influential factors on TQM as well as policies and infrastructures and motivation of employee, as means of influence of TM on the state of the QMS. These numerous factors needed to be connected logically, which required a lot of analysis and iterations.
Aiming to create a functional SD model, with the limited resources that were available, the initial pool of the influential factors was reduced on the basis of the performed survey. The survey was conducted with the food processing industry in Macedonia. Namely, according to legal requrement, the operation of any Macedonian food processing organization is based on valid food safety system. Moreover, the participation of food industy in GDP of the country is about 15.87% (GDP, News Release from 2017, State Statistical Office, Republic of Macedonia).
The questionnaire (which will be explained later in the 4.1 Data Collection from the survey Section) was designed to gather data connected with the QMS, means of influence of TM on the status of the QMS, policies and infrastructures, motivation of employee and TQM factors. The responders had to evaluate the importance of each of the influential factors. In doing so the influential factors on EM were limited to two - job security and reward; the influential factors on TQM were limited to three issues- organizational learning, customer focus and continuous improvement; the means of influence of the TQM on the state of the QMS were limited to two: policies and infrastructures and motivation of employee. In the following stage, on the basis of the previously mentioned solutions the conceptual model (which will be explained below) was designed.
The fourth challenge deals with the problem of transferring the qualitative/descriptive knowledge into the quantitative one. One of the first such attempts in the field of quality was the Crosby’s Quality Management Maturity Grid (Crosby, 1979). In the field of software system and development issues, the Capability Maturity Model - CMM (Paulk, Weber, Garcia, Chrissis & Bush, 1993) was introduced. Similar approach can be found in Product Life Cycle Management (PLM), (Saaksvuori & Immonen, 2005). Based on that successful experience of quantification of qualitative knowledge, in this research a particular QMS Maturity Model with five levels was designed (Table. 1). This model contains matrix that describes the mentioned five levels of QMS maturity on the basis of several criteria, such as: commitment to quality, application of tools for quality control and quality improvement (SPC, Lean, Six Sigma), orientation towards customer, application of organizational learning etc.
The fifth challenge – the transition from one level to another, was also treated within the aforementioned survey. In doing so, this research and its findings are limited to the Macedonian food processing industry (to epitomize a small developing country), but can still indicate the general directions concerning its main objective.
In order to investigate the dynamic aspect of the problem, the simulation model (which will be explained later in the 4.3 Dynamic model structure), was developed and experimentation was performed. These experiments had to prove or reject the main hypothesis of this research:
H1: The top management through optimal management of employee involvement can positively influence the status of the QMS.
This main hypothesis is induced in accordance to the theoretical framework given in Figure 1. This main hypothesis generated an additional hypothesis:
I level
The organization has a documented system that is not implemented in practice.
The politics and documentation concerning the QMS are not aligned with the practical environment in the organization (the triggers for the implementation of the QMS were external – the organization needs only the quality certificate).
There is no connection between the rewarding system and the functioning of the QMS. There is a big employee turnover which leads in low motivation of the employees.
The employees are doing their tasks according their own experience and knowledge, not according to the working instructions and are not interested in improving the existing QMS.
All these result in the following:
• There is no sign of organizational learning.
• The customer complaints are rarely even recorded. Organization does not make statistical analysis of the complaints and does not act proactively on them – it acts on them case by case, when there is a legal treat. • The continuous improvement is not implemented.
II level
The organization has a documented system that is partially implemented in practice.
Certain steps in aligning the politics and documentation concerning the QMS with the practical environment in the organization are undertaken. The first efforts are usually done in production function.
There are certain connections between the rewarding system and the functioning of the QMS (isolated cases of rewards – the managers heuristically make the decisions). There are signs for connecting the employee performance with the job safety (key performance employees are treated with certain respect) which leads to a bigger motivation of the employees.
The employees are starting to do their tasks according the QMS, especially in production and show initial and partial interest for improving the existing QMS.
All these result in the following:
• Spreading the knowhow and the knowledge through the organization is on individual basis.
• The customer complaints are recorded. Organization does not make statistical analysis of the complaints and does not act proactively on them.
• There are individual initiatives, but the continuous improvement is not implemented as a system.
III level
The organization has a documented system that is generally implemented in practice.
Politics and documentation concerning the QMS are generally aligned with the practical environment in the organization, especially in the main processes. Still, there is a lot of improvement space in the auxiliary processes. There is systematic connection between the rewarding system and the functioning of the QMS. The employees are generally doing their tasks according the QMS.
All these result in the following:
• There is an initial system for organizational learning.
• The customer complaints are recorded. Organization does statistical analysis of the complaints but does not act proactively on them in all cases.
• There is an implemented continuous improvement system.
IV level
The organization has established an advanced quality system.
Politics and documentation concerning the QMS are fully aligned with the practical environment in the whole organization.
Employees have every opportunity to develop their skills. They have performance development plans. Concepts of job rotation and job enlargement are introduced. The concept of employee complaint is also introduced. There are efforts in direction of employee retention.
All these result in the following:
• The systemic thinking has been implemented in organization.
• The collected data from market research have been used for improving the quality of products and increasing customer satisfaction.
V level
The organization has a QMS which is treated as a “living organism” – always adopting on external and internal changes and demands.
The employees feel the “ownership” over the politics and documentation of the QMS which leads in their continuous optimization.
The rewarding system is totally aligned with the employee performance, including their efforts for suggestions for improvement, efforts for proactive actions, etc. There are different reward schemes (e.g. employee share ownership), which (in some cases) makes the employees partially the owners of the company. Besides the concepts of job rotation and job enlargement, also the concept of job empowerment is introduced.
All these result in the following:
• There is a common platform for exchanging experience and knowledge through the organization. • There is a fully functional CRM system.
• Every employee participates in the CI on a daily basis. There is open-door-policy for ideas.
Table 1. QMS maturity matrix
4. Results and Discussion
The conducted research encompassed (I) data collection from a survey in order to detect the most influential factors and to quantify of certain elements in the simulation model and (II) development of a simulation model to experiment with different influential factors concerning the htpothesis. The survey was designed parallely with the conceptual model in order to extract answers and quantifications that were demended for the model. The discussion of the results is based on the behavior of the simulation model and the generated output data.
4.1. Data Collection from the Survey
The questionnaire with a total of 28 items was designed to gather data from subjects on the six studied variables. It was developed based on the practices for conducting a survey, Neuman (2014). The questionnaire was reviewed by academics and quality management professionals. It includes eight items positioned in 3 sections: (A) referring to QMS, (B) covering TQM practices and (C) referring to employee motivation, policies and infrastructures, as a means of influence of TM on the state of the QMS. General data were gathered at the start of the questionnaire, including type of food processing, type of certificate, number of employees in the organization and responder position.
In section (A) five levels QMS maturity matrix were defined, Table 1. The responders were asked to evaluate the period for transition between each level of the QMS maturity matrix. Furthermore, in section (B) three TQM factors: organizational learning, customer focus and continuous improvement were considered. The significance of each of them and the period for their improvement were assessed by responders. Besides that, in section (C) nine motivational factors: reward systems, recognition, training, empowerment, work environment, attractive job, job security, goal settings and professional growth and five policy and infrastructures factors: appropriate documented system with clearly defined working instructions, availability of quality data, methods, information technology, equipment and maintenance were considered. Responders were asked to indicate the level of significance of employees’ motivation and policies and infrastructures factors using the following five-point scale: 1- poor significance, 2- below average significance, 3- average significance, 4- very good significance, 5- excellent significance.
respondents of this study were quality managers (49%), production managers (26%) and directors (25%). It has to be stressed that they can have different perception compared to the employees. This issue can be considered as direction for further research.
From the first overview of the collected data with the questionnaire one can conclude that the all treated motivational factors generally have an impact on the employee motivation, but job security and rewarding are evaluated as the most influential factors concerning the employees’ motivation for employees’ involvement. Besides that, in terms of improvement of policy and infrastructures, the interviewers indicate that all of the factors have a significant impact; however, the documented system with clearly defined working instructions, appropriate equipment and its maintenance are selected as the most influential factors.
4.2. Design of the Conceptual Model
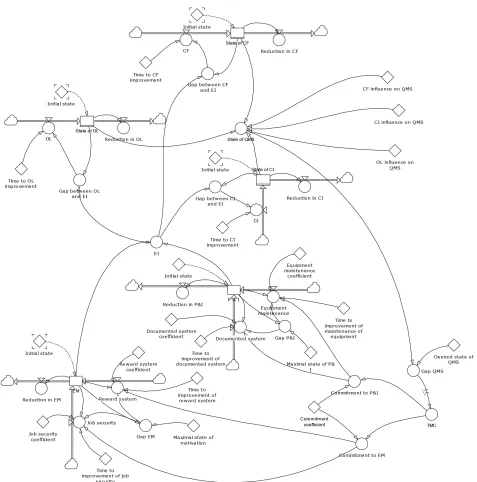
The basic conceptual model is designed with the identified critical factors: top management commitment, employee involvement, customer focus, organizational learning, continuous improvement, policy and infrastructures (through documented system with clearly defined working instructions, appropriate equipment and maintenance) and employee motivation (through job security and financial reward) and presented on Figure 2.
Figure 2. Conceptual model of the improvement of the state of QMS
Top management or even more precisely, top management commitment (TMC) is widely accepted as a main influential factor for the state of the QMS. Namely, top management has to develop organizational climate to satisfy and empower employees in direction of overall quality and customer satisfaction (Ugboro & Obeng, 2000; Cheng & Chan,1999; Malik & Danish, 2010; Kappelman & Prybutok, 1995; Das et al., 2008; Kanji, 1998; Sultan, 2012).
employee motivation are financial reward and job security. In accordance to this viewpoint is also research presented by Aselstine and Alletson (2006), Hao (2000), Rice (1993), Ijaz, Kee and Irfan (2012), Daily (2003), Govender and Parumasur (2010), Manzoor (2011), Nohria et al. (2008), Aarabi (2013).
EM has strong influence on EI (Govender & Parumasur, 2010; Daily, 2003; Das et al., 2008) and together with policy and infrastructure (Choo & Bowley, 2007; Kimutal, Gachunga, Wanja, & Gichuhi, 2013; Jaafreh, 2013) have the dominant impact on EI.
On the other hand, EI influences:
• OL (Koh & Low, 2010; Senge, 1990; Pool, 2000; Malik & Danish 2010; Edmondson & Moingeon, 1999; Andersson, 2011; Barson et al., 2000; McLaughlin et al., 2008; Sila & Ebrahimpour, 2002; Black & Porter, 1996; Sisnuhadi, 2014; Tamayo-Torres & Gutiérrez, 2016; Das et al.. 2008; Pool, 2000; Ugboro & Obeng, 2000; Hays & Hill, 2001; Hao & Yunlong, 2013; Lagrosen, 2017),
• CF (Latif, 2014; Kuo et al., 2009, Oakland, 1995; Flynn et al., 1994; Ahire et al., 1996; Chase, 1993; Yasamis et al., 2002; Black & Porter, 1996; Sisnuhadi, 2014; Koh & Low, 2010; Piskar, 2007; Hao, 2000; Hackman & Wageman, 1995; Mardani & Kazemilari, 2012; Dubey & Bansai, 2012; Somlea, Marian & Ferencz, 2014; Anil & Satish, 2017; Ijaz et al., 2012) and
• CI (Khan, 2011; Das et al., 2008; Pheng & Teo, 2004; Juran, 1995; Powell, 1995; Anderson et al., 1994; Crosby, 1979; Chase, 1993; Yasamis et al., 2002; Black & Porter, 1996; Koh & Low, 2010; Sisnuhadi, 2014; Mardani & Kazemilari, 2012; Jurburg et al., 2016).
These three factors, together with process management, supplier management, quality information management, are the most significant determinants of the state of the QMS (Carmona-Márquez, Leal-Millán, Vásquez-Sánchez, Leal-Rodrígez & Eldridge, 2016; Ooi, 2012; Lewis, Pun & Lalla, 2006; Koh & Low, 2010; Zu, 2009; Psomas & Fotopoulos, 2009; Sisnuhadi, 2014;).
The gap between desired and actual state of the QMS is the main trigger of the top management for undertaking certain actions for improvement of the state of the QMS. Top management and its commitment generally depend on this mismatch. In other words, this gap should determine the level/intensity of the actions of the top management for improvement of the state of the QMS through aforementioned means.
4.3. Dynamic Model (Structure)
This section contains a description of the SD model. The model is consisted of 15 main variables presented in Conceptual model before (Figure 2.) and many additional variables. The purpose of additional variables is only a technical - to enable a reliable functioning of the dynamic model. The implication of the main variables and the dependencies between each of them are already approved through the research of literature sources (previously discussed in the literature review). All of the researched theoretical information is configured in the structured questionnaire. The responders in the conducted survey were managers committed to permanent, in real time, improvement of QMS in their firms. Nevertheless, the designed SD model is constructed on two grounds, theoretical knowledge and practical experience, linked between through the questionnaire. The dynamic model structure is present on Figure 3.
Figure 3. Dynamic model of the improvement of the state of QMS
4.4. Behavoiur of the Model
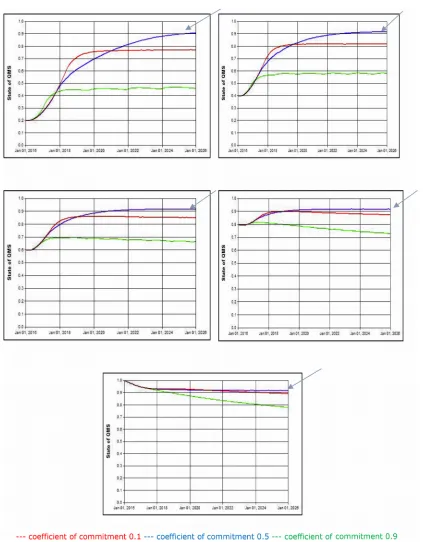
The commitment of top management is postulated and tested. Particularly, the commitment is spread in two directions, to improve the policy and infrastructures and to increase the employees’ motivation. In the introduced SD model, employee involvement strictly depends of their motivation. This means that acting on motivation’s drivers will allow managers to increase employee involvement and to improve the state of QMS in organization. Under these assumptions, the optimal commitment of top management to employees’ motivation is tested under varying percent of coefficient of commitment (value of commitment to EM), 10% and 90%, as a lower and higher values and 50% as a middle value of coefficient of commitment.
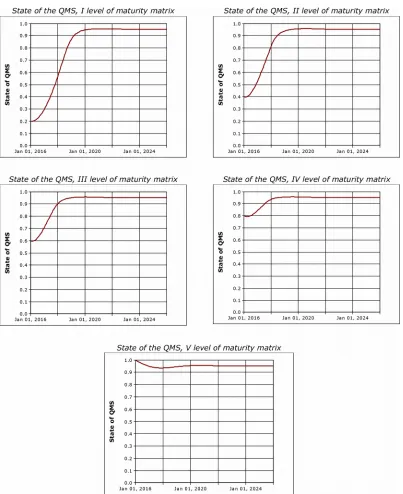
Figure. 4. Simulation results for state of QMS at each level of the maturity matrix
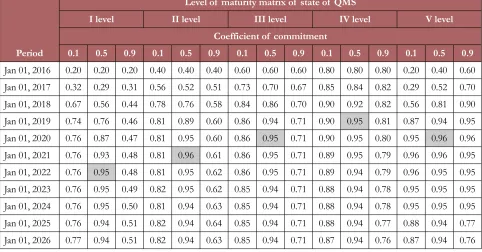
Period
Level of maturity matrix of state of QMS
I level II level III level IV level V level
Coefficient of commitment
0.1 0.5 0.9 0.1 0.5 0.9 0.1 0.5 0.9 0.1 0.5 0.9 0.1 0.5 0.9
Jan 01, 2016 0.20 0.20 0.20 0.40 0.40 0.40 0.60 0.60 0.60 0.80 0.80 0.80 0.20 0.40 0.60 Jan 01, 2017 0.32 0.29 0.31 0.56 0.52 0.51 0.73 0.70 0.67 0.85 0.84 0.82 0.29 0.52 0.70 Jan 01, 2018 0.67 0.56 0.44 0.78 0.76 0.58 0.84 0.86 0.70 0.90 0.92 0.82 0.56 0.81 0.90 Jan 01, 2019 0.74 0.76 0.46 0.81 0.89 0.60 0.86 0.94 0.71 0.90 0.95 0.81 0.87 0.94 0.95 Jan 01, 2020 0.76 0.87 0.47 0.81 0.95 0.60 0.86 0.95 0.71 0.90 0.95 0.80 0.95 0.96 0.96 Jan 01, 2021 0.76 0.93 0.48 0.81 0.96 0.61 0.86 0.95 0.71 0.89 0.95 0.79 0.96 0.96 0.95 Jan 01, 2022 0.76 0.95 0.48 0.81 0.95 0.62 0.86 0.95 0.71 0.89 0.94 0.79 0.96 0.95 0.95 Jan 01, 2023 0.76 0.95 0.49 0.82 0.95 0.62 0.85 0.94 0.71 0.88 0.94 0.78 0.95 0.95 0.95 Jan 01, 2024 0.76 0.95 0.50 0.81 0.94 0.63 0.85 0.94 0.71 0.88 0.94 0.78 0.95 0.95 0.95 Jan 01, 2025 0.76 0.94 0.51 0.82 0.94 0.64 0.85 0.94 0.71 0.88 0.94 0.77 0.88 0.94 0.77 Jan 01, 2026 0.77 0.94 0.51 0.82 0.94 0.63 0.85 0.94 0.71 0.87 0.94 0.76 0.87 0.94 0.76
Table 2. The distribution of the state of QMS depending on a different value of the coefficient of commitment
The simulation results of behaviour of the state of QMS at the values of coefficient of commitment of 0.1, 0.5 and 0.9, at II level of the maturity matrix are briefly discussed here. While the coefficient of commitment is 0.5, the state of QMS is significantly improved, unlike the results obtained in the simulation of the model when the coefficient of commitment is 0.1 or 0.9. The state of QMS achieved a maximum value of 0.96 after 5 years of improvement of QMS, which is not reached at I level of the state of QMS. Therefore, a comparison will be made between I level of maturity matrix, when the state of the QMS achieved value of 0.95 in 2022 and II level of maturity matrix, when the state of QMS achieved the same value (0.95), two years earlier (in 2020).
The state of QMS at III level of maturity matrix reached a maximum value of 0.86, while a coefficient of commitment is 0.1. In the scenario when coefficient of commitment is 0.9, the maximum value of the state of QMS is 0.71. It can be noticed that the highest value of the state of QMS (0.95) is accomplished at value of 0.5 of coefficient of commitment. Compared to previous case, while a coefficient of commitment is 0.5, the QMS level at the II level of maturity matrix in 2019 was 0.89, although the value of QMS status at III level of the state of QMS in the same year was 0.94. This is confirmation of the assumption that the period to implement the TQM practices is shorter, if the level of QMS is more advanced.
The same conclusion as in the previous cases can be repeated at the IV level of maturity matrix, precisely, the maximum values of the state of QMS are lower if the coefficient of commitment is 0.1 and 0.9, compared to simulation at coefficient of commitment of 0.5.
The simulation results at V level of the state of QMS represent a slight decrease of the curves. In the scenario when the coefficient of commitment is 0.1, the declining of the state of QMS is to the value of 0.89, while at coefficient of commitment is 0.9, the declining of the state of QMS is to the value of 0.89. The most stable state of QMS is achieved at coefficient of commitment of 0.5, because the declining of the state of QMS is to value of 0.94. The declining of the state of QMS is implied on reduction of the stocks in the SD model.
It can be concluded, that the improvement of QMS is quicker when the value of the coefficient of commitment is 0.5, compared to the extreme values of the coefficient of commitment (0.1 and 0.9).
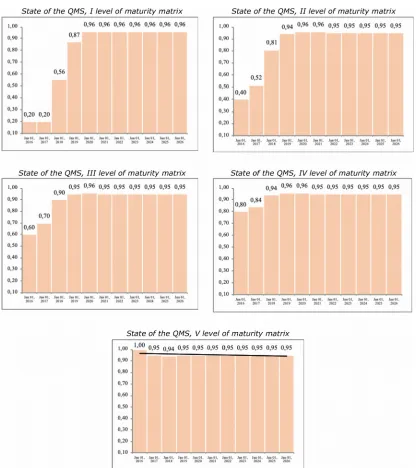
0.9; 1, for each of the five levels of maturity matrix of the state of QMS. The results of distribution of the variable are shown in Tables 3, 4, 5, 6 and 7 (Appendix).
The analysis of the simulations results indicates that the highest improvement of the state of QMS is obtained when the coefficient of commitment has the value of 0.4. This means the top management should distribute their commitment in the following relationship:
motivation of employees: policies and infrastructure = 40% : 60%.
In the graph below (Figure 5) the simulations of the state of QMS at value of coefficient of commitment is 0.4 are presented.
Figure 5. Simulation results for state of QMS at 0.4 coefficient of commitment, for all levels of the maturity matrix
Figure 6. Distribution of the state of QMS at 0.4 coefficient of commitment, for each of the levels of maturity matrix
4.5. Discussion of the Results
The comparison of the accomplished value of the state of QMS in the same period of time at different initial levels, confirms the assumptions that the achievement of the highest level of the quality system depends on the initial level of the state of QMS, meaning that if the initial level is more advanced, the period of implementation of TQM practices is shorter.
Furthermore, the results of the performed simulations indicate that the highest improvement of the state of QMS is obtained when the coefficient of commitment has the value of 0.4. That means that the top management has to direct 40% of their investments toward employee’s motivation and 60% toward policy and infrastructures.
Such optimal distribution of the investments allows improvement of the state of QMS in a shorter period of time. Additionally, the model represents only a simplification of a real quality management system.
• The SD model configuration includes only five of TQM critical factors: top management commitment, employees’ involvement, organizational learning and, customer focus and continuous improvement. Three remaining factors: process management, quality management information where as supplier management are not considered. The designed model consists of two motivation factors (reward system and job security) and two policy and infrastructure factors (equipment and maintenance and documented system with clearly defined instructions). There are a lot of possibilities for integrating additional factors, towards upgrading the model which can been in direction for further research.
• The functionality of the model is confirmed by alignment of the obtained simulation results and collected data of conducted survey. This is a confirmation that the model can be applied in the food processing in the Republic of Macedonia. On the other hand, that remains as one of the limitations of the model. Nevertheless, the limited application of the model can be overcome due to the potential of the model for easy adjustment and transformation into an applicable dynamic model in other industries.
5. Conclusion
This study has tried to highlight the correlations and the cause-and-effect interrelationships between the state of QMS, the top management commitment and the employees’ involvement in the Macedonian food processing industry. The top management has a crucial role in establishing quality policies, providing resources, stimulating involvement of the employees for successful operation of ISO 9001 and transition towards TQM. Therefore, the discussion in terms of initiatives towards implementation of new methodologies always starts from the top management but does not only depend on their commitment. The employees are the implementers and supporters of all ideas generated by the top management. The top management should actively communicate the company's philosophy to the employees and involve them in the TQM efforts and improvement activities. Therefore, the influence of employees's motivation in order to implement TQM practices is crucial and symbiotically linked with the top management.
For that purpose, many influential factors in the area of QMS, TQM and employees’ motivation have been researched and analyzed and the most relevant of them have been included in the conceptual model to explicate and understand those relations. The research of the influence of the employees’ involvement in the development of QMS, through optimal managing by top management has been conducted through a SD approach that has allowed to build a model structure in which those variables influence one another.
The model simulations have revealed the importance of those factors: the state of QMS, top management commitment, employee involvement, policies and infrastructures, employees’ motivation, organizational learning, customer focus etc. The structured model emphasizes how each of those factors could contribute in increasing the state of QMS. However, some limitations of the model, must be taken into consideration, mainly generated from the selection of the critical factors derived from the wide base of the influential system (process of simplification). The simulations of different scenarios depending on the value of the coefficient of commitment are performed as well. Specifically, the coefficient of commitment represents a ratio of top management investments to improve the policies and infrastructures and top management investment to increase the motivation of the employees. A diverse value of coefficient of commitment generates various scenarios of improvement of the state of QMS. The SD model can be used to make decisions to handle the transition phases of QMS through optimal management of employees’ motivation.
In sum, the model represents a kind of a platform for further analysis in direction of improvement the QMS towards the TQM under the influence of employees’ motivation. The methodology of designing of the dynamic model is based on the research carried out in the food processing industry. Yet, the dynamic model can be applied in all area of processing, by means of tailoring the values of some of the variables.
Acknowledgements
A Data Availability Statement
The data that support the findings of this study are openly available in https://doi.org/10.5937/jaes14-9580
Declaration of Conflicting Interests
The authors declared no potential conflicts of interest with respect to the research, authorship, and/or publication of this article.
Funding
The authors received no financial support for the research, authorship, and/or publication of this article.
References
Aarabi, M.S. (2013). Relationship between Motivational Factors and Job Performance of Employees in Malaysian Service Industry. Asian Social Science, 9, 301-310. https://doi.org/10.5539/ass.v9n9p301
Aboelmaged, M.G. (2010). Six Sigma quality: a structured review and implications for future research. International Journal of Quality & Reliability Management, 27, 268-317. https://doi.org/10.1108/02656711011023294
Agus, A. (2005). The structural linkages between TQM, product quality performance, and business performance: Preliminary empirical study in electronics companies. Singapore Management Review, 27(1), 87-105.
Ahire, S.L., Golhar, D.Y., & Waller, M.A. (1996). Development and validation of TQM implementation constructs. Decision Sciences, 27, 23-56. https://doi.org/10.1111/j.1540-5915.1996.tb00842.x
Al-Ababneh, M.M. (2014). Classifying Jordanian Hotels Based on their TQM implementations. Dirasat, Administrative Sciences, 4, 482-496. https://doi.org/10.12816/0007484
Alonso, P., & Lewis, G.B. (2001). Public Service Motivation and Job Performance Evidence from the Federal Sector. The American Review of Public Administration, 31, 363-380. https://doi.org/10.1177/02750740122064992 Aghaie, A., & Popplewell, K. (1997). Simulation for TQM – the unused tool? The TQM Magazine, 9, 111-116.
https://doi.org/10.1108/09544789710165554
Anderson, J.C., Rungtusanathan, M., & Schroeder, R.G. (1994). A theory of quality management underlying the Deming management method. Acad. Manage. Rev., 19, 472-509. https://doi.org/10.2307/258936
Andersson, L. (2011). Barriers to organizational learning: A case study of a change Project. Conference for Organizational Learning, Knowledge and Capabilities. Hull (UK), 11-15 Apr.
Anil, A.P., & Satish, K.P. (2017). Enhancing customer satisfaction through total quality management practices – an empirical examination. Total Quality Management & Business Excellence, 28, 1-21.
https://doi.org/10.1080/14783363.2017.1378572
Aselstine, K., & Alletson, K. (2006). A new deal for the 21st century workplace. Ivey Business Journal, 4(1), 1-9. Available at: https://iveybusinessjournal.com/publication/a-new-employment-deal-for-the-21st-century-workplace/
Bakotic, D., & Rogosic, A. (2015). Employee involvement as a key determinant of core quality management practices. Total Quality Management & Business Excellence, 28, 1209-1226.
https://doi.org/10.1080/14783363.2015.1094369
Barson, R., Foster, G., Struck, T., Ratchev, S., Pawar, K., Weber, F. et al. (2000). Inter- and intra-organizational barriers to sharing knowledge in the extended supply chain. Conference Proceedings of the International Conference on e-Business and e-Work. Madrid (Spain), 18-20 Oct.
Bauer, A., Reiner, G., & Schomschule, R. (2000). Organizational and quality systems development: an analysis via a dynamic simulation model. Journal of Total Quality Management, 11, 410-416.
https://doi.org/10.1080/09544120050007715
Black, S.A., & Porter, L.J. (1996). Identification of the critical factors of TQM. Decision Sciences, 27(1), 1-21. https://doi.org/10.1111/j.1540-5915.1996.tb00841.x
Brad, S. (2008). Vectors of innovation to support quality initiatives in the framework of ISO 9001:2000. International Journal of Quality & Reliability Management, 25, 674-93. https://doi.org/10.1108/02656710810890872
Bradley, M. (1994). Starting total quality management from ISO 9000. The TQM Magazine, 6(1), 50-54. https://doi.org/10.1108/09544789410052778
Brah, S.A., Tee, S., & Rao, B.M. (2002). Relationship between TQM and performance of Singapore companies. International Journal of Quality & Reliability Management, 19, 356-379. https://doi.org/10.1108/02656710210421553 Brewer, G.A., & Selden S.C. (2000). Why elephants gallop: Assessing and predicting organizational performance in
federal agencies. Journal of public administration research and theory,10, 685-712. https://doi.org/10.1108/02656711011023294
Brown, A., & Wiele, T. (1996). A Tipology of Approaches to ISO Certification and TQM. Australian Journal of Management, 21(1), 57-72. https://doi.org/10.1177/031289629602100107
Burati, J.L., Matthews, M.F., & Kalidindi, S.N. (1992). Quality management organizations and techniques. J. Constr. Eng. Manage., 118(1), 112-128. https://doi.org/10.1061/(ASCE)0733-9364(1992)118:1(112)
Carmona-Márquez, F.J., Leal-Millán, A.G., Vásquez-Sánchez, A.E., Leal-Rodrígez, A.L., & Eldridge, S. (2016). TQM and business success. Do all the TQM drivers have the same relevance? An empirical study in Spanish firms. International Journal of Quality & Reliability Management, 33, 361-379. https://doi.org/10.1108/IJQRM-04-2014-0050
Chang, C.C., Chiu, C.M., & Chen, C.A. (2010). The effect of TQM practices on employee satisfaction and loyalty in government. Total Quality Management, 21, 1299-1314. https://doi.org/10.1080/14783363.2010.530796
Chase, G.W. (1993). Effective total quality management (TQM) process for construction. J. Manage. Eng., 9, 433-443. https://doi.org/10.1061/(ASCE)9742-597X(1993)9:4(433)
Cheng, T., & Chan, S.F. (1999). Quality motivation in China: humanistoc and technological. Total Quality Management, 10, 967-978. https://doi.org/10.1080/0954412997154
Christ, M.H., Emett, S.A., Summers, S.L., & Wood D.A. (2012). The Effects of Preventive and Detective Controls on Employee Performance and Motivation. Contemporary Accounting Research, 29, 432-452.
https://doi.org/10.1111/j.1911-3846.2011.01106.x
Choo, S., & Bowley, C., (2007). Using training and development to affect job satisfaction within franchising. Journal of Small Business and Enterprise Development, 14, 339-352. https://doi.org/10.1108/14626000710746745
Chowdhury, M., Paul, H., & Das, A. (2007). The impact of Top Management Commitment on Total Quality Management Practice: An Exploratory Study in the Thai Garment Industry. Global Journal of Flexible Systems Management, 8, 17-29. https://doi.org/10.1007/bf03396517
Cosenz, F., & Bianchi, C. (2014). A System Dynamics Approach to Evaluate Incentive-based Policies, Human Resource Motivation and Performance of Public Sector Organizations. RJSH, 1(1), 21-34. Available at:
https://www.researchgate.net/publication/259772986_A_System_Dynamics_Approach_to_Evaluate_Incentive-based_Policies_Human_Resource_Motivation
Crosby, P.B. (1979). Quality is Free. New York: McGraw-Hill.
Daily, B.F. (2003). TQM Workforce factors and employee involvement: The pivotal role of teamwork. Journal of managerial issues, 15, 393-412. Available at: https://www.jstor.org/stable/40604442
Dahlgaard, J.J., & Dahlgaard-Park, S.M. (2006). Lean production, Six Sigma quality, TQM and company culture. The TQM Magazine, 18, 263-281. https://doi.org/10.1108/09544780610659998
Das, A., Paul, H., & Sweirczek F.W. (2008). Developing and validating total quality management (TQM) constructs in the context of Thailand’s manufacturing industry. Benchmarking: An International Journal, 15(1), 52-72.
https://doi.org/10.1108/14635770810854344
Dubey, S.K., & Bansal, S. (2012). Barriers in implementing radical/incremental changes in manufacturing - based government organizations. Australian Journal of Business and Management Research, 2, 48-59. Available at:
http://www.ajbmr.com/current-issue/26
Edmondson, A., & Moingeon, B. (1999). Learning trust and organizational change. London: Sage.
Elias, M., Smith, W., & Barney, C.E. (2012). Age as a moderator of attitude towards technology in the workplace: work motivation And over all job satisfaction. Behaviour & Information Technology, 31, 453-467.
https://doi.org/10.1080/0144929X.2010.513419
Flynn, B.B., Schroeder, R.G., & Sakakibara S. (1994). A framework for quality management research and an associated measurement instrument. J. Oper. Manage., 11, 339-366. https://doi.org/10.1016/S0272-6963(97)90004-8 Fonseca L.M.C.M., Domingues J.P., Machado P.B., & Calderón M. (2017), Management System Certification
Benefits: Where Do We Stand? Journal of Industrial Engineering and Management, 10, 476-494. https://doi.org/10.3926/jiem.2350
Fotopoulos, C.V., & Evangelos, L. (2010). Investigating total quality management practice’s inter-relationships in ISO 9001:2000 certified organizations. Total Quality Management, 21, 503-515.
https://doi.org/10.1080/14783363.2010.481512
Frehr, H.U. (1997). From ISO 9000 to total quality management, a rough road. Human Systems Management, 16, 185-193. https://doi.org/10.3233/HSM-1997-16306
Govender, S., & Parumasur, S.B. (2010). The relationship between employee motivation and job involvement. SAJEMS NS 13, 237-257. https://doi.org/10.4102/sajems.v13i3.102
Hackman, J.R., & Wageman, R. (1995). Total Quality Management: Empirical, conceptual and practical issues. Administrative Science Quarterly, 40, 309-342. https://doi.org/10.2307/2393640
Hao, Z.Z. (2000). Implementation of Total Quality Management: An Empirical Study of Chinese Manufacturing Firms, (unpublished doctorial thesis). University of Gronigen, Gronigen, The Nederlands.
Hao, Z.Z., & Yunlong, D. (2013). Research on the relationship of institutional innovation, organizational learning and synergistic effect: An empirical study of Chinese university spin-offs. Journal of Industrial Engineering and Management, 7, 645-659. https://doi.org/10.3926/jiem.950
Hays, J.M., & Hill, A.V. (2001). A preliminary investigation of the relationships between employee
motivation/vision, service learning, and perceived service quality. Journal of Operations Management, 19, 335-349. https://doi.org/10.1016/S0272-6963(00)00061-9
Hernad, J.M.C., & Gayab, C.G. (2013). Methodology for implementing Document Management Systems to support ISO 9001:2008, Quality Management Systems. Procedia Engineering, 63, 29-35.
https://doi.org/10.1016/j.proeng.2013.08.225
Ho, S.K.M. (1994). Is the ISO 9000 Series for Total Quality Management? International Journal of Quality & Reliability Management, 11, 74-89. https://doi.org/10.1108/02656719410074260
Ilkay, M.S., & Emre, A. (2012). The effect of the ISO 9001 quality management system on the performance of SMEs. International Journal of Quality & Reliability Management, 29, 753-778.
https://doi.org/10.1108/02656711211258517
Ijaz, A., Kee, D.M.H., & Irfan S.M. (2012). Internal Customer job satisfaction and role of TQM practices. Far East Journal of Psychology and Business, 6, 1-14. Available at: https://ideas.repec.org/a/fej/articl/v6by2012i1p1-14.html
Jafri, M.H. (2012). Impact of Employee Trust on Organizational Commitment and Innovative Behaviour of Employees: An Empirical Study on Public Sector Employees in Bhutan, Parokalpana: KIIT Journal of Management, 11-26.
Jayaweera, T. (2015). Impact of Work Environmental Factors on Job Performance, Madiating Role of Work Motivation: A Study of Hotel Sector in England. International Journal of Business and Management, 10, 271-278. https://doi.org/10.5539/ijbm.v10n3p271
Juran, J.M (1995). A History of Manging for Quality. Milwaukee, MI: ASQC Quality Press.
Jurburg, D., Viles, E., Tanco, M., & Mateo R. (2016). What motivates employees to participate in continuous improvement activities? Total Quality Management & Business Excellence, 28, 1469-1488.
https://doi.org/10.1080/14783363.2016.1150170
Kadam, R. (2012). Development and growth orientation of infrastructure policy in India. International Journal of Advanced Research in Management and Social Sciences, 1, 101-113. Available at:
https://www.academia.edu/5450772/DEVELOPMENT_AND_GROWTH_ORIENTATION_OF_INFRASTRUCTUR E_POLICY_IN_INDIA
Kanji, G.K. (1998). Measure of business excellence, Total Quality Management & Business Excellence, 9, 633-644. https://doi.org/10.1080/0954412988325
Kappelman, L., & Prybutok, V. (1995). Empowerment, Motivation, Training and TQM Program Implementation Success, Total Quality Management, Industrial Management, 37, 11-15. Available at:
http://connection.ebscohost.com/c/articles/9510076920/empowerment-motivation-training-tqm-program-implementation-success
Karapetrovic, S., Casadesus Fa, M., & Saizarbitoria, I.H. (2010). What happened to the ISO 9000 lustre? An eight-year study, Total Quality Management, 21, 245-267. https://doi.org/10.1080/14783360903553149
Karthi, S., Devadasan, S.R., & Murugesh, R. (2011). Integration of Lean Six Sigma with ISO 9001:2008 standard. International Journal of Lean Six Sigma, 2, 309-331. https://doi.org/10.1108/20401461111189416
Karthi, S., Devadasan, S., Selvaraju, K., Sreenivasa C.G., & Sivaram, N.M., (2014), Transforming into a Lean Six Sigma Enterprise Through ISO 9001 Standard - Based Quality Management System. Journal of Enterprise Transformation, 4, 100-122. https://doi.org/10.1080/19488289.2014.890981
Kimutal, G., Gachunga, H., Wanjau, K., & Gichuhi, A.W. (2013). Influence of employee capacity on health workforce performance in Kenya’s public health sector: A tale of ISO 9001:2008 certified hospitals. European Journal of Business and Social Sciences, 2, 134-152. Available at: http://www.ejbss.com/recent.aspx
Kerestesova, M. (2012). The model of motivating planning and planning motivation. Human Resources Management & Ergonomics, 6, 115-129. Available at: https://frcatel.fri.uniza.sk/hrme/files/2012/2012_2_09.pdf
Khan, M. (2011). Total Quality management and organizational performance – moderating role of managerial competencies. International Journal of Academic Research, 3, 453-458. Available at:
http://connection.ebscohost.com/c/articles/69735506/total-quality-management-organizational-performance-moderating-role-managerial-competencies
Khanna, V.K., Vrat, P., Shankar, R., & Sahay, B.S. (2004). Managing the transition phases in the TQM journey: a system dynamics approach. International Journal of Quality & Reliability Management, 21, 518-544.
https://doi.org/10.1108/02656710410536554
Koh, T.Y., & Low, S.P. (2010). Empiricist Framework for TQM Implementation in Construction Companies. Journal of management in engineering, 133, 133-143. https://doi.org/10.1061/(ASCE)ME.1943-5479.0000014
Kuo, T., Chang, T., Hung, K., & Lin, M. (2009). Employees’ perspective on the effectiveness of ISO 9000 certification: A Total Quality Management framework. Total Quality Management, 20, 1321-1335.
https://doi.org/10.1080/14783360903250530
Lagrosen, Y. (2017). The Quality Café: developing the World Café method for organizational learning by including quality management tools. Total Quality Management & Business Excellence, 28, 1-13.
https://doi.org/10.1080/14783363.2017.1377606
Larson, P.D., & Kerr, S.G. (2007). Integration of Process Management Tools to Support TQM Implementation: ISO 9000 and Activity-based Costing. Total Quality Management, 18, 201-207.
https://doi.org/10.1080/14783360601053434
Latif, Y. (2014). Important TQM Implementation Contributors in Pakistani Petrochemical Sector. Pakistan Pak.j.stat.oper.res,10, 331-348. https://doi.org/10.18187/pjsor.v10i3.770
Latham, G.P., & Locke E.A. (2006). Enhancing the benefits and overcoming the pitfalls of goal setting, Organizational Dynamics, 35, 332-340. https://doi.org/10.1016/j.orgdyn.2006.08.008
Leitch, J., Nieves, D., Burke, G., Little, M., & Gorin M. (1995). Strategies for Involving Employees. The Journal of Quality and Participation, 18, 68-74. Available at:
https://search.proquest.com/openview/9b5d1b7cdbee7ba36dcc1c9c8c474966/1?pq-origsite=gscholar&cbl=37083
Lewis, W.G., Pun, K.F., & Lalla, T.R.M. (2006). Empirical investigation of the hard and soft criteria of TQM in ISO 9001 certified small and medium-sized enterprises. The International Journal of Quality & Reliability Management, 23, 964-985. https://doi.org/10.1108/02656710610688167
Lu, L. (1999). Work motivation, Job Stress and Employees` Well-being. Journal of Applied Management Studies, 8(1), 61-72. Available at: http://web.ba.ntu.edu.tw/Lulu/1999%20Work%20motivation%20job%20stress%20and%20employees %20well%20being.pdf
Magd, H.A.E. (2008), ISO 9001:2000 in the Egyptian manufacturing sector: perceptions and perspectives. International Journal of Quality & Reliability Management, 25, 173-200, https://doi.org/10.1108/02656710810846934 Malik, M.E., & Danish, R.Q. (2010). Impact of Motivation to Learn and Job Attitudes on Organizational Learning
Culture in a Public Service Organization of Pakistan. A Research Journal of South Asian Studies, 25, 217-235. Available at: https://pdfs.semanticscholar.org/d910/4eb785d5313d5ecce1b50de7b4d791755f7c.pdf
Manzoor, Q. (2011), Impact of Employees’ motivation on Organizational Effectiveness, European Journal of Business and Management, 3, 36-44. https://doi.org/10.5296/bms.v3i1.904
Mardani, A., & Kazemilari, M. (2012). Relationship between national culture and TQM implementation, Case study: Iranian multinational electrical manufacturing companies. Asian Journal of Management Research, 3, 291-312.
Available at: http://www.ipublishing.co.in/ajmrvol1no1/volthree/EIJMRS3025.pdf
Martínez-Costa, M. (2008). Simultaneous Consideration of TQM and series ISO 9000 on Performance and Motivation: An Empirical Study of Spanish Companies. International Journal of Production Economics, 113(1), 23-39. https://doi.org/10.1016/j.ijpe.2007.02.046
Maslow, A.H. (1954). Motivation and personality, New York: Harper & Row.
McAdam, R., & Jackson, N. (2002). A Sector study of ISO 9000 and TQM transitions: the UK and Irish brewing sector. Integrated Manufacturing System,13, 255-63. https://doi.org/10.1108/09576060210426958
McLaughlin, S., Paton, R.A., & Macbeth D.K. (2008). Barrier impact on organizational learning within complex organizations. Journal of Knowledge Management, 12, 107-123. https://doi.org/10.1108/13673270810859550
Meegan, S.T., & Taylor, W.A. (1997). Factors influencing a successful transition from ISO 9000 to TQM – the influence of understanding and motivation. International Journal of Quality & Reliability Management, 14, 100-117. https://doi.org/10.1108/02656719710165383
Mehrjerdi, Y.Z. (2011). Quality function deployment and its profitability engagement: a systems thinking perspective. International Journal of Quality & Reliability Management, 28, 910-928.
https://doi.org/10.1108/02656711111172513
Milne, P. (2007). Motivation, incentives and organisational culture. Journal of Knowledge Management, 11, 28-38. https://doi.org/10.1108/13673270710832145
Mohsan, F., Nawaz M.M, Khan M.S, Shaukat, Z., &, Aslam, N. (2011). Are Employee Motivation, Commitment and Job Involvement Inter-related: Evidence from Banking Sector of Pakistan. International Journal of Business and Social Science, 2, 226-233. Available at: http://ijbssnet.com/journals/Vol_2_No_17/31.pdf
Mosadeghrad, M. (2014). Why TQM programmes fail? A pathology approach. The TQM Journal, 26, 160-187. https://doi.org/10.1108/TQM-12-2010-0041
Mucha, A., Jovanoski, B., Minovski, R., & Gechevska, V. (2017). Simulation model for production planning and control, International Scientific Conference High Technologies, Business, Society. Borovets, Bulgaria, 14-17 Mar.
Nair, A. (2006). Meta-analysis of the relationship between quality management practices and firm performance – Implications for quality management theory development, Journal of Operations Management, 24, 948-975. https://doi.org/10.1016/j.jom.2005.11.005
Neubeck, T., Elg, M., & Schneider, T. (2014). Managing the gap between policy and practice through Intermediaries for Quality Improvement. Scandinavian Journal of Public Administration, 18, 73-89. Available at:
http://urn.kb.se/resolve?urn=urn:nbn:se:hj:diva-25546
Newman, W.L. (2014). Social Research Methods: Qualitative and Quantitative Approaches. Edinburg Gate, Harlow: Person New International Edition.
Nohria, N., Groysberg, B., & Lee, L.E. (2008). Employee Motivation: A Powerful New Model. HBS Centennial Issue Harvard Business Review, 86, 78–84. Available at: https://www.hbs.edu/faculty/Pages/item.aspx?num=33889
Oakland, J.S. (1995). Total quality management: Text with cases. London UK: Butterworth–Heinemann. Oliveira, G.S., Correa, J.E., Balestrassi, P.P., Martins, R.A., & Turrioni, J.B. (2017). Investigation of TQM
implementation: empirical study in Brazilian ISO 9001-registered SMEs. Total Quality Management & Business Excellence, 28, 1-19. https://doi.org/10.1080/14783363.2017.1328273
Ooi, K. (2012). The effectiveness of TQM: A stimulator for knowledge distribution? Total Quality Management, 23, 653-671. https://doi.org/10.1080/14783363.2012.677308
Osterloh, M., Frost, J., & Frey, B.S. (2002). The Dynamics of Motivation in New Organizational Forms. International Journal of the Economics of Business, 9(1), 61-77. https://doi.org/10.1080/13571510110102976
Osterman, P. (1994). Supervision, Discretion and Work Organization. The American Economic Review, 84(2), 380-384. Available at: https://www.jstor.org/stable/2117863
Paulk, M.C., Weber, C.V., García, S.M. Chrissis, M.B., & Bush, M. (1993). Key Practices of the Capability Maturity Model, Technical Report, CMU/SEI-93-TR-025 ESC-TR-93-178. Pittsburgh, Pennsylvania: Software Engineering Institute Carnegie Mellon University. Available at: https://resources.sei.cmu.edu/library/asset-view.cfm?assetid=11965
Pérez, V.F., & Gutiérrez L.G. (2013). External managerial networks, strategic flexibility and organizational learning: A comparative study among non-QM, ISO and TQM firms. Total Quality Management, 24, 243-258.
https://doi.org/10.1080/14783363.2012.669558
Pheng, L.S., & Teo, J.A. (2004). Implementing Total Quality Mangement in Construction Firms. Journal of management in engineering, 8(1), 8-15. Available at:
http://castle.eiu.edu/pingliu/tec5133/resources/spring_2009/tqm_and_org_chart_ref.pdf
Pieterse, A.N. (2013). Cultural diversity and team performance: The role of team member goal orientation. Academy of Management Journal, 56, 782-804. https://doi.org/10.5465/amj.2010.0992
Piskar, F. (2007). The impact of the quality management system ISO 9000 on customer satisfaction of Slovenian companies. Managing Global Transitions, 5(1), 45-61. https://doi.org/10.1108/02635570610712609
Plura, J. (2000). Continual improvement within the qulity management systems. Kvalitita Inovacia Prosperita, IV(1), 13-22. Available at: http://qip-journal.eu/files/2000/1/plura/plura.pdf
Pool, S.W. (2000). The learning organization: motivating employees by integrating TQM philosophy in a supportive organizational culture. Leadership & Organization Development Journal, 21(8), 373-378.
https://doi.org/10.1108/01437730010379276
Powell, T.C. (1995). Total quality management as competitive advantage: A review and empirical study. Strategic Management Journal, 16(1), 15-37. https://doi.org/10.1002/smj.4250160105
Prajogo, D.I., & Sohal, A.S. (2006). The relationship between organization strategy, total quality management (TQM) and organization performance – The mediating role of TQM. European Journal of Operation Research, 168 (1), 35-50. https://doi.org/10.1016/j.ejor.2004.03.033
Psychogios, A.G, Wilkinson, A., & Szamosia, L.T. (2009). Getting to the heart of the debate: TQM and middle manager autonomy. Total Quality Management & Business Excellence, 20, 445-466.
https://doi.org/10.1080/14783360902781949
Psomas, E.L., & Fotopoulos, C.V. (2009), A meta analysis of ISO 9001:2000 research – findings and future research proposals. International Journal of Quality and Service Sciences, 1, 128-44. https://doi.org/10.1108/17566690910971418 Respati, H., & Ami, R. (2014). Research on Continues Mediation: Employee Behaviour and TQM Practice as ISO
9000 Strategy to Improve Performance of Manufacturing Company in East Java, Indonesia. European Journal of Business and Management, 6, 125-136. Available at:
http://citeseerx.ist.psu.edu/viewdoc/citations;jsessionid=87DB6CC973C484D86EA89AB82CB43D60?doi=10.1.1.676.5667
Rice, W.R. (1993). Motivation: The Most Basic Process in TQM/CQI. JHG, 15, 38-42. https://doi.org/10.1111/j.1945-1474.1993.tb00101.x
Rosenberg, Z., Riasanow, T., & Krcmar, H. A. (2015). System Dynamics Model for Business Process Change Projects. Proceedings / International Conference of the System Dynamics Society, Boston, 19-23 Jul.
Saaksvuori, A., & Immonen, A. (2005). Product Lifecycle Management (2nd ed.). Berlin Heidelberg: Springer-Verlag. Sampaio, P., Saraiva, P., & Rodrigues, A.G. (2009). ISO 9001 certification research: questions, answers and
approaches. International Journal of Quality & Reliability Management, 26(1), 38-58. https://doi.org/10.1108/02656710910924161
Saraph, J.V., Benson, P.G., & Schroeder, R.G. (1989). An instrument for measuring the critical factors of quality management. Decision Sciences, 20, 810-829. https://doi.org/10.1111/j.1540-5915.1989.tb01421.x
Senge, P. (1990). The Fifth Discipline. The Art and Practice of Learning Organization. NewYork: Doubleday/currency. Shepherd, D.A., Haynie, M., & Patzelt, H. (2013). Project Failures Arising from Corporate Entrepreneurship:
Impact of Multiple Project Failures on Employees’ Accumulated Emotions, Learning, and Motivation. Journal of Production and Innovative Management, 30, 880-895. https://doi.org/10.1111/jpim.12035