Demographic Research a free, expedited, online journal of peer-reviewed research and commentary
in the population sciences published by the Max Planck Institute for Demographic Research Konrad-Zuse Str. 1, D-18057 Rostock · GERMANY www.demographic-research.org
DEMOGRAPHIC RESEARCH
VOLUME 15, ARTICLE 3, PAGES 51-60
PUBLISHED 18 AUGUST 2006
http://www.demographic-research.org/Volumes/Vol15/3/ DOI: 10.4054/DemRes.2006.15.3
Descriptive finding
Female deficit and the marriage market
in Korea
Jean Louis Rallu
2 Sex ratio at birth and changes in cohort size 52
2.1 SRB 52
2.2 Cohort size 53
3 Sex ratios of the marriageable ages 54
3.1 Methodology 54
3.2 Results 55
3.2.1 Five-years age-groups 55
3.2.2 Ten-years age-groups 56
3.2.3 Changing ages at marriage 57
4 Conclusion and a catastrophic scenario 59
Demographic Research: Volume 15, Article 3 descriptive finding
Female deficit and the marriage market in Korea
Jean Louis Rallu 1
Abstract
Selective abortion of female embryos causes abnormal sex ratios at birth that will result in imbalances on the marriage market. However, it is well-known that varying cohort size in the frame of different mean ages at marriage for males and females also causes imbalances. In the case of Korea, both phenomenons are present : SRB of 115 in 1990-1995 and rapid fertility decline from the early 1960s, with TFR fluctuating below replacement level since 1983 and reaching 1.16 in 2004. This note assesses the relative roles of SRB and cohort size on the marriage market and the adjustments that can happen thru age gap between spouses.
1. Introduction
The increase in sex ratio at birth is a concern in several Asian countries: China, Taiwan, India and Bangladesh, not only for its long-term consequences on marriage market and population reproduction, but also in itself as it translates a general attitude towards gender roles and women empowerment. From a strictly demographic (mathematical) viewpoint, it is the cause of sex imbalances on the marriage market. But, it is not the only cause. It is well known that, due to age gap between spouses, variations in cohort size due to wars, epidemics, subsequent recoveries, the fertility transition, baby booms and busts, have also an important role on the sex ratio of marriageable ages (Bergstrom and Lam, Fraboni and Billari, McDonald, Ni Bhrolchain). Although selective abortion of female embryos rightfully attracts most of the attention of demographers, there is a need to assess relative roles of cohort size and abnormal SRB on the future marriage market.
This note will review trends in female deficit at birth in Korea and use population projections to assess future imbalances at marriageable ages, separating the roles of SRB and cohorts size.
2. Sex ratio at birth and changes in cohort size
2.1 SRB
In Korea, SRB started to increase regularly in the early 1980s, reaching above 110 in 1986 (figure 1). Female deficit further accentuated, although very irregularly, to reach 116.6 in 1990. Amid ups and downs, sex ratio averaged 115 in the first half of the 1990s. A quick decline occurred in 1995-1997 and suddenly stalled. From then, SRB is quasi stable at a level of 110 or just under (108 in 2003). From 1995, authorities tried to limit the use of ultrasounds for sex selective abortions and there has been a growing awareness of the problems that could result from excessive sex imbalances for marriages of sons in the future.
Demographic Research: Volume 15, Article 3
forecasted, and so of their implications on the marriage market and dependency ratios, that will certainly be affected by son’s preference (Tuljapurkar et al.).
Figure 1: Sex-ratio at birth in the Republic of Korea, 1979-2004
0.98 1 1.02 1.04 1.06 1.08 1.1 1.12 1.14 1.16 1.18
19791980198119821983198419851986198719881989199019911992199319941995199619971998199920002001200220032004
sex ratio
2.2 Cohort size
Korea experienced important changes in the size of birth cohorts. First, there is the effect of the Korea war (1950-1953), the following recovery that also looks like a return to pre-transition fertility, the fertility transition from the early 1960s to 1983 when TFR reached 2.1 and immediately dropped under replacement with 1.76 in 1984 and 1.55 in 1987. A brief rebound to 1.78 in the first half of the 1990s, incidentally coinciding with the peak in abnormal SRB, is followed by a slow decline to under 1.5 in 1998-2000. From 2002, a new drop leads Korean TFR to be among the lowest in the world with below 1.2 (1.16 in 2004).
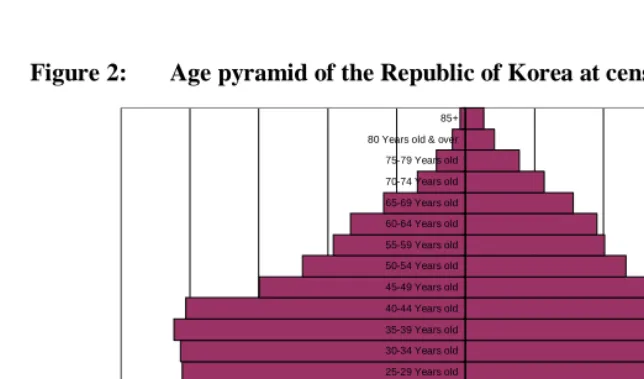
in 2000). The bulk at ages 5-9 due to a short-lived rebound of TFR in the early 1990s is remarkable.
Figure 2: Age pyramid of the Republic of Korea at census 2000
-2500000 -2000000 -1500000 -1000000 -500000 0 500000 1000000 1500000 2000000 2500000 0-4 Years old
5-9 Years old 10-14 Years old 15-19 Years old 20-24 Years old 25-29 Years old 30-34 Years old 35-39 Years old 40-44 Years old 45-49 Years old 50-54 Years old 55-59 Years old 60-64 Years old 65-69 Years old 70-74 Years old 75-79 Years old 80 Years old & over 85+
3. Sex ratios of the marriageable ages
3.1 Methodology
Demographic Research: Volume 15, Article 3
does not affect trends. It affects a little the ratio of marriageable males and females but there is no reason to change gender migration patterns. Shortage of females on the marriage market has no direct reason to influence migration, as a large part of migration occurs before marriage. Whenever migration could be a way of extending marriage opportunities, higher availability of male spouse in-country would not necessarily be a deterrent to accessing overseas marriage markets.
Given the focus on female deficit, we calculate the ratio of females to males at various marriageable ages, not the traditional sex ratio but an inverse sex ratio. We consider ages 25-29 and a 10 years age-group 25-34 for males, the latter is just around the male mean age at marriage of 29.5 in 1995. Females are 3 years younger than males, which was the stable age difference between spouses in 1985-1995. To measure the role of cohort size alone, we calculated the same index (inverse sex ratio of marriageable ages) with constant SRB of 106 male births for 100 female births.
Other method consisting to compare numbers of males and females weighted by first marriage rates (Tuljapurkar and al.) may be affected by changes in marriage patterns when strongly imbalanced marriageable cohorts of males and females will enter the scene, namely, late marriage of males may drop significantly as it will be difficult for older bachelors to find spouses. As marriage ages are more likely to concentrate at early marriageable ages for males and consistently also for females, results with 5 years age-group may be closer to the future situation of the marriage market than those with 10 years age-groups. However, as regards overall marriages, not only first marriages, there may be a tendency to increasing variance for both sexes.
3.2 Results
3.2.1 Five-years age-groups
Let us first consider ages 25-29 for males and 22-26 for females. There was a strong excess of females in the early 1980s, reaching 16%, when post war cohorts reached marriageable ages (figure 3a)2. But, the late 1980s shows exactly the reverse situation with an 8% deficit of females, due to declining size of cohorts born during the fertility transition. A balanced situation in 1994 is followed by an even deeper deficit of females reaching 15% in 2001-2002. The new rebound around 2005 will be short by 2% of a balanced sex ratio of the marriageable ages. It is the last time that the marriage market is not affected by abnormal SRB. Thus, important sex imbalances are observed before abnormal SRB of the post 1985 period bears consequences on the marriage market. The
2
most severe female deficits of this century occur around 2010 and in 2025-2028 with respectively close to 23% and 24% less females than males. These troughs appear only partly due to abnormal SRB: females aged 22-26 in 2010 were born in 1984-1988 and the same ages in 2027 were born in 2001-2005 at a time when SRB is still mostly under or around 110. The difference between a normal SRB and the observed SRB shows that, at the bottom of the troughs, the latter is responsible for 3.5 percentage points of the 2010 trough and by 2.7 percentage points in 2026-2027. Actually, the peak of sex preference in the first half of the 1990s corresponds to a time when the age structure is favourable to men. A slight excess of females (3%) would even have been observed in 2015-2017, but it is completely obliterated by the abnormal SRB and a 7% female deficit will take place instead. However, the situation is still more favourable for male cohorts of the peak sex preference than for younger and later cohorts. This is a chance that was probably not calculated, unless we assume some kind of unconscious prevision in humans.
Figure 3a: Observed and normal sex ratio at ages 25-29 with females/males age gaps of 3, 2, and 0 years, Republic of Korea, 1980-2050
0.600 0.700 0.800 0.900 1.000 1.100 1.200
1980198 3
19861989199 2
199 5
1998200 1 200 4 200 7 201 0 201 3 201 6 201 9 202 2 202 5 202 8 203 1 203 4 203 7 204 0 204 3 204 6 204 9 22-26/25-29 observed 22-26/25-29 1.06 25-29/25-29 23-27/25-29 observed
3.2.2 Ten-years age-groups
Demographic Research: Volume 15, Article 3
still a large excess of females in the first half of the 1980s (10%), and then female deficit increases in three steps until 2014-2015. From 5% in the first half of the 1990s, female deficit reaches 17% in the mid 2010s; it would have been only 12% with normal SRB. Sex preference thus appears responsible of an additional imbalance by 5 percentage points. Then, cohorts born in 1990-1995 arrive on the marriage market. Unlike with 5-years age-groups, no excess of females appears around 2020 with normal SRB, nevertheless the sex ratio of marriageable ages in 2018 is not far from equilibrium: 0.96 in 2019. However, the observed SRB brings the figure down to 0.88. The largest female deficit is observed in 2026-2028 with sex ratio of 0.79, against only 0.83 with normal SRB. Then, the projection includes cohorts that are not yet born and shows a reduced female deficit as SRB is projected to return to normal.
Figure 3b: Observed and normal sex ratio at ages 25-34 with females/males age gaps of 3, 2, and 0 years, Republic of Korea, 1980-2050
0.6 0.7 0.8 0.9 1 1.1 1.2 198 0
19831986198 9
199 2
1995199 8
200 1
200 4
2007201 0
201 3
2016201 9
202 2
202 5
2028203 1
203 4
203 7
20402043204 6 204 9 22-31/25-34 observed 22-31/25-34 1.06 25-34/25-34 23-32/25-34 observed
3.2.3 Changing ages at marriage
years age gap. When considering the 25-34 male and 23-32 female age-groups, female deficit due to observed SRB is compensated until 2012, but the first trough of female deficit is not totally compensated for and it has no effect during the period of improved sex ratios of the marriage market when the situation is about the same as with observed SRB. But, during the second trough, it nearly erases the effect of abnormal SRB.
Going further, we calculated the sex ratio of a marriage market where males and females are of the same ages. This just reflects SRB and differential mortality until marriageable ages. As expected given that most of the imbalances are due to cohort size, the large variations consisting of peaks and troughs disappear and there is never excess of females. Female deficits is much more regular and much more manageable that the frequent reversals observed with age gaps of 3 or even 2 years, and it is never above 14% -, being reduced from its initial level of 15% in the 1990-1995 cohorts by excess male mortality of children and young adults. For the 10-years age-groups, female deficit is only slightly more important than with age gaps around 2020, when the size of cohorts would bring a relative reduction of imbalances. Obviously, given that the marriage market usually resolves its imbalances by changes in ages at marriage of both sexes in opposite directions, there will be a trend toward reduced age gap between spouses to ease constraints and the latter could well go below 2 years.
A brief look at what has already happened around the turn of the century confirms this hypothesis. The age gap remained stable at 3.2 years in 1985-1994, in the frame of similar increases in average age at marriage for both sexes from 24.5 to 25.6 for females and 27.7 to 28.7 for males3. But, from 1995 to 2001, the mean age at marriage increased faster for females than for males to respectively 28.3 and 30.7 years, reducing the age gap between spouses to 2.4 years. This move towards reduced age gaps between spouses is certainly not finished. So far, cohabitation is very low in Korea so that trends in ages at marriage translate well the adaptation of the marriage market. Despite a traditional society that makes cohabitation without marriage difficult, the important future imbalances on the marriage market could well lead to new form of unions with various consequences on SRB (see below). Mobs of bachelors turning to violence (Poston, Glover) (Hudson, Den Boer) or development of polyandry are not inevitable consequences of imbalances on the marriage market. Re-marriage, that may be statistically considered as a kind of substitute to polyandry (or polygamy), will probably increase following already existing trends. Whenever, the proportion of females in the population will decrease, it may not necessarily be detrimental to their socio-economic status as becoming rare usually increases value.
Demographic Research: Volume 15, Article 3
4. Conclusion and a catastrophic scenario
Finally, in the case of Korea, abnormal SRB is very manageable, mostly due to an unexpected timing with a period of abundance of females on the marriage market. However, it will hinder marriage of males by close to 10%, obliterating a potentially favourable situation at ages 25-29 around 2015. But the trough of a 25% deficit of females already noted by Das Gupta and Li Shuzhuo (1997) is not mostly due to abnormal SRB. Adjustments of ages at marriage will certainly help ease the imbalances, and they have already started to do so. - Imbalances on the marriage market could also eventually affect trends in migration, namely the currently higher female than male migration from Korea. For small populations like Korea, migration could be a solution to imbalances on the marriage market thru emigration of males, reduced migration of females or immigration of foreign females from neighbouring Asian countries and eventually of second and third generation female migrants from the US. But migration is not a solution in larger countries like China and India.
References
Bergstrom Theodore, D. Lam, 1994, The Effects of Cohort Size on Marriage-Markets in Twentieth-Century Sweden, in The Family, the Market, and the State in
Ageing Societies, J. Ermisch and N. Ogawa eds., Clarendon Press, Oxford, pp.
46-63.
Das Gupta Monica, Li Shuzhuo, 1997, Gender Bias and the “Marriage Squeeze” in
China, South Korea and India 1920-1990, Havard Center for Population and
Development Studies, Working Paper Series Nb 97.05, 32 p..
Poston D. L., K. S. Glover, Too many males: marriage market implications of gender imbalances in China, Genus LXI (No 2), pp. 119-140.
Fraboni Romina, F. C. Billari, 2001, Measure and dynamics of marriage squeezes: from
baby boom to baby bust in Italy, MPIDR Working Papers WP 2001-005, 42 p..
Hudson and den Boer, 2004, Bare Branches: Security Implications of Asia’s Surplus
Male Population. Cambridge, The MIT Press.
Mc Donald Peter, 1995, L'équilibre numérique entre hommes et femmes et le marché matrimonial. Le point sur la question, Population vol. 50, nº6, pp.1579-1590.
Ni Bhrolchain Maire et W. Sigle-Rushton, 2005, L'offre de conjoints potentiels en Grande-Bretagne et aux Etats-Unis : estimations et différences entre les sexes,
Population, vol. 60, n° 1-2, pp. 39-70.
Ni Bhrolchain Maire, 2000, La flexibilité du marché matrimonial, Population vol. 55, n° 6, pp. 899-939.
Tuljapurkar S., Nan Li, Marcus W. Feldman, 1995, High Sex Ratios in China’s Future,