in the population sciences published by the Max Planck Institute for Demographic Research Konrad-Zuse Str. 1, D-18057 Rostock · GERMANY www.demographic-research.org
DEMOGRAPHIC RESEARCH
VOLUME 18, ARTICLE 8, PAGES 233-262
PUBLISHED 11 APRIL 2008
http://www.demographic-research.org/Volumes/Vol18/8/ DOI: 10.4054/DemRes.2008.18.8
Research Article
Religious affiliation, religiosity, and male and
female fertility
Li Zhang
© 2008 Zhang.
This open-access work is published under the terms of the Creative Commons Attribution NonCommercial License 2.0 Germany, which permits use, reproduction & distribution in any medium for non-commercial purposes, provided the original author(s) and source are given credit.
1 Introduction 234 2 Hypotheses on religion, religiosity, gender and fertility 236
3 Data and variables 238
3.1 Independent variables 239
3.2 Control variables 240
4 Statistical methods and results 246
5 Conclusion 254
6 Acknowledgements 256
Religious affiliation, religiosity, and male and female fertility
Li Zhang1
Abstract
Religious studies of fertility typically focus on the effect of religious affiliation on fertility; the role of religiosity in determining fertility remains overlooked. Meanwhile, most studies focus on studying female fertility; whether religion and religiosity have significantly different impacts on men’s and women’s fertility rarely has been examined. To fill these gaps, this study uses data from the 2002 NSFG Cycle 6 on religious affiliation, religiosity, and children ever born (CEB) for both men and women to investigate the effects of religious affiliation and religiosity on male and female fertility. A series of hypotheses which aim to demonstrate the critical role of religiosity, particularly the importance of religious beliefs in people’s daily life in shaping people’s fertility behavior are tested. The findings show a shrinking pattern of fertility differentials among religious groups. However, religiosity, particularly religious beliefs, shows a substantially positive effect on fertility. The gender interaction terms are not significant which indicates that the effects of religion and religiosity on fertility do not vary by gender.
1. Introduction
Most religious and demographic studies of religion and fertility in the United States elaborate female fertility differentials among people who are affiliated with various religious denominations (Janssen and Hauser 1981; Lehrer 1996; Lehrer 2004; Marcum 1988; Mosher, Johnson, and Horn 1986; Poston 1990). Catholics often are reported as having a particularly high level of fertility. Protestants’ fertility is shown to be lower than that of Catholics and is located in the middle of the continuum. Non-Orthodox Jews are at the end of the continuum and have consistently shown the lowest fertility rate among all religious groups in the U.S. (Lehrer 2004; Sander 1993). In recent years, however, demographers have reported that fertility differences among Catholics and other religious groups have been shrinking, and that Protestants’ fertility tends to be higher than that of Catholics and other religious groups (Mosher, Johnson, and Horn 1986; National Center for Health Statistics 2005; Westoff and Jones 1979).
Four principal hypotheses have been proposed in the literature of religious studies of fertility to explain these fertility differentials, namely, (1) the particularized theology hypothesis, (2) the characteristics hypothesis, (3) the minority status hypothesis, and (4) the social interaction hypothesis (Chamie 1981; McQuillan 2004). The particularized theology hypothesis views fertility differentials as a result of specific doctrinal differences among religions. According to this perspective, religious groups whose doctrines are against contraception and abortion and favor a large family size should have a higher fertility rate. For those religious groups who do not have such doctrines, the fertility rate should be lower. Examples of religious groups with these doctrines include Roman Catholics, fundamentalist Protestants, Latter-Day Saints (Mormons), and Amish. Religious groups who have no proscriptions on birth control are, for example, mainstream Protestants and Jews (Jurecki-Tiller 2004). Empirical research has provided some evidence for the particularized theology hypothesis by demonstrating that mainstream Protestants and Jews have higher levels of contraceptive use and lower fertility rates compared to Catholics and fundamentalist Protestants (De Jong 1965; Freedman, Whelpton, and Campbell 1961; Mosher and Hendershot 1984; Mosher, Williams, and Johnson 1992).
status (Westoff and Jones 1979). Muslim fertility is found to be largely impacted by differences in socioeconomic conditions as well (Johnson-Hanks 2006).
The third perspective, the minority group status hypothesis, contends that the insecurity of minority group status plays a role in depressing fertility of minority religious groups below that of the majority. The prerequisites for the minority status mechanism to operate are: (1) acculturation; (2) socioeconomic mobility; and (3) no pronatalist ideology or norms (Goldscheider 1971: 297). This hypothesis not only highlights fertility differentials among religious groups, but also among racial and ethnic groups (Poston, Chang, and Dan 2006). The definition of minority group status is based on the numerical size of the group and whether a racial and ethnic group is considered psychologically a minority. Examples of such groups are South African blacks and Latinos. In some parts of the U.S., these two groups may be a numerical majority but are still psychologically treated as minorities (Bouvier and Rao 1975; Chamie 1981). Part of the empirical support of this perspective comes from the low fertility level of Jews, which often is believed to be associated with their minority status (Goldscheider and Uhlenberg 1969; Lehrer 2004).
The last hypothesis, the interaction hypothesis, also is referred to as the socialization hypothesis. This hypothesis examines the role of social interaction in shaping reproductive behavior (Bongaarts and Watkins 1996; Montgomery and Casterline 1996; Watkins 1992). It believes that religious institutions are a major source of social exposure through which members of a certain religious group adopt their religious doctrines and are impacted by other members’ fertility behavior. Such an approach is in line with the social networks theory and the “diffusion theory” of fertility which emphasize the role of interaction in shaping behavior and the diffusion effect of family planning ideology in influencing fertility (Coale and Watkins 1986; Watkins 1992). Such a perspective also echoes the idea that “fertility is an aggregate property, a characteristic of the groups to which the couple belong and not directly of the couple themselves” (Ryder 1974: 76). Recent research shows more and more support for this hypothesis (Knodel, Gray, Sriwatchrin, and Peracca 1999; Marchena and Waite 2001; Ongaro 2001; Yeatman and Trinitapoli 2007).
unclear. For instance, fundamentalist Protestant religious doctrines are pronatalist, which forbid artificial forms of contraception, resist abortion, and favor relatively larger families (Lehrer 1996; Marcum 1981). On average, fundamentalist Protestants also have a stronger religiosity compared to other religious groups: they attend religious services more frequently than people of other religious denominations (Lehrer 2004). Previous literature rarely examines whether their higher fertility rate is caused by their greater level of religiosity by attending church services more often or is caused by the religious teaching of their denomination regarding favoring more children. In order to fill these voids, in this article, I try to bring gender and religiosity into religious studies of fertility, and I empirically examine: (1) whether religiosity affects people’s fertility; (2) whether fertility differentials also occur among men who belong to different religious denominations; and (3) whether men’s and women’s fertility outcomes are impacted by religious affiliation and religiosity in significantly different manners. Specifically, I intend to study how men’s and women’s fertility patterns differ in various religious groups and among members with various levels of religiosity. I will set forth a series of hypotheses to examine these issues in the next section, followed by empirical tests of the hypotheses.
2. Hypotheses on religion, religiosity, gender and fertility
I now present my hypotheses regarding the above three major issues. Religiosity is an important aspect of religion which often is viewed as the intensity of religious beliefs and participation (Myers 1996). Religious beliefs are, notably, beliefs in hell, heaven, and an afterlife. Religious participation includes such behaviors as church attendance, participating in church-related activities, viewing/listening to religious broadcasts, and reading the holy books of the religion (Barro and McCleary 2003; Corijn 2001; Myers 1996). Strong religiosity usually is marked by strong daily influence of religious beliefs on individual decisions and frequent participation in religious activities.
Then why does religious participation influence people’s demographic behavior? As stated earlier, the social networks approach and the “diffusion theory” of fertility provide explanations for this mechanism. According to the social networks perspective, religious people build their social networks by attending church activities. Regular churchgoers are connected more strongly to their religious group, i.e. their social networks. As a consequence, they are more likely to accept the religious doctrines of their churches. In terms of their reproductive behavior, they are thus more likely to be influenced by their church teachings of childbearing as well as by the patterns of other church members’ fertility behavior. In a similar vein, the “diffusion theory,” initiated by Princeton demographers, explains the effect of religious participation by looking at the role of cultural diffusion and social interaction in spreading new cultural models of reproduction, i.e. birth control and family planning (Coale and Watkins 1986; Watkins 1992). Based on the empirical findings and these explanations, I expect church participation to be highly influential in the U.S. My first hypothesis is as follows:
Hypothesis 1: The more frequently people attend religious services, the more children they will have, controlling for religious affiliation and other factors.
Besides religious participation, religious beliefs also are important. In Austria, researchers observe that non-religious persons have a lower marital rate than religious persons. Non-religious women also have a lower rate of first childbearing than religious ones (Pfeiffer and Nowak 2001). A similar pattern also is found in other European countries such as Britain and Italy (Berrington 2001; Ongaro 2001). Westoff and Frejka (2007) examine fertility patterns among European Muslim women and find that fertility is directly correlated with fertility. Muslim women have a significantly higher level of fertility than non-Muslim women who are less religious and hold less strong family values. If “no religion” is considered as one extreme on the religiosity scale, then empirical findings seem to suggest that being more religious or having stronger religious beliefs is related positively to the marital rate and the likelihood of giving first birth. Such a positive effect can be explained by the fact that most religions encourage marriage and highly value the family. Since the majority of fertility behavior does occur within the context of marital unions in most countries (Bongaarts 1982; Hervitz 1985; Mosher, Johnson, and Horn 1986), having stronger religious beliefs is expected to have a positive effect on fertility. Based on this rationale, I predict the following:
Hypothesis 2: People who have strong religious beliefs are more likely to have more children than people without such beliefs, controlling for religious affiliation and other factors.
Hypothesis 3: Fertility differentials among various religious groups will decrease once religiosity is taken into consideration, controlling for other factors.
Regarding the effect of religion on male fertility compared to that on female fertility, researchers have found mixed results. The majority of researchers have suggested that, in general, women’s behavior is more likely to be impacted by religious values and beliefs compared to men (Corijn and Klijzing 2001; Goldscheider and Goldscheider 1993). An opposite finding is shown in Pfeiffer and Nowak’s (2001) work. They observe that in Austria, men are more likely to be influenced by religion in terms of marriage and childbearing. Other researchers, however, have argued that there are not significant gender differences with regard to the relationship between religion and fertility. Janssen and Hauser (1981) examine the effects of religious and secular socialization on Wisconsin men’s and women’s fertility. Their findings confirm a positive relationship between Catholic religion and the preference for having more children without showing significant gender differentials. In Britain, Berrington (2001) shows that people with stronger levels of religiosity are more likely to marry early and give birth to children, but such a pattern does not differ among men and women.
The above findings suggest that religion does have a certain effect on both male and female fertility and fertility-related behavior. The discrepancy mainly occurs in terms of whether religion has a stronger effect on women than on men. And the majority of these studies reveal that women are influenced more by religion than men are. Based on these results, I predict the following:
Hypothesis 4: There are no significant gender differences regarding fertility differentials among religious groups, controlling for other factors. But,
Hypothesis 5: Religious participation promotes women’s fertility to a greater extent than men’s fertility, controlling for other factors. And,
Hypothesis 6: Religious beliefs have a stronger push effect on women’s fertility than on men’s, controlling for other factors.
3. Data and variables
datasets present male and female reports in two separate files. In my analyses, I combine the female and male datasets together for the purpose of generating gender interaction terms in order to test whether the impacts of religion and religiosity on fertility vary by gender.
When studying male fertility, the validity of male reports is always the concern of researchers. The problem of underreporting in the NSFG dataset is pointed out by Rendall and associates (Rendall, Joyner, Peters, Yang, Handcock, and Ryan 2006) who assess fatherhood at younger ages. The reason they chose this group of male respondents is because data problems are normally greatest at younger ages. Their evaluation results reveal that underreporting of fatherhood for this group of men does exist in the NSFG dataset; therefore, applying this dataset to examine fertility outcome could be problematic. Considering this matter, my analyses of the NSFG datasets are broken into two parts for comparison purposes. The first part contains all male respondents and the second part only includes those men who are 26 years of age and older. Correspondingly, the sample sizes for the two parts of analyses are 10,451 (3,938 men and 6,513 women) and 8,735 (2,222 men and 6,513 women), respectively. These respondents provided information regarding their religious denominations and religiosity. Respondents who did not provide such information are eliminated from the analyses.
The dependent variable used in the research is fertility, which is measured by the number of children ever born (CEB) to a male or female respondent. For a male respondent, the survey question for CEB is “how many biological children have you ever had?” and for a female respondent, the equivalent question is “how many live births have you ever had?” These two questions are considered as measuring tool of the same thing for men and women, i.e. the CEB.
3.1 Independent variables
The independent variables are the religious variables, namely, religious affiliation and religiosity. The religious affiliation variable is operationalized as the respondent’s current religious domination, which is classified as a set of four dummy variables: Catholic, fundamentalist Protestant, other Protestant, and other non-Christian religion. This classification follows that of the 2002 NSFG reports (National Center for Health Statistics 2005). Among those, fundamentalist Protestants include Baptists/Southern Baptists; other Protestants include Methodists, Lutherans, Presbyterians and Episcopalians.
These measurements capture the behavior and belief dimensions of religiosity, respectively. Since there is no question directly asking the strength of religious belief in the NSFG questionnaire, the importance of religion in the respondent’s daily life is used as the question measuring the strength of religious belief. For people who are affiliated with certain religious dominations, possible responses for the religious participation variable are: more than once a week, once a week, 1-3 times per month, and less than once a month. Responses for the religious beliefs item are: very important, somewhat important, and not important. Note that the religious belief measurement in the NSFG dataset is inapplicable for those respondents who claim themselves having no religious affiliation. The data restriction allows me to only include respondents who claimed to be affiliated with religious denominations to examine the effect of religiosity on fertility. In order to provide some information of the respondents who are eliminated from the analyses, I present some demographic and socioeconomic characteristics of those people in Table 1-2.
The NSFG questionnaire does contain questions associated with the respondents’ religious denomination and religiosity during their upbringing, which measure religious affiliation and the frequency of religious service attendance at age 14. But my preliminary analyses do not show significant effects of these variables on CEB. Thus, I decided not to use those variables in the analyses.
3.2 Control variables
My analyses also control for some established covariates that influence fertility. These include demographic factors such as age, race and ethnicity, nativity, and marital status (Coale and Trussell 1974; Jaffe and Cullen 1975; Saenz and Morales 2005; Singley and Landale 1998; Xie and Pimentel 1992), and socioeconomic factors, for example, educational attainment, employment status, and income (Ballard 2004; Ellison, Echevarria, and Smith 2005; Lehrer 1996; Sander 1992). These variables are used as control variables in the equations predicting both male and female fertility. Sex is also controlled in the combined dataset.
Income is measured by total combined gross family income in 2001, which is coded into four categories, ranging from under $25,000 to $75,000 or more.
Table 1-1: Descriptive statistics for respondents who claimed a religious affiliation: U.S., 2002
Male (all respondents)
Male
(26 and over) Female (all respondents)
Variables Mean
(or %) SD N Mean
(or %) SD N Mean (or %) SD N Dependent variable
CEB 1.2 0.05 3,247 1.5 0.05 2,126 1.3* 0.03 6,512
Independent variables
Religious affiliation 3,938 2,222 6,513
Catholic 35.4 24.1 26.8
Fundamentalist Protestant 24.1 31.2 33.0
Other Protestant 31.0 34.9 33.4
Other non-Christian 9.5 9.8 6.9
Frequency of attending religious
services 3,938 2,219 6,507
More than once a week 10.7 10.0 14.1
Once a week 23.0 23.1 25.3
1-3 times per month 19.0 18.9 19.2
Less than once a month 29.0 30.2 28.0
Never 18.4 17.8 13.4
Importance of religious beliefs 3,920 2,215 6,495
Very important 47.5 49.5 57.9
Some important 40.3 38.3 36.1
Not important 12.2 12.2 6.0
Control variables Demographic factors
Age 29.9 0.24 3,938 35.3 0.19 2,222 30.1 0.19 6,513
Race 3,938 2,222 6,513
Hispanic 17.8 17.5 15.3
Non-Hispanic white 63.4 64.6 64.5
Non-Hispanic black 12.5 11.5 14.7
Non-Hispanic other 6.3 6.5 5.5
Nativity-if foreign born 3,938 2,222 6,499
Native born 96.1 84.0 85.5
Foreign born 4.0 16.0 14.5
If R ever married 3,938 2,222 6,513
Yes 46.7 75.6 59.5
Table 1-1: (Continued)
Male
(all respondents)
Male (26 and over)
Female (all respondents)
Variables Mean
(or %) SD N
Mean
(or %) SD N
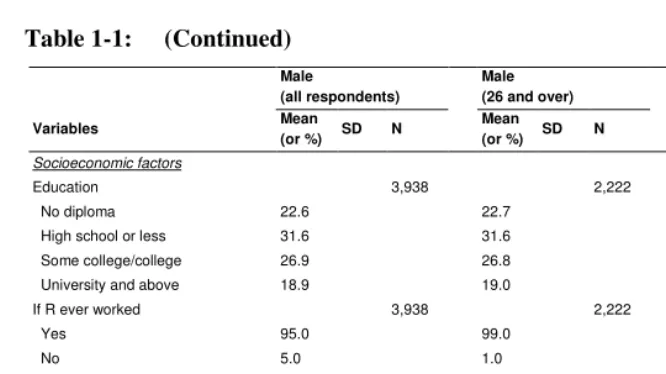
Mean (or %) SD N Socioeconomic factors
Education 3,938 2,222 6,513
No diploma 22.6 22.7 21.1
High school or less 31.6 31.6 27.6
Some college/college 26.9 26.8 29.2
University and above 18.9 19.0 22.2
If R ever worked 3,938 2,222 6,513
Yes 95.0 99.0 90.1
No 5.0 1.0 9.9
Combined family income 3,938 2,222 6,513
$24,999 and under 29.4 24.7 32.8
$25,000-$49,999 33.3 35.1 30.4
$50,000-$74,999 18.3 19.6 19.1
$75,000 and above 20.8 21.6 17.7
Sources: derived from NSFG Cycle 6 male and female datasets, 2002.
Table 1-2: Descriptive statistics for respondents who did not claim a religious affiliation: U.S., 2002
Male (all respondents)
Male
(26 and over) Female (all respondents)
Variables Mean
(or %) SD N
Mean
(or %) SD N
Mean (or %) SD N Dependent variable
CEB 0.82 0.05 856 1.15 0.05 487 1.03* 0.03 1,107
Independent variables - - -
Religious affiliation - - -
Frequency of attending religious services - - -
Importance of religious beliefs - - -
Control variables Demographic factors
Age 29.3 0.24 972 35.3 0.19 512 29.0 0.20 1,107
Race 972 512 1,107
Hispanic 12.0 10.0 11.7
Non-Hispanic white 74.0 78.6 73.2
Non-Hispanic black 9.3 8.3 9.3
Non-Hispanic other 4.8 3.1 5.8
Nativity-if foreign born 971 511 1,109
Native born 87.4 87.2 86.9
Foreign born 12.6 12.1 13.1
If R ever married 3,938 512 1,107
Yes 39.2 60.6 50.0
No 60.8 39.4 50.0
Socioeconomic factors
Education 972 512 1,107
No diploma 24.4 16.0 22.2
High school or less 30.9 32.7 30.5
Some college/college 22.5 19.2 26.3
University and above 22.2 32.1 21.0
If R ever worked 972 512 1,107
Yes 93.3 99.1 91.6
No 6.7 0.9 8.4
Combined family income 972 512 1,107
$24,999 and under 34.3 19.8 34.9
$25,000-$49,999 33.1 37.0 28.9
$50,000-$74,999 11.9 21.1 17.8
$75,000 and above 20.7 22.1 18.4
Sources: derived from NSFG Cycle 6 male and female datasets, 2002.
In terms of the independent variables, Catholicism seems to be the most popular religion for all male respondents who claimed a religion (35.4%), followed by other Protestant religions (31%), fundamentalist Protestant religions (24.1%), and other non-Christian religions (9.5%). When only males who are twenty-six and over are considered, respondents who are affiliated with other Protestant religions (34.9%) and fundamentalist Protestant (31.2%) surpass Catholicism (24.1%). A similar pattern is shown among all religious females. More young men are affiliated with Catholic religion is probably because although there has been a decline across cohorts in the propensity to declare religious beliefs, Catholic males are to a certain extent “immune” to this decline. So it seems that compared to all male respondents, the distribution of older male respondents who are twenty-six and over to various religious denominations are more similar to that of the female respondents. As far as religious participation is concerned, all male respondents and those who are twenty-six and older do not show significantly different patterns. The majority (around 30%) of the two sets of men reported attending religious services less than once a month, whereas female respondents show a pattern of attending religious services more frequently than males. Compared to their male counterparts, female respondents also show a tendency to consider religious beliefs to be more important. For instance, 57.9% of female respondents report that religious beliefs are “very important” in their daily lives, compared to 49.5% of male respondents 26 and over, and 47.5% of all males. These results somehow indicate that women are more likely to have a higher level of religiosity as compared to men, and older men tend to be more engaged in religion as compared to younger men. More women and older men self-reported as being Protestant, whereas a higher percentage of younger men claimed themselves as Catholic.
Demographically speaking, there is a higher percentage of Hispanic males than females and a lower percentage of black males than females in the dataset. Also, the percentage of married women is higher than that of married men, which could be another reason for a higher female than male fertility rate due to the higher marriage rate of women than that of men. In terms of socioeconomic characteristics, men 26 and over reported a higher total combined family income as compared to the sub-groups that include all males and females. In general, men tend to report a higher total combined family income than women. The percentage of men who ever participated in the labor force is higher than that of women, 99.0% versus 90.1%. Interestingly, however, a higher percentage of female respondents reported a higher level of education as compared to their male counterparts.
reverse pattern is shown among female respondents and male respondents who are 26 and over. In addition, non-religious population is more likely to stay single than religious population. As far as socioeconomic characteristics, there are a higher percentage of men who have received university education among non-religious than religious respondents. For women, an opposite situation seems to be true, i.e., a higher percentage of non-religious women reported high school or lower educational attainments as compared to their female religious counterparts. Only marginal differences are shown with regard to employment status among non-religious and religious population. Compared to religious respondents, higher percentages of non-religious female respondents and male respondents who are 26 and over are distributed to higher family income categories (categories with family income above $50,000). These demographic and socioeconomic differentiations between religious and non-religious groups indicate that it is necessary to examine the differential effects of religiosity on fertility among these two groups in future research. It is possible that demographic and socioeconomic factors could interact with religiosity to determine fertility.
4. Statistical methods and results
Given that CEB is a count variable, Poisson regression is the statistical procedure used to conduct these analyses. The Poisson model is superior to ordinary least squares (OLS) or other linear models in this instance because the distribution of a count variable, such as CEB, is one that is heavily skewed with a long right tail, especially in the cases of low fertility populations. The skewed distribution of the CEB is due to the observed distribution of data with a very low mean, which reflects many women desiring few children and few women wanting many children in low fertility countries. Poisson regression is the suitable procedure to estimate CEB also because CEB is a positive integer. Applying the linear regression model to count outcomes is not appropriate since it could result in “inefficient, inconsistent, and biased estimates” (Long and Freese 2006: 349).
The Poisson regression model can be written as:
(
i i ki k)
i=expa+X1b1+X2b2+...+X b
µ
Where µi is the mean of the distribution, which is estimated from observed
characteristics of the independent variables; a is the constant; bi represents deviation
respondent based on the respondent’s religious affiliation, level of religiosity, and so forth. All cases are weighted based on the final weights of each sample given by the NSFG.
Since 46% of females and 42% of male respondents reported themselves as childless, there might be a problem of over-dispersion and too many zeroes in the dataset. To justify these potential problems, I also estimate negative binomial regression models (NBRMs). Additionally, I drop the cases with a CEB value of 0, and I use the zero-truncated models (ZTMs) to compare the results with the Poisson regression results.
Table 2-1: Poisson regression of CEB on religious affiliation, participation and beliefs: all male and female respondents in the U.S., 2002
Variables Model 1 Model 2 Model 3 Model 4 Model 5 Religious variables
Current religious affiliation (ref. = Catholic)
Fundamentalist protestant 0.06 0.06 0.04
Other protestant 0.04 0.05 0.03
Other non-Christian religion -0.15* -0.14* -0.14*
Religiosity
Frequency attending religious services 0.02 0.01
Importance of religious beliefs 0.09*** 0.08***
Demographic factors
Age 0.05*** 0.06*** 0.05*** 0.05*** 0.06***
Gender (ref. = male) -0.14*** -0.15*** -0.13*** -0.14*** -0.13***
Race (ref. group = Hispanic)
Hispanic 0.23*** 0.21*** 0.19*** 0.23*** 0.21***
Non-Hispanic black 0.25*** 0.26*** 0.23*** 0.25*** 0.22***
Non-Hispanic other 0.21* 0.16 0.15 0.21* 0.18
If R has ever been married 1.02*** 1.02*** 1.01*** 1.01*** 1.01***
Socioeconomic factors
Highest degree R ever earned -0.07*** -0.07*** -0.07*** -0.07*** -0.07***
Total combined family income -0.02*** -0.03*** -0.02*** -0.03*** -0.02***
Constant -1.55*** -1.54*** -1.70*** -1.58*** -1.72***
N 9,759 9,750 9,729 9,750 9,729
Prob > F 0.0000 0.0000 0.0000 0.0000 0.0000
Sources: derived from NSFG Cycle 6 male and female datasets, 2002.
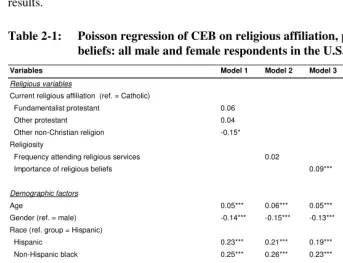
Table 2-1 presents the Poisson regression results analyzing the combined dataset with all male and female respondents. In model 1, I include the religious affiliation variable and socioeconomic characteristics as the control variables. Compared to being Catholics, being members of other non-Christian religions multiplies the expected number of CEB by a factor of 0.86; that is, it decreases by 14% (e-0.15), other things being equal. Fundamentalist Protestants and other Protestants do not seem to have significantly different levels of CEB compared to Catholics.
In models 2 and 3, I replace the current religious denomination variable with the variables of frequency attending religious services and importance of religious beliefs in people’s daily lives, respectively. Apparently, people who reported that religious beliefs play an important role in their daily lives tend to have a higher level of CEB, whereas religious participation does not show a significant impact on fertility. A similar pattern also is found in models 4 and 5, after controlling the effect of religious denomination on fertility. Over the total range of scale from 1 to 3 measuring religious beliefs, the expected CEB is multiplied by a factor of 1.1 (e0.08), holding the other variables constant (see model 5). This means that the strength of religious beliefs does have a significantly positive impact on people’s fertility, regardless of to which religious denomination they belong. However, frequent churchgoers do not really show a significantly higher level of CEB. These findings corroborate hypothesis 2 but reject hypothesis 1. Hypothesis 3 is tested by comparing the results of model 1 with models 4 and 5. Results show that fertility differentials among various groups do not change significantly, nor do the other variables after taking religiosity into consideration. This finding does not support hypothesis 3, which means that fertility differentiation among people who belong to different religious groups keeps a similar pattern after controlling for the levels of people’s religiosity.
Table 2-2: Poisson regression of CEB on religious affiliation, participation and beliefs: male respondents 26 and over and all female respondents in the U.S., 2002
Variables Model 1 Model 2 Model 3 Model 4 Model 5 Religious variables
Current religious affiliation (ref. = Catholic)
Fundamentalist protestant 0.05 0.05 0.03
Other protestant 0.03 0.03 0.02
Other non-Christian religion -0.16* -0.15* -0.16*
Religiosity
Frequency attending religious services 0.02 0.01
Importance of religious beliefs 0.09*** 0.08***
Demographic factors
Age 0.05*** 0.05*** 0.05*** 0.05*** 0.05***
Gender (ref. = male) -0.10*** -0.10*** -0.09*** -0.10*** -0.08***
Race (ref. group = Hispanic)
Hispanic 0.20*** 0.18*** 0.17*** 0.20*** 0.18***
Non-Hispanic black 0.24*** 0.24*** 0.22*** 0.23*** 0.21***
Non-Hispanic other 0.18* 0.13 0.11 0.17 0.15
If R has ever been married 0.96*** 0.96*** 0.96*** 0.96*** 0.95***
Socioeconomic factors
Highest degree R ever earned -0.07*** -0.07*** -0.07*** -0.07*** -0.07***
Total combined family income -0.02*** -0.02*** -0.02*** -0.03*** -0.02***
Constant -1.31*** -1.32*** -1.48*** -1.35*** -1.48***
N 8,638 8,629 8,613 8,629 8,613
Prob > F 0.0000 0.0000 0.0000 0.0000 0.0000
Sources: derived from NSFG Cycle 6 male and female datasets, 2002.
Note: R refers to respondent. * p < 0.05, ** p < 0.01, *** p < 0.001 (two-tailed tests). Regression results for nativity and ever work
are not reported due to non-significant regression coefficients.
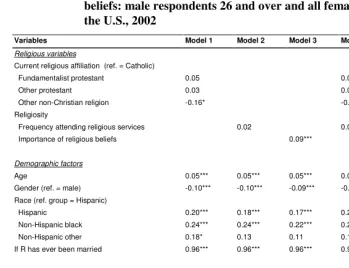
being a male on fertility can be explained by the later fertility peak of men and the problem of underreporting which may happen more frequently among younger men than among older. The weaker effect of marriage on fertility in Table 2-2 shows the importance of marriage on childbearing behavior, especially among younger men.
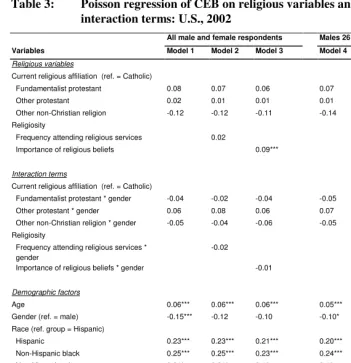
Until now, I have tested hypotheses on impacts of religious denominations and religiosity on fertility. Next, I will elaborate the model that tests whether the effects of the religion and religiosity on fertility vary by gender. Models 1, 2 and 3 in Table 3 display Poisson regression results when analyzing all male and female respondents after generating gender interaction terms. In model 1, I include variables of religious denomination, gender interaction terms, and socioeconomic variables to test hypothesis 4 to determine whether fertility differentials among religious groups vary by gender. As can be seen, the gender interaction terms generated by religious denominations and gender are not significant, which indicates that fertility differentials among religious groups do not vary substantially between men and women. This supports hypothesis 4, as there are no significant gender differences regarding fertility differentials among religious groups, controlling for other factors. In models 2 and 3 of Table 3, I test whether the effect of religious participation and religious beliefs on fertility varies by gender after controlling religious denominations, respectively. Neither of the gender interaction terms is observed as significant. This opposes hypotheses 5 and 6, and it implies that stronger religiosity does not appear to increase women’s fertility to a greater extent than men’s, controlling other factors.
Table 3: Poisson regression of CEB on religious variables and gender interaction terms: U.S., 2002
All male and female respondents Males 26 + and all females Variables Model 1 Model 2 Model 3 Model 4 Model 5 Model 6 Religious variables
Current religious affiliation (ref. = Catholic)
Fundamentalist protestant 0.08 0.07 0.06 0.07 0.06 0.05
Other protestant 0.02 0.01 0.01 0.01 0.00 -0.01
Other non-Christian religion -0.12 -0.12 -0.11 -0.14 -0.13 -0.12
Religiosity
Frequency attending religious services 0.02 0.02
Importance of religious beliefs 0.09*** 0.10***
Interaction terms
Current religious affiliation (ref. = Catholic)
Fundamentalist protestant * gender -0.04 -0.02 -0.04 -0.05 -0.03 -0.04
Other protestant * gender 0.06 0.08 0.06 0.07 0.08 0.07
Other non-Christian religion * gender -0.05 -0.04 -0.06 -0.05 -0.04 -0.06
Religiosity
Frequency attending religious services * gender
-0.02 -0.02
Importance of religious beliefs * gender -0.01 -0.04
Demographic factors
Age 0.06*** 0.06*** 0.06*** 0.05*** 0.05*** 0.05***
Gender (ref. = male) -0.15*** -0.12 -0.10 -0.10* -0.06 0.00
Race (ref. group = Hispanic)
Hispanic 0.23*** 0.23*** 0.21*** 0.20*** 0.20*** 0.18***
Non-Hispanic black 0.25*** 0.25*** 0.23*** 0.24*** 0.23*** 0.21***
Non-Hispanic other 0.21* 0.21* 0.19 0.18 0.18 0.16
If R has ever been married 1.02*** 1.02*** 1.01*** 0.96*** 0.96*** 0.95***
Socioeconomic factors
Highest degree R ever earned -0.07*** -0.07*** -0.07*** -0.07*** -0.07*** -0.07***
Total combined family income -0.02*** -0.03*** -0.02*** -0.02*** -0.02*** -0.02***
Constant -1.55*** -1.60*** -1.73*** -1.31*** -1.37*** -1.52***
N 9,759 9,750 9,729 8,638 8,629 8,629
Prob > F 0.0000 0.0000 0.0000 0.0000 0.0000 0.0000
Sources: derived from NSFG Cycle 6 male and female datasets, 2002.
Note: R refers to respondent. * p < 0.05, ** p < 0.01, *** p < 0.001 (two-tailed tests). Regression results for nativity and ever work
Because 46% of men and 42% of women reported having no children, there may be a problem of overdispersion, i.e. the variance of CEB is greater than the mean. So I estimate the negative binomial regression models (NBRMs) to compare the results with those of the Poisson regression analyses. Comparison results do not show any evidence of overdispersion (findings are not presented here and are available from the author upon request) because the alphas are zero, which indicate that the NBRMs reduce to the Poisson regression models. The zero-truncated regression (ZTM) results shown in Table 4 indicate that religion and religiosity have similar impacts on people who voluntarily choose not to have children (i.e. the expected CEBs are not always 0) and people who are physically infertile (i.e. the expected CEB are always 0). However, I do find a few distinctions comparing the Poisson and the ZTM results. First, fertility differences among Catholics and other non-Christian religious groups become insignificant in the ZTMs, after controlling for other factors. This echoes the finding that fertility differentials among religious groups are shrinking. This is especially the case when only people who have children are considered. Second, the magnitude of demographic factors, especially marriage, in influencing fertility reduces in the ZTMs compared to that in the Poisson regression models. This finding suggests that marriage is crucial in terms of childbearing. But once childbearing behavior occurs, its significance decreases. A finding from the ZTMs that is worth highlighting is that the results of datasets with and without younger male respondents are almost identical, with the effect of gender being slightly reduced. Such a finding could be due to less variation in fertility behavior among men and women who have already become parents compared to populations that are composed of men and women who are not parents.
Table 4: Zero-truncated regression of CEB on religious variables, demographic factors and gender interaction terms: U.S., 2002
All male and female respondents Males 26 + and all females Variables Model 1 Model 2 Model 3 Model 4 Model 5 Model 6 Religious variables
Current religious affiliation (ref. = Catholic)
Fundamentalist protestant 0.05 0.04 0.03 0.05 0.04 0.03
Other protestant 0.04 0.04 0.02 0.04 0.04 0.02
Other non-Christian religion -0.04 -0.04 -0.03 -0.04 -0.04 -0.03
Religiosity
Frequency attending religious services 0.03 0.03*
Importance of religious beliefs 0.10** 0.11**
Interaction terms
Current religious affiliation (ref. = Catholic)
Fundamentalist protestant * gender -0.02 0.01 -0.01 -0.03 -0.00 -0.02
Other protestant * gender 0.00 0.02 0.00 -0.01 0.02 -0.00
Other non-Christian religion * gender -0.10 -0.09 -0.12 -0.14 -0.13 -0.15
Religiosity
Frequency attending religious services *
gender -0.04 -0.04
Importance of religious beliefs * gender -0.05 -0.05
Demographic factors
Age 0.04*** 0.04*** 0.04*** 0.04*** 0.04*** 0.04***
Gender (ref. = male) -0.09 0.01 0.05 -0.06 0.04 0.08
Race (ref. group = Hispanic)
Hispanic 0.12** 0.12** 0.09* 0.11* 0.11* 0.08
Non-Hispanic black 0.12** 0.11* 0.09 0.11* 0.11* 0.09
Non-Hispanic other 0.20 0.20 0.18 0.19 0.19 0.17
If R has ever been married 0.22*** 0.21*** 0.21*** 0.21*** 0.21*** 0.21***
Socioeconomic factors
Highest degree R ever earned -0.06*** -0.06*** -0.06*** -0.06*** -0.06*** -0.07***
Total combined family income -0.02** -0.02** -0.02** -0.02** -0.02** -0.02**
Constant -0.29*** -0.36*** -0.51** -0.19 -0.26 -0.42***
N 5,304 5,299 5,299 5,130 5,125 5,125
Prob > F 0.0000 0.0000 0.0000 0.0000 0.0000 0.0000
Sources: derived from NSFG Cycle 6 Male and Female Datasets, 2002.
5. Conclusion
In this article, I shed light on the effects of religious denomination and religiosity on male and female fertility. Mosher and associates (Mosher, Johnson, and Horn 1986; National Center for Health Statistics 2005; Westoff and Jones 1979) have reported a shrinking pattern of fertility differentials among religious groups. My findings reflect this by showing no significant fertility differences between fundamentalist Protestants, other Protestants, and Catholics. Catholics only show a significantly higher level of fertility when compared to other non-Christian religious people. And such a fertility differential disappears when childless respondents are dropped from the analyses.
Compared to studies of religious denomination and fertility, religiosity has received far less attention in the literature. The findings demonstrated in this research, however, help to address this shortcoming. I find even after controlling religious denomination and demographic and socioeconomic factors, the importance of religious beliefs still exhibits a graded association with fertility in the United States. This finding echoes the findings based on the social contexts of European countries (Adsera 2007; Ongaro 2001; Westoff and Frejka 2007). This substantially positive effect of religious beliefs on fertility must have something to do with the role of religion in guiding human behavior in terms of the issues of sexuality, cohabitation, marriage, and the function of family. In general, a number of religious doctrines are linked to delayed sexual debut and entry into cohabitation, and more positive attitudes toward entering marital unions and having children (Bearman and Bruckner 2001; Lehrer 2004; Marchena and Waite 2001). As stated earlier in this article, Catholicism encourages large family size and is strongly against abortion. The Mormon theology emphasizes the central role of the family in the religious community. Both Protestants and Mormons have incentives to marry early and are oriented to home-based activities. As a result, deeming such religious beliefs important in daily life makes people more likely to internalize their church teachings and thus to favor a large family size. This perhaps explains why religiosity is influential in terms of both male and female fertility.
I do not find significant effects of religious participation on fertility. In fact, frequent churchgoers only display a higher level of fertility when demographic and socioeconomic factors are not controlled (findings are available from the author upon request). So it is likely that fertility differences are caused by variations in demographic and socioeconomic factors among religious members rather than their frequency of religious participation. Such a finding echoes the characteristics hypothesis. It suggests that religious beliefs might be a better predictor of fertility than the behavioral dimension.
why religious denominations determine men’s and women’s fertility in a similar way. But it is hard to interpret why religiosity does not show a stronger effect on female fertility than on male, which is the general pattern found in previous studies. One possible explanation for this inconsistency is that previous studies seldom use significance tests to justify whether the effects of religious variables on male and female fertility are different from each other. Different regression coefficients in separate male and female datasets could be caused by non-identical male and female sample sizes and standard errors. Thus, results based on statistical tests which take sample size and standard error into consideration should be more reliable than those not based on such tests. Such statistical methods include generating gender interaction terms and Z statistical tests (Paternoster, Brame, Mazerolle, and Piquero 1998). The stronger effect of religiosity on female fertility observed in previous literature probably is based on the larger regression coefficients estimated in the female models, which indeed have not been statistically compared with those of males. The other possible explanation is that most of the literature cited in the current research is drawn from European societies. The American social context may lead to dissimilar findings with regard to the effect of religiosity on fertility.
Additional research is warranted in this area to contrast religious influences on fertility, especially at the national level. I recognize that the measurement of religious denominations and religiosity is very limited in the NSFG dataset. Some important dimensions of religious participation and beliefs, such as dimensions of frequency of prayer or meditation, frequency of reading holy books, or beliefs in a God or an afterlife, are not available in the NSFG dataset and are thus not considered in this research. Future research that includes these variables would improve the religious studies of male and female fertility. In addition, this article excludes those people without religious affiliations due to data unavailability in the NSFG dataset. It is possible that some people who are not affiliated with any religions actively participate religious services. In order to fully address the impact of religiosity on fertility, future research needs to bring those without religious affiliations into the analysis.
The comparison of the results of Poisson and ZTMs of all respondents and respondents excluding younger men do not vary from each other in a notable manner. This suggests that serious underreporting of births among younger men that may exist in the NSFG dataset does not change significantly the results of my religious studies of fertility.
In sum, religion is a very important institution spreading behavioral norms and providing social support for people. My analyses reveal that the fertility gap among religious groups is decreasing, whereas religiosity, especially religious beliefs, demonstrates a significantly positive effect on fertility. Women do not exhibit a substantially greater likelihood of being influenced by either religious denomination or by religiosity than men. Thus, religion does not seem to be a factor that differentiates male and female fertility among the U.S. religious population.
6. Acknowledgements
References
Adsera, Alicia. 2006. "Marital Fertility and Religion in Spain, 1985 and 1999." Population Studies 60:205-221.
Ballard, Brandi Nicole. 2004. "Patterns of Intended and Actual Fertility among Sub-Groups of Foreign-Born and Native-Born Latinas." Thesis, Department of Sociology, Texas A&M University, College Station.
Barro, Robert J. and Rachel M. McCleary. 2003. "Religion and Economic Growth across Countries." American Sociological Review 68:760-781.
Bearman, Peter S. and Hannah Bruckner. 2001. "Promising the Future: Virginity Pledges and First Intercourse." American Journal of Sociology 106:859-912.
Berrington, Ann. 2001. "Transition to Adulthood in Britain." Pp. 67-102 in Transition in Adulthood in Europe, edited by M. Corijn and E. Klijzing: Kluwer Academic Publisher.
Bongaarts, John. 1982. "The Fertility-inhibiting Effects of the Intermediate Fertility Variables." Studies in Family Planning 13:179-189.
Bongaarts, John and Susan Cotts Watkins. 1996. "Social Interaction and Contemporary Fertility Transition." Population and Development Review 22:639-682.
Bouvier, Leon F. and S. L. N. Rao. 1975. Socioreligious Factors in Fertility Decline. Cambridge, Mass.: Ballinger.
Chamie, Joseph. 1981. Religion and Fertility: Arab Christian-Muslim Differentials. Cambridge: Cambridge University Press.
Coale, Ansley J. and T. James Trussell. 1974. "Model Fertility Schedules: Variations in the Age Structure of Childbearing in Human Populations." Population Index 40: 185-258.
Coale, Ansley J. and Susan Cotts Watkins. 1986. The Decline of Fertility in Europe. Princeton: Princeton University Press.
Corijn, Martine. 2001. "Transition to Adulthood in Flanders (Belgium)." Pp. 103-130 in Transition in Adulthood in Europe, edited by M. Corijn and E. Klijzing: Kluwer Academic Publisher.
Corijn, Martine and Erik Klijzing. 2001. Transitions to Adulthood in Europe.: New York: Kluwer Academic Publishers.
De Jong, Gordon F. 1965. "Religious Fundamentalism, Socio-Economic Status and Fertility Attitudes in the Southern Appalachians." Demography 2:540-548.
Ellison, Christopher G., Samuel Echevarria, and Brad Smith. 2005. "Religion and Abortion Attitudes among U.S. Hispanics: Findings from the 1990 Latino National Political Survey." Social Science Quarterly 86:192-208.
Freedman, Ronald, Pascal K. Whelpton, and John W. Smith. 1961. "Socio-Economic Factors in Religious Differentials in Fertility." American Sociological Review 26:608-614.
Goldscheider, Calvin. 1971. Population, Modernization, and Social Structure. Boston: Little, Brown .
Goldscheider, Calvin and Peter R. Uhlenberg. 1969. "Minority Group Status and Fertility." American Journal of Sociology 74:361-372.
Goldscheider, Frances K. and Calvin Goldscheider. 1993. Leaving Home before Marriage: Ethnicity, Familism and Generational Relationships. Madison: University of Wisconsin Press.
Hervitz, Hugo M. 1985. "Selectivity, Adaptation, or Disruption? A Comparison of Alternative Hypotheses on the Effects of Migration on Fertility: The case of Brazil." International Migration Review 19:293-317.
Jaffe, A. J. and Ruth M. Cullen. 1975. "Fertility of the Puerto Rican Origin Population-Mainland United States and Puerto Rico: 1970." International Migration Review 9:193-209.
Janssen, Susan G. and Robert M. Hauser. 1981. "Religion, Socialization, and Fertility." Demography 18:511-528.
Johnson-Hanks, Jennifer. 2006. "On the Politics and Practice of Muslim Fertility - Comparative Evidence from West Africa." Medical Anthropology Quarterly 20:12-30.
Saints." Dissertation Thesis, Departement of Anthropology, The State University of New York at Buffalo, Buffalo.
Knodel, John, Rossarin Soottipong Gray, Porntip Sriwatcharin, and Sara Peracca. 1999. "Religion and Reproduction: Muslims in Buddhist Thailand." Population Studies 53:149-164.
Lehrer, Evelyn L. 1996. "The Role of the Husband's Religious Affiliation in the Economic and Demographic Behavior of Families." Journal for the Scientific Study of Religion 35:145-155.
Lehrer, Evelyn L. 2004. "Religion As A Determinant of Economic and Demographic Behavior in the United States." Population and Development Review 30:707-726.
Long, J. Scott and Jeremy Freese. 2006. Regression Models for Categorical Dependent Variables Using Stata. College Station: Stata Press.
Marchena, Elaine and Linda J. Waite. 2000. "Marriage and Childbearing Attitudes in Late Adolescence: Exploring Racial, Ethnic and Gender Differences." Annual Meeting of the Population Association of America, Los Angeles, California.
Marcum, John P. 1981. "Explaining Fertility Differentials among U.S. Protestants." Social Forces 60:532-543.
Marcum, John P. 1988. "Religious Affiliation, Participation and Fertility: A Cautionary Note." Journal for the Scientific Study of Religion 27:621-629.
McQuillan, Kevin. 2004. "When Does Religion Influence Fertility?" Population and Development Review 30:25-56.
Montgomery, Montgomery R. and John B. Casterline. 1996. "Social Learning, Social Influence, and New Models of Fertility." Population and Development Review 22: 151-175.
Mosher, William D. and Gerry E. Hendershot. 1984. "Religious Affiliation and the Fertility of Married Couples." Journal of Marriage and Family 46:671-677.
Mosher, William D., David P. Johnson, and Marjorie C. Horn. 1986. "Religion and Fertility in the United States: The Importance of Marriage Patterns and Hispanic Origin." Demography 23: 367-379.
Myers, Scott M. 1996. "An Interactive Model of Religiosity Inheritance: The Importance of Family Context." American Sociological Review 61:858-866.
National Center for Health Statistics. 2004. "Public Use Data File Documentation, National Survey of Family Growth Cycle 6: 2002, User's Guide." Hyattsville, Maryland.
National Center for Health Statistics. 2005. "Fertility, Family Planning and Reproductive Health of U.S. Women: Data from the 2002 National Survey of Family Growth." Hyattsville, Maryland.
Ongaro, Fausta. 2001. "Transition to Adulthood in Italy." Pp. 173-207 in Transition in Adulthood in Europe, edited by M. Corijn and E. Klijzing: Kluwer Academic Publisher.
Paget, W. John and Ian M. Timaeus. 1994. "A Relational Gompertz Model of Male Fertility: Development and Assessment." Population Studies 48:333-340.
Brame, Robert, Raymond Paternoster, Paul Mazerolle, and Alex Piquero. 1998. "Using the Correct Statistical Test for the Equality of Regression Coefficients." Criminology 36:859-866.
Poston, Dudley L. Jr. 1990. "Voluntary and Involuntary Childlessness Among Catholic and Non-Catholic Women: Are the Patterns Converging?" Social Biology 37:251-265.
Poston, Dudley L. Jr., Chiung-Fang Chang, and Hong Dan. 2006. "Fertility Differences Between the Majority and Minority Nationality Groups in China." Population Research and Policy Review 25:67-101.
Pfeiffer, Christiane and Vera Nowak. 2001. "Transition to Adulthood in Austria." Pp. 43-66 in Transition in Adulthood in Europe, edited by M. Corijn and E. Klijzing: Kluwer Academic Publisher.
Raley, R. Kelly. 2001. "Increasing Fertility in Cohabiting Unions: Evidence for the Second Demographic Transition in the United States?" Demography 38:59-66.
Rendall, Michael S., Kara Joyner, H. Elizabeth Peters, Felicia Yang, Mark S. Handcock, and Ryan Admiraal. 2006. "A Bayesian Approach to Combining Population and Survey Data for Male Fertility Estimation." Annual Meeting of the Population Association of America, Los Angeles, California.
Saenz, Rogelio and Maria Christina Morales. 2005. "Demography of Race and Ethnicity." in Handbook of Population, edited by Poston, Dudley L Jr. and Michael Micklin. New York: Springer.
Sander, William. 1992. "Catholicism and the Economics of Fertility." Population Studies 46:477-489.
Sander, William. 1993. "Catholicism and Marriage in the United States." Demography 30:373-384.
Singley, Susan G. and Nancy S. Landale. 1998. "Incorporating Origin and Process in Migration Fertility Frameworks: The Case of Puerto Rican Women." Social Forces 76:1437-1464.
Watkins, Susan Cotts. 1991. From Provinces into Nations: Demographic Integration in Western Europe, 1870-1960: Princeton University Press.
Westoff, C. F. and E. F. Jones. 1979. "The End of "Catholic" Fertility." Demography 16:209-217.
Westoff, C. F. and Tomas Frejka. 2007. "Religiousness and Fertility among European Muslims." Population and Development Review 33:785-809.
Xie, Yu and Ellen Efron Pimentel. 1992. "Age Patterns of Marital Fertility: Revising the Coale-Trussell Method." Journal of the American Statistical Association 87:977-984.