AGRONOMY AND SOILS
Deep Subsurface Drip Irrigation for Cotton in the Southeast
Ronald B. Sorensen*, Christopher L. Butts, and Russell C. Nuti
R.B. Sorensen*, and C.L. Butts, USDA-ARS-National Peanut Research Laboratory, 1011 Forrester Dr. SE, P.O. Box 509, Dawson, GA 39842; R.C. Nuti, Dow AgroSciences LLC, P.O. Box 120, Shellman, GA 39886
*Corresponding author: [email protected] AbStRACt
Long-term cotton (Gossypium hirsutum L.) yield with various irrigation rates and crop rota-tions, irrigated with subsurface drip irrigation (SSDI) is not known for the US Southeast. A SSDI system was installed in Southwest GA (1998) and maintained for 10 years. the soil is a tifton loamy sand (Fine-loamy, kaolinitic, thermic Plinthic Kandiudults) and treatments consisted of three crop rotations, two drip tube lateral spacings, and three irrigation levels. Crop rotations were alter-nate year cotton (cotton-peanut; Arachis hypogeae L), two years (cotton-maize (Zea mays L.) -peanut), and three years between cotton (cotton-maize-maize-peanut). Drip tube laterals were installed underneath each crop row and alternate crop row furrows. Cotton was not grown in 1999 and 2006. Crops were irrigated daily at 100, 75 and 50% of estimated crop water use. No lint yield difference resulted from crop rotation. Lint yield differences were attributed to irrigation treatments in 4 of 8 years. Lint yields were greatest at the 75% irriga-tion level compared to 50%, and in 3 out of 4 years compared to the 100% irrigation treatment. Higher lint yield with irrigation also coincided with lower seasonal rainfall totals. Drip tube lateral spacing affected lint yield 4 out of 8 years. Across all years, yield data indicates that alternate row furrow lateral spacing is as effective as every-row lateral spacing. Some fiber qualities were affected by ir -rigation, lateral, and rotation treatments, but these effects were small and inconsistent. Subsurface drip irrigation in the Southeast is optimal at the 75% irrigation level with tubing in alternate row furrows.
C
otton production in Georgia has been stable for the last 10 years with an average of over 570,000 ha planted (Georgia Dept. of Ag, 2009), withabout one-third of these cotton hectares irrigated. In 2008, of the total irrigated hectares in Georgia, about 5% was irrigated using drip, trickle, or micro-sprinkler irrigation (Census of Agriculture, 2007). Due to the expense of installing drip systems, it is assumed that most drip systems are limited to use on high value vegetable crops. Total area used for drip or trickle systems in cotton or other commodity row crops such as maize or peanut is unknown.
Economic calculations showed that subsurface drip irrigation (SSDI) would be more profitable in fields under a 30 ha threshold because it requires a lower initial investment per unit land area and has lower pumping costs compared to fixed or towable center-pivot systems (Bosch et al., 1992 and O’Brien et al., 1998). As emphasized by Bosch et al. (1992) and O’Brien et al. (1998), SSDI systems have a near-static cost per hectare compared with overhead sprinkler systems (center pivots), where per hectare cost decreases as the length of the system increases. Overhead sprinkler irrigation systems are the most common in the tri-state area (Alabama, Florida, and Georgia) because they are easy to assemble, durable, do not require elaborate filtering systems, and have owner familiarity with operation and maintenance.
One major concern with overhead sprinkler sys-tems is the loss of water not reaching the intended target due to drift and evaporation and not being available for crop use. In contrast, SSDI is not af-fected by these environmental conditions. Benefits of SSDI include precise placement of water and chemicals, low labor requirements, and reduced runoff and erosion compared with overhead sprin-kler systems. A SSDI system has the capability of frequently supplying water to the root zone thereby reducing the risk of cyclic water stress typical of other irrigation systems. Various researchers have shown that crop yield and quality can be improved using SSDI on tomato (Lycopersicon esculentum
These SSDI systems are adaptable to various field sizes and shapes, an important economic consideration, especially in the Southeast. This economic advantage is apparent when considering the option to design a SSDI system to effectively cover an irregularly shaped field that would not be totally covered with an overhead sprinkler system (Bosch et al., 1992). With proper SSDI designs, these systems can provide sufficient water to dif -ferent field areas according to the area, soils, and crop species.
Drip tube laterals have been tested at 0.2- and 0.3-m soil depths (Bucks et al., 1988; Tollefson, 1985; Phene et al., 1987; Camp et al., 1989) with
cotton, maize, fruits, and vegetables. Drip lateral spacing has been tested at 1, 2, and 3 m apart with yields decreasing as lateral spacing increased to greater than 2 m (French et al., 1985; Lamm et al., 1992; Powell and Wright, 1993; Camp et al., 1997). Comparisons of drip tubing placement have been made at various lateral spacings, i.e., every row or alternate row furrows, in continuous cotton or cotton-maize-peanut rotations (Camp et al., 1993; Camp et al., 1997; Dougherty et al., 2009; Sorensen and Lamb, 2008). In continuous cotton with alternate row furrow lateral spacing, there was year-to-year variability due to climatic patterns, but irrigated cotton yields were greater than nonirrigated yields especially in dry years (Dougherty et al., 2009). A comparison of alter-nate row furrow and lateral spacing under every crop row showed no yield difference in either continuous cotton or a cotton-peanut rotation (Camp et al., 1993; Camp et al., 1997; Sorensen and Lamb, 2008).
The increasing concern for water conservation in the tri-state region creates interest in the use of SSDI due to the greater irrigation efficiency of these systems for individual growers, water and environ-mental conservancy agencies, and policy making agencies. There is little long-term cotton yield or quality response data with SSDI to make manage
-ment recommendations. Therefore, the objectives of this research were to determine the long-term yield and quality response of cotton to: 1) three irrigation rates, 2) two lateral spacings, and 3) three crop rota-tions using SSDI over a 10 year period.
MAteRIALS AND MetHODS
The research site was located in Terrell County near Sasser, GA on a Tifton sandy loam soil (Fine-loamy, kaolinitic, thermic Plinthic Kandiudults) with 2-5% slope. A SSDI system was installed in 1998 on non-irrigated farmland that consisted of three irrigation levels, five crop rotations, two drip tube lateral spacings, and three replications for a to-tal of 90 individual plots. Cotton had been planted two years prior to installing the SSDI system. A 6.8 ha rectangle was split into three equal areas referred to as tiers. There were alley ways (12.2 m minimum) between tiers, at the sides, and crop row ends for equipment turn areas. Each SSDI tier (38 m by 274 m) was randomly assigned an irriga-tion level. The irrigairriga-tion levels were 100%, 75% and 50% of estimated crop water use (Sorensen et al., 2001).
Each SSDI tier consisted of five crop rotations split into three blocks (replications) and each rotation was split using two thin-wall drip lateral spacings. Drip tube laterals were installed underneath each crop row (narrow, 0.91-m) and in alternate crop row furrows (wide, 1.83-m). Sorensen et al. (2001) describes in detail the treatments, irrigation system design criteria, and irrigation control. There were a total of 30 plots arranged in a randomized block design within each irrigation tier.
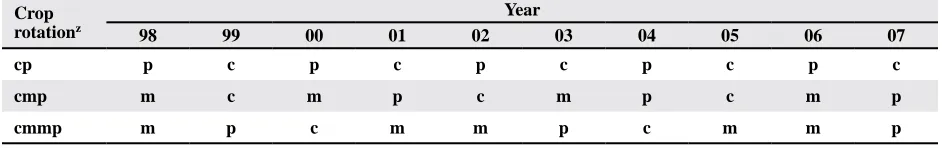
The five crop rotations included continuous peanut (PPP), cotton-peanut (CP), maize-peanut (MP), maize-peanut (CMP), and a cotton-maize-maize-peanut (CMMP) (Table 1). Only the rotations that include cotton will be discussed here. All crops were planted on a 0.91 m row spacing in
a single row orientation.
table 1. Illustration of crop rotation by year.
Crop rotationz
Year
98 99 00 01 02 03 04 05 06 07
cp p c p c p c p c p c
cmp m c m p c m p c m p
cmmp m p c m m p c m m p
The thin-wall drip tube (Super Typhoon, Neta-fim Irrigation, Inc., Fresno, CA; www.netaNeta-fim-usa. com) had a wall thickness of 0.254 mm (10 mil) and emitters spaced every 46 cm with a flow rate of 1.5 L h-1 per emitter. All thin-wall drip tubing was buried a minimum of 31 cm deep using a modified ripper shank. Drip tubing cost $0.082/m or $897 ha-1 for the 0.91-m lateral spacing and half this cost for the 1.83-m lateral spacing.
Irrigation water was applied daily based on replacement of estimated crop water use for cot-ton. Air temperature (maximum, minimum and average), relative humidity, total solar radiation, and precipitation were recorded daily. From 1998 to 2003, meteorological data were collected us-ing programmable logic control (PLC) modules (DirectLogic, AutomationDirect, Inc., Cumming, GA). This system worked well but was vulnerable to lightning. The result was inconsistent runtimes to the irrigation treatments. Therefore, in spring 2004, the PLC system was replaced with a more reliable datalogger system (Campbell Sci., Inc, Logan, UT; CR23X). Daily potential evapotrans-piration (ETo) was estimated using the modified Jensen-Haise equation adjusted for local condi -tions (Jensen and Haise, 1963). Crop coefficients, Kc, were determined by dividing the estimated daily water use of Harrison and Tyson (1993) by archived daily ETo data for the same day and time period. This Kc by time function was then programmed into the datalogger used to control the irrigation system. The estimated daily Kc was then multiplied by the daily estimated ETo from the weather data to calculate the amount of water to apply (ETa) for the 100% irrigation treatment. The other two irrigation levels were determined by multiplying the 100% irrigation level by 75% and 50%. Precipitation totals were subtracted from the estimated daily ET. Irrigation events were scheduled daily except when precipitation exceeded estimated ET.
Fertilizer and lime were applied at the same time and rate as determined by university recom-mendations following a soil test (Collins et al., 2010). Seed bed preparation for all crops consisted of one to two passes (once in the fall and once in the spring) with experimental tillage equipment (USDA-ARS-National Peanut Research Labora-tory) that would essentially till the top 10 to 15 cm of soil. This equipment would reshape the soil into one single planting bed that was about 1.4 m
wide with crop rows spaced 0.91-m apart on these beds. This equipment also provided controlled-traffic such that no wheeled equipment ran over the buried lateral drip-tube positions. A small field cultivator was used to break any soil crust, incorpo-rate herbicides, and provide weed control prior to planting any crop. After harvest, crop residue was mowed, lightly tilled with a disc harrow, and then re-bedded as described previously. A tractor guid-ance system was not available so all row patterns were measured directly from a beginning point and checked periodically across the field by digging and finding specific drip tubing rows/patterns.
Cotton was planted at a density of 106,300 seeds ha-1. Yearly plant and harvest dates, total rainfall, total irrigation amount, and cotton cul-tivar are shown in Table 2. Each year prior to sowing, 22 kg N ha-1 of dry fertilizer was applied along with other recommended fertilizer (phos-phorus and potassium) as determined by soil test (custom blended to match recommendation). A total of 80 kg N ha-1 was applied through the drip system using injector pumps (32-0-0). Each year was managed independently and pesticides and growth regulators were applied as recommended by field scouting (Roberts, 1997). Cotton was harvested using a 2-row spindle picker modified to collect cotton in a large mesh bag. The sample was weighed and ginned. A 0.2 kg sub-sample was collected from each ginned sample to determine lint quality. Gross revenue was determined using the average price received for lint cotton for the 2008 growing season at $1.40 kg-1 (Georgia Dept. of Ag, 2009).
Due to restricted amount of land area, all phases of each crop rotation were not planted every year. Consequently, not every cotton rota -tion combina-tion could be analyzed by rota-tion. Yield and lint quality data were analyzed using a
ReSULtS AND DISCUSSION
Rainfall and irrigation. Cotton was planted near the end of April and first part of May the opti -mal planting time for cotton in this region. Rainfall was least in 2000 (335 mm) and greatest in 2005 (756 mm) with an average rainfall of 515 mm in the remaining years (Table 2).
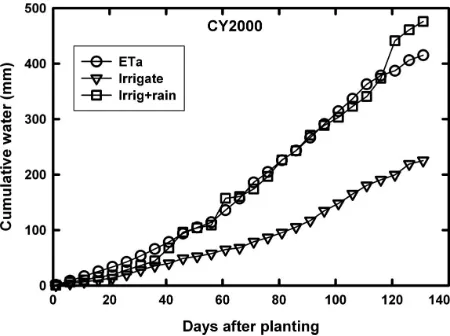
Figure 1 shows the cumulative ETa, irrigation applied and rainfall plus irrigation received during 2000. Cumulative irrigation plus rainfall match estimated ETa quite well until later in the season when rainfall increased. Contrast Figure 1 with Figure 2 where rainfall during the growing season was much higher. Cumulative irrigation was much lower while irrigation plus rainfall was much higher than the estimated ETa. In 2007, rainfall was about midway between that received during 2000 and 2005 (Figure 3). The irrigation plus rainfall curve tracked close to the ETa curve until about 80 DAP when rainfall increased and the curves diverge. These three figures show that each crop year has a unique yet similar rainfall pattern during various parts of the growing season with periods of con-vergence and dicon-vergence to the ETa curve. These yearly rainfall patterns increase the difficulty of irrigation scheduling and may have affected the final cotton yield.
The greatest irrigation depth was applied in 1999 and 2007 (299 and 297 mm, respectively), the least irrigation was applied in 2002 (120 mm). The average irrigation applied was 200 mm over the
table 2. Cotton planting and harvest dates, rainfall, irrigation amount and cultivar selected by year. Rainfall is from day of year 120 to 275 (30 April to 02 October).
Year Plant date
Harvest
date Rainfall
Irrigation
Cultivarz
100% 75% 50%
mm
---1999 12 May 26 Oct 493 299 225 158 DP655RR
2000 11 May 30 Oct 335 208 164 nay DP655RR
2001 11 May 11 Oct 433 249 212 168 DP458RR
2002 08 May 22 Oct 441 120 103 62 DP458RR
2003 28 Apr 21 Oct 682 207 162 117 DP458RR
2004 26 Apr 04 Oct 623 148 111 74 DP458RR
2005 03 May 06 Oct 756 190 133 96 DP458RR
2007 23 Apr 02 Nov 418 297 222 148 DP555RR
z DP = Delta Pineland; RR = Roundup Ready
y Not applicable. Only two irrigation rates were used this year
Figure 1. Cumulative eta, irrigation, and irrigation
plus rainfall depths measured from 0 to 130 days after planting for CY2000, a low rainfall year. Only every 5th
day is shown.
remaining years. Total irrigation amounts fluctuated yearly depending on amount and timing of the rain-fall events. Three cotton cultivars were used during this long-term project. Cultivar selection was made on recommendations provided by local university variety yield trial data and seed availability.
2001, 2002, and 2004). However, the years in which lint yield was different due to irrigation treatment coincided with only two of the years (2000 and 2002) where lint yield was different due to drip tube lateral spacing.
Cotton lint yield for the four years where the irrigation treatment showed significant differences (2000, 2001, 2002, and 2004) is shown in Table 4. Analyzed within each year, lint yields were
great-est when the crop was irrigated at 75% irrigation treatment compared with 50% irrigation level and 3 out of 4 years when compared with 100% irriga-tion treatment. Lint yield at the 75% irrigairriga-tion level averaged 1401 kg ha-1 with a high of 1665 and low of 1259 kg ha-1. Cotton lint yield averaged 1238 kg ha-1 at the 50% irrigation level. Three out of the four years in which lint yield differed due to irrigation treatments coincided with the three lowest years for total cumulative rainfall. Lint yields from this research are similar to other SSDI research yields. Camp et al. (1997) showed lint yields ranging from 706 to 1518 kg ha-1 for two years (1992 and 1994, respectively) averaged across two lateral spacings and three nitrogen rates. Nuti et al. (2006) showed SSDI cotton lint yields ranging from 900 to 1900 kg ha-1 depending on yearly rainfall and irrigation amounts. Yearly yield fluctuation can be attributed to climatic/rainfall differences as well as crop genetics and management. Rainfall patterns and total amount per event may have more of an impact on final yield compared with total rainfall received during the growing season. Camp et al (1993) also showed that less irrigation was needed to obtain the same yield during three growing seasons with different rainfall patterns no matter the irrigation schedule technique employed, i.e., either cotton growth models or with soil based sensors.
Figure 3. Cumulative eta, irrigation, and irrigation
plus rainfall depths measured from 0 to 130 days after planting for CY2007, a medium rainfall year. Only every 5th day is shown.
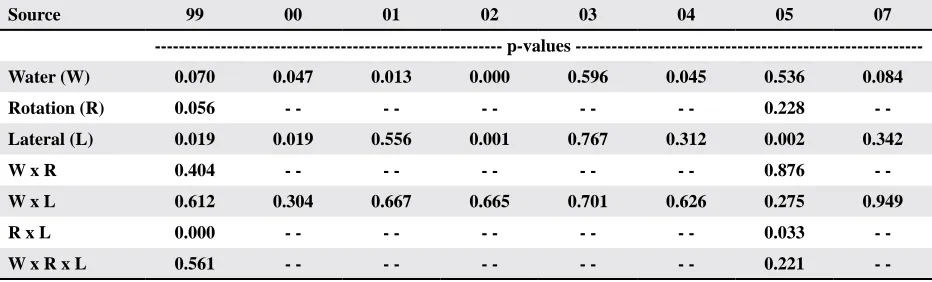
table 3. Analysis of variance table of lint yield probability values for treatment of water applied (W), crop rotation (R), and drip lateral spacing (L) and associated interactions.
Source 99 00 01 02 03 04 05 07
p-values
---Water (W) 0.070 0.047 0.013 0.000 0.596 0.045 0.536 0.084
Rotation (R) 0.056 - - - - - - - - - - 0.228
-Lateral (L) 0.019 0.019 0.556 0.001 0.767 0.312 0.002 0.342
W x R 0.404 - - - - - - - - - - 0.876
-W x L 0.612 0.304 0.667 0.665 0.701 0.626 0.275 0.949
R x L 0.000 - - - - - - - - - - 0.033
-W x R x L 0.561 - - - - - - - - - - 0.221
-Figure 2. Cumulative eta, irrigation, and irrigation
plus rainfall depths measured from 0 to 130 days after planting for CY2005, a high rainfall year. Only every 5th
day is shown.
Overall, these irrigation treatments indicate that irrigating at 75% of existing recommended crop water use values had greater yields 50% of the time. During the remainder of the time, the 75% irriga-tion level had the same yield as the 50% and 100% irrigation levels with somewhat adequate rainfall patterns. This implies a possible 25% water savings for cotton for the same yield during most years and higher during drought or poor rainfall pattern years.
Lateral spacing. Lint yield was significantly
affected by drip tube lateral spacing (Lateral) in 4 out of 8 years (1999, 2000, 2002, and 2005; Table 3).
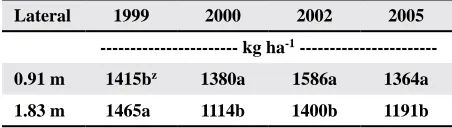
The four years where significant cotton lint yield differences were attributed to drip tube lateral spacing are shown in Table 5. These data show that narrow drip tube spacing (0.91-m) had higher yields in 3 out of 4 years compared with wide drip tube lateral spac-ing (1.83-m). The average yield for the narrow lateral spacing was 1443 kg ha-1 compared with the wide lateral spacing average yield of 1235 kg ha-1. Over the 10-year period, lateral spacing had an effect on cotton yield only 50% of the time. The narrow lateral spacing increased yield slightly more than 200 kg ha-1 of cotton lint representing additional gross revenue of $280 ha-1. The cost of drip tubing is about $0.082 m-1 and would cost about $897 ha-1 just for the tubing at the 0.91-m lateral spacing. It would take almost four “yield-increase events” to equal the cost of the addi -tional tubing for drip tubing installed under every crop row. Even though cotton yields increase 50% of the time with the 0.91-m lateral spacing, the additional revenue generated may not be sufficient to cover the cost of laterals placed in every row compared with laterals spaced in alternate row furrows.
These yield data coincide with Camp et al. (1993, 1997) which evaluated both SSDI and surface drip irrigation with laterals placed in every row or in al-ternate row furrows. They concluded that alal-ternate mid-row placement was as effective as in-row
place-ment when drip laterals are placed on the soil surface. Bucks et al. (1988) and French et al. (1985) reported that wider spacing of drip laterals compared to in-row placement was adequate for cotton production in Arizona. Enciso et al. (2005) showed that later-als spaced 2-m apart (alternate row furrows) were more economical than those spaced at 1-m spacing. This was especially apparent after the 3rd year of the project. They also showed that various treatments of lateral spacing or lateral depth had very little effect on cotton quality.
table 4. Lint yield values for various irrigation levels (Water)
which showed significant yield differences within year.
Water 2000 2001 2002 2003 2004
--- kg ha-1
---50 naz 1205by 1303c 793a 1205b
75 1259a 1376a 1665a 892a 1302a 100 1136b 1332a 1511b 873a 1196b
z Not applicable.
y Means in the same column followed by different lower
case letters are significantly different at the p=0.05 level.
table 5. Cotton lint yield values for drip tube lateral spacing
which showed significant yield differences within year.
Lateral 1999 2000 2002 2005
--- kg ha-1
---0.91 m 1415bz 1380a 1586a 1364a
1.83 m 1465a 1114b 1400b 1191b
z Means in the same column followed by different lower
case letters are significantly different at the p=0.05 level.
Overall, this research showed no clear evidence indicating one specific lateral spacing (narrow or wide) is better than another at increasing yield. However, economically it would be advantageous to select the alternate row furrow lateral spacing to reduce tubing expense by 50%.
Crop rotation. There was no significant yield
difference due to crop rotation (Table 3). In all in-stances, cotton always followed peanut because the rotations were designed for testing disease pressure in peanut, which would have little bearing on cotton response. There was no lint yield increase between alternate year and two year rotations between cotton. Crop rotation sequence would be determined by crop market values for best economic returns.
Table 7 also shows fiber length was different 2 out of 7 years (1999 and 2000) with respect to water treatment. Comparisons of these two years show that 50% irrigation had shorter fiber length (27.7 mm) compared with 75 or 100% irrigation level (28.2 mm). Fiber length for the other 5 years averaged 27.9 mm (Table 8).
Fiber strength and uniformity showed little variation within or across years (Table 7). There was one incidence where fiber strength was different with lateral spacing (2007) and another incidence where fiber uniformity was different with water treatment (1999). With only one incidence in seven years, there is not enough evidence to suggest that fiber strength or uniformity would be influenced by water amount, lateral spacing, or crop rotation when using SSDI. However, irrigation amount, lateral spacing, and crop rotation did influence lint quality, but, these differences did not affect the economic value of the cotton.
CONCLUSIONS
Cotton lint yield data indicate a significant improvement when irrigating at 75% of existing recommended crop water use values in half of the years studied. During the other half of the time, the 75% irrigation level was just as good as the 50% and 100% irrigation levels. This implies a possible 25% water savings in cotton without sacrificing yield potential.
In three out of the four years when lint yield was significant due to irrigation treatment, these higher yields occurred in the years with the lowest total cu-mulative rainfall. This may indicate that rainfall pat-terns and total amount per event may have a greater impact on final yield than total rainfall received.
Lint yield difference attributed to drip tube lateral spacing occurred 50% of the time. However, the years in which lint yield was affected by irriga-tion coincided with only two of the years where lint yield was affected by lateral spacing. There was no apparent strong relationship between lateral spacing and irrigation level on lint yield. These data also show that in years where yields were higher due to drip tube spacing, laterals spaced at 0.91-m had higher lint yields 75% of the time compared with laterals spaced at 1.86-m. The average yield for the 0.91-m lateral spacing was 1443 kg/ha compared with 1235 kg ha-1 for cotton irrigated using 1.86-m lateral spacing.
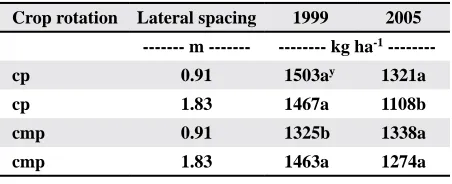
table 6. Cotton lint yield values for two crop rotations by
lateral spacing interaction which showed significant yield
difference within year.
Crop rotation Lateral spacing 1999 2005 --- m --- --- kg ha-1
---cp 0.91 1503ay 1321a
cp 1.83 1467a 1108b
cmp 0.91 1325b 1338a
cmp 1.83 1463a 1274a
z p= peanut, c= cotton, m= maize.
y Means in the same column followed by different lower
case letters are significantly different at p=0.05 level.
A comparison of lint yield across all years (ex-cluding 2003), irrigation levels, and lateral spacings for the three crop rotations of cotton-peanut (CP; n=5), maze-peanut (CMP; n=3), and cotton-maze-maze-peanut (CMMP; n=2) were similar at 1342, 1398, and 1260 kg ha-1 respectively. Using the best recommendation of 75% irrigation level and alternate row lateral spacing, the average cotton lint yield across all years at the various crop rotations had 1349 (CP), 1402 (CMP), and 1286 (CMMP) kg ha-1, respectively. Though not statistically valid to compare across years and treatments in this fashion, these values show little cotton yield difference by rotation when irrigated with SSDI at various irriga-tion levels or lateral spacings.
Lint quality. No lint quality data was recorded for 2002. Table 7 shows the ANOVA probability val-ues for cotton lint quality factors of micronaire, fiber length, strength, and uniformity. Probability values indicate differences in micronaire with water treat-ment in 2000, 2001 and 2004. For these three years, micronaire values ranged from 3.78 to 4.63 (Table 8). There was a trend for the 50% water treatment to have higher micronaire values (4.61) compared with the 100% irrigation (4.1). For the years where micronaire showed no difference to the various wa-ter treatments (1999, 2003, 2005, and 2007), values ranged from 4.22 to 4.76 with an average value of 4.44. Across all years, these irrigation treatments did not result in micronaire values outside the base or premium range.
Table 7. Analysis of variance table of lint quality probability values for treatment of water applied, crop rotation, and drip
lateral spacing and associated interactions.
Source 1999 2000 2001 2003 2004 2005 2007
p-values ---Micronaire
Water (W) 0.106 0.001 0.027 0.739 0.001 0.304 0.902
Rotation(R) 0.169 - - - - - - - - 0.519
-W x R 0.952 - - - - - - - - 0.209
-Lateral (L) 0.863 0.019 0.318 0.579 0.082 0.021 0.660
W x L 0.480 0.748 0.311 0.603 0.175 0.626 0.902
R x L 0.240 - - - - - - - - 0.015
-W x R x L 0.098 - - - - - - - - 0.075
-Length
Water (W) 0.009 0.010 0.077 0.773 0.098 0.532 0.362
Rotation(R) 0.405 - - - - - - - - 0.500
-W x R 0.818 - - - - - - - - 0.752
-Lateral (L) 0.899 0.005 0.153 0.735 0.197 0.108 0.732
W x L 0.984 0.685 0.866 0.501 0.333 0.245 0.812
R x L 0.705 - - - - - - - - 0.012
-W x R x L 0.540 - - - - - - - - 0.565
-Strength
Water (W) 0.062 0.277 0.424 0.693 0.339 0.136 0.177
Rotation(R) 1.000 - - - - - - - - 0.387
-W x R 0.727 - - - - - - - - 0.597
-Lateral (L) 0.499 0.186 0.373 0.947 0.449 0.462 0.043
W x L 0.401 0.436 0.901 0.428 0.496 0.630 0.692
R x L 0.126 - - - - - - - - 0.302
-W x R x L 0.131 - - - - - - - - 0.838
-Uniformity
Water (W) 0.038 0.533 0.452 0.435 0.075 0.443 0.377
Rotation(R) 0.082 - - - - - - - - 0.062
-W x R 0.413 - - - - - - - - 0.518
-Lateral (L) 0.856 0.079 0.712 0.615 0.160 0.349 0.783
W x L 0.420 0.718 0.825 0.393 0.493 0.064 0.771
R x L 0.108 - - - - - - - - 0.105
-W x R x L 0.624 - - - - - - - - 0.575
-Table 8. Irrigation level (Water) and lateral spacing (Lateral) treatment effects on fiber quality of micronaire and length by year.
treatment 1999 2000 2001 2002 2003 2004 2005 2007
Water micronaire
50 4.76az nay 4.6a na 4.34a 4.63a 4.22a 4.33a
75 4.57a 4.13a 4.33ab na 4.46a 4.22b 4.22a 4.33a
100 4.65a 3.78b 4.3b na 4.52a 4.25b 4.37a 4.25a
Lateral
0.91-m 4.66a 4.07a 4.45a na 4.49a 4.43a 4.36a 4.34a
1.83-m 4.66a 3.84b 4.37a na 4.39a 4.31a 4.18b 4.3a
Water length (mm)
50 27.7a na 26.7a na 28.2a 28.4a 28.2a 27.4a
75 28.2a 28.2b 27.2a na 28.2a 28.7a 28.2a 28.2a
100 28.2a 28.7a 27.2a na 28.2a 28.2a 28.2a 28.2a
Lateral
0.91-m 27.9a 28.2b 26.9a na 28.2a 28.2a 28.2a 27.7a
1.83-m 28.2a 28.7a 27.2a na 28.2a 28.4a 28.4a 27.7a
z Means in the same column by treatment, and quality parameter followed by different lower case letters are significantly
different at the p=0.05 level.
Crop rotation had no effect on lint yield. In all instances cotton always followed peanut. There was no lint yield increase due to rotation between alter-nate year or two years between cotton crops.
Based on this research, when SSDI is used to irrigate cotton in the Southeast, drip tube laterals should be installed in alternate row furrows and irrigation scheduled to supply 75% of ETo. Further research may be necessary to identify lint yield re-sponse to mono-cropped cotton, nitrogen rates, and tillage treatments with SSDI.
DISCLAIMeR
Mention of proprietary product or company is included for the reader’s convenience and does not imply any endorsement or preferential treatment by the USDA-ARS.
ReFeReNCeS
Bogle, C.R., T.K. Hartz, and C. Nunez. 1989. Comparison of subsurface trickle and furrow irrigation on plastic-mulched and bare soil for tomato production. J. Am. Soc. Hort. Sci. 114:40-43.
Bosch, D.J., N.L. Powell, and F.S. Wright. 1992. Investment returns from three sub-surface microirrigation tubing spacings. J. Prod. Agric. 11:371-376
Bucks, D.A., S.G. Allen, R.L. Roth, and B.R. Gardner. 1988. Short staple cotton under micro and level-basin irrigation methods. Irrig. Sci. 9:161-176.
Camp, C.R., E.J. Sadler, and W.J. Busscher. 1989. Subsurface and alternate-middle microirrigation for the southeastern coastal plain. Trans. ASAE 31(2):451-456.
Camp, C.R., W.M. Thomas, and C.C. Green. 1993. Microir-rigation scheduling and tube placement for cotton in the southeastern coastal plain. Trans. ASAE 36(4):1073-1078.
Camp, C.R., P.J. Bauer, and P.G. Hunt. 1997. Subsurface drip irrigation lateral spacing and management for cotton in the southeast coastal plain. Trans. ASAE 40(4):993-999. Collins, G., S. Culpepper, L. Day, G. Harris, B. Kemerait, P.
Roberts, D. Shurley, A. Smith, and J. Whitaker. 2010 Georgia Cotton Production Guide. Publication number CSS-10-01 of the University of Georgia College of Agri-cultural and Environmental Sciences, Athens (2010). Dougherty, M., A.H. AbdelGadir, J.P. Fulton, E. van Santen,
L.M. Curtis, C.H. Burmester, H.D. Harkins, and B.E. Norris. 2009. Subsurface drip irrigation and fertiga-tion for north Alabama cotton producfertiga-tion. J. Cotton Sci. 13:227-237.
Enciso, J.M., P.D. Colaizzi, and W.I. Multer. 2005. Economic analysis of subsurface drip irrigation lateral spacing and installation depth for cotton. Trans. ASAE 48(1):197-204. French, O.F., D.A. Bucks, R.L. Roth, and B.R. Gardner. 1985. Micro and level-basin irrigation management for cotton production. p. 555–561. In Anon. (ed.) Drip/trickle irrigation in action. Proc. 3rd Int. Drip/Trickle Irriga-tion Congress, Fresno, CA. 18–21 Nov. 1985. ASAE, St. Joseph, MI.
Georgia Dept. of Agric. 2009. Georgia Agricultural Facts:
2009 Edition. USDA, NASS, Georgia Field Office,
Stephens Federal Building, Suite 320, 355 East Hancock Avenue, Athens, Georgia 30601, www.nass.usda.gov/ Statistics_by_State/Georgia/ Publications/Annual_Statis-tical_Bulletin/index.asp.
Harrison, K.A., and A.W. Tyson. 1993. Irrigation scheduling methods. Coop. Ext. Bull. B-974. pp.12. Cooperative Extension Service, The Univ. of GA College of Agric. and Environ. Sci., Athens, GA.
Henggeler, J.C. 1988. Drip irrigation: Lowering installa-tion costs, increasing yields and improving water-use
efficiency. p. 31-32. In J.M. Brown and D. Richter (ed.) Proc. 1988 Highlights of cotton production Res. Conf., Special Sessions: New Developments from Industry. 3-8 Jan. 1988, New Orleans. Natl. Cotton Council of America., Memphis, TN.
Jensen, M.E., and H.R. Haise, 1963. Estimating evapotrans-piration from solar radiation. J. Irrig Drain. Div. ASCE 889:15-41
Mitchell, W.H. 1981. Subsurface irrigation and fertilization of
field corn. Agron. J. 73(6):913-916.
Mitchell, W.H., and D.L. Sparks. 1982. Influence of subsur -face irrigation and organic additions on top and root
growth of field corn. Agron J. 74(6):1084-1088.
Nuti, R.C., S.N. Casteel, R.P. Viator, J.E. Lanier, K.L. Ed-misten, D.L. Jordan, G.L. Grabow, J. S. Barnes, J.W. Mathews, and R. Wells. 2006. 10:76–88.
O’Brien, D.M., D.H. Rogers, and F.R. Lamm. 1998. An economic comparison of subsurface drip and center pivot sprinkler irrigation systems. Appl. Eng. Agric. 14(4):391-398.
Phene, C.J., K.R. Davis, R.B. Hutmacher, and R.L. Mc-Cormick. 1987. Advantages of subsurface irrigation for processing tomatoes. Acata Hortic 200:101-113. Powell, N.L.,and F.S. Wright. 1993. Grain yield of subsurface
microirrigated corn as affected by irrigation line spacing. Agron. J. 85(6):1164-1170.
Sorensen, R.B., F.S. Wright, and C.L. Butts. 2001. Subsurface drip irrigation system design for research in row crop rotations. Appl. Eng. In Agric. 17(2):171-176.
Sorensen, R.B., and M.C. Lamb. 2008. Corn and cotton yield with two surface drip lateral spacings. Online. Crop Management DOI:10.1094/CM-2008-0118-01-RS. Statistix9. 2008. Statistix9: User’s Manual. Analytical
Soft-ware, Tallahassee, FL 32317 (www.stastitix.com). Tollefson, S. 1985. The Arizona System: Drip irrigation