0 INTRODUCTION
Robot laser hardening [RLH] [1] is a heat treatment similar to inductive or conventional flame hardening. We can analyze the microstructures of RLH specimens using 3D visibility networks (graphs). A visibility network [2] is a graph of visible areas, which presents a set of nodes and obstacles in the Euclidean plane or space. Fractal geometry [3] was developed by Mandelbrot, who built the Mandelbrot set y = z2 + c with the help of a computer. He provided a new approach in the scientific discipline as he set out and designed a new way of thinking about structures and shapes. The Hurst parameter H [4] is the correlation between random steps X1 and X2, which is followed by the time-to-time difference ∆t. Hurst parameter occurs in many areas of applied mathematics, including fractals and chaos theory, and is used in many fields ranging from biophysics to network computers. The parameter was originally developed in hydrology. However, modern techniques to estimate the Hurst parameter H come from fractal mathematics. The fractal dimension has been used to measure the roughness of sea coasts. The relationship between the fractal dimension D and the Hurst parameter H is given by the equation D = 2 – H for 2D
objects and D = 3 – H for 3D objects. We developed a new method to estimate the Hurst parameter H of a 3D object. In this paper, we introduce a new hybrid intelligent system to predict the carbide content of RLH specimens from the topological property of the density of the visibility network and fractal dimension.
1 PREPARATION OF MATERIAL SPECIMENS
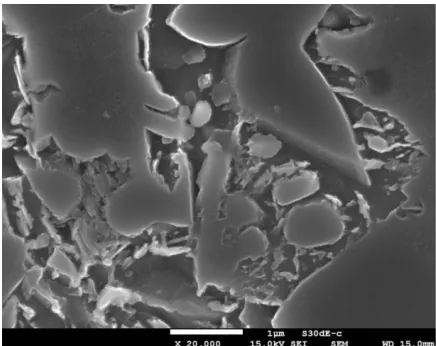
The study was done on the standard tool steel labeled as DIN 1.7225 [5]. The tool steel was surface hardened by laser at different speeds and different powers. We use a robot laser cell RV60-40 (Reis Robotics Company). The maximum power of the robot-laser cell is 3000 W. We hardened specimens with an output power of 1500 W. Therefore, we modified the speed parameter v ∈ [2, 5] mm/s and the temperature parameter T ∈ [800, 2000] °C. Each sample was prepared by etching and polishing (IMT, Institute of Metals and Technology Ljubljana, Slovenia) for a microscope evaluation (IJS, Jozef Stefan Institute). Fig. 1 was made by field emission scanning electron microscopy, JMS-7600F, JEOL. We wanted to know whether the microstructure of the RLH fractal patterns found a structure from which the Hurst parameter H could be estimated. Fig. 2 presents a 3D graph of the
New Hybrid System of Machine Learning and Statistical Pattern
Recognition for a 3D Visibility Network
Babič, M. – Skala, K. – Kumar, D. – Šturm, R.
Matej Babič1,* – Karolj Skala2 – Dookhitram Kumar3 – Roman Šturm4 1 Jožef Stefan Institute, Ljubljana, Slovenia
2 Ruđer Bošković Institute, Croatia 3 University of Technology, Mauritius
4 University of Ljubljana, Faculty of Mechanical Engineering, Slovenia
Intelligent systems are an excellent tool to use for solving complex problems in the field of industrial applications. We use the mathematical method of fractal geometry and network theory when laser-hardening techniques are applied. The microstructure of the robot-laser-hardened specimens is very complex; however, we can present it by using a 3D visibility network. We convert the scanning electron microscope (SEM) images of the microstructure to a 3D graph and calculate the density of the visibility network of these 3D networks. We have analyzed the topographical properties of the hardened specimens by using the algorithm for the construction of a visibility network in a 3D space. We develop a new hybrid system of machine learning for predicting carbide content of the hardened specimens by using multiple regression, neural networks, and a genetic algorithm. We find the statistical significance of the relationship between attributes of the hardened specimens, the topological properties of visibility graphs, and carbide content of the hardened specimens.
Keywords: fractal geometry, hybrid system, laser hardened specimens, visibility network, statistical pattern recognition
Highlights
• We have calculated the statistical properties of the data of the parameters of the hardened specimens. • We have described the carbide content of the hardened specimens using the topological properties.
microstructure of the RLH specimen. It is converted from Fig. 1 by using Fig. 1 color depth.
Fig. 1. SEM picture of microstructure of the RLH specimen
Fig. 2. 3D graph of microstructure of the RLH specimen
2 DESCRIPTION OF METHOD
We used fractal geometry and a visibility network to determine the complex microstructure of the RLH specimens.
Fig. 3 presents the random vertices of the 3D graph. For better visual presentation, we use 5×5 vertices of the 3D graph. 3D graph presents microstructure of the RLH specimens.
Babič et al. [6] present a solution for constructing a visibility network in a 3D space. Fig. 4 presents the results of the problem of constructing a visibility network in a 3D space. We use the statistical topological property of the density of the visibility
Fig. 3. Vertices in a 3D graph
Fig. 4. Visibility network of vertices in a 3D graph
network for pattern recognition from SEM images of the RLH specimens. The density q was calculated for each visibility network by Eq. (1):
q m
n n =
× −
(
)
2
1 , (1)
where m is the number of edges, n is the number of vertices in the visibility network.
(xi, y0, zi) present a space component on a 2D graph for
all points (xi, zi). All points (xi, y1, zi) present a second
space component on a 2D graph for all points (xi, zi).
We made a space component for all yi, ∀i. Then we
combined all these space components into one space component. For this long space component, we can estimate the Hurst exponent H. We use the fractal dimension for pattern recognition from SEM images.
Fig. 5. Long continuous graph
We use the method of a visibility network and fractal geometry for statistical pattern recognition. To model the results, we use intelligent system methods, that is, multiple regression, neural network (NN), and genetic programming (GP).
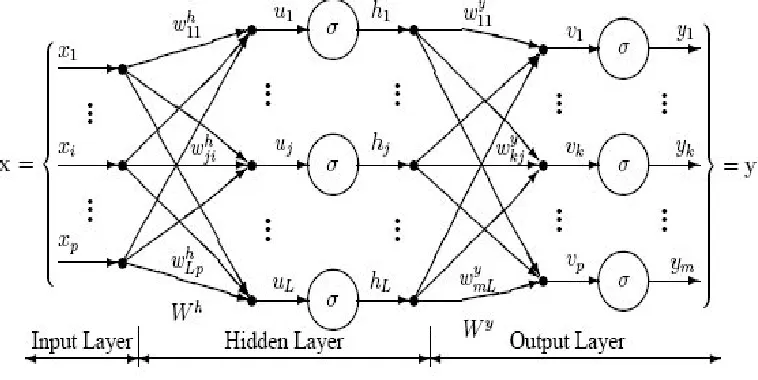
NNs [8] have the ability to solve a variety of problems. The sophistication of NNs is primarily due to their ability to imitate the principle of the functioning of the biological brain, which means that they solve problems similarly to humans. We used the Neuralyst program to create a model with NNs. Neuralyst is a software tool used within Excel. It has the ability to model NNs. We used a multi-tasking neural system with backpropagation and no back
links. We had the option of setting different attributes. Table 1 presents the attributes of the NNS.
Table 1. Attributes of the NN
Learning speed [-] 0.6
Inertial coefficient [-] 0.5
Test mass tolerance [-] 0.02
Tolerance of the learning set [-] 0.03
Number of layers [-] 4
Fig. 6 presents a general multi-layer NN system.
Table 2. Attributes of the GP
Size of the population of organisms 500
Maximum number of generations 100
Reproduction probability 0.4
Crossover probability 0.6
Maximum permissible depth in the creation of the
population 6
Maximum permissible depth after the operation of
crossover of two organisms 10
Smallest permissible depth of organisms in generating
new organisms 2
Tournament size used for selection of organisms 7
Genetic programming [9] is similar to
genetic algorithms and differs only in terms of the presentation method. Individual component in genetic algorithms is presented by a sequence of numbers, and the individual component in genetic programming is presented by a computer program. GP automatic writing of programs according to the nature of natural selection (evolution). At the beginning, we have some randomly written programs, which represent the initial
population. Then by crossing and selection, we get the next generation. Table 2 presents the attributes of the genetic programming.
We used the genetic operations of reproduction and crossover. Fig. 7 presents an example of an organism in genetic programming.
Fig. 7. Organism in GP
Multiple regression (MR) [10] is designed to investigate linear causes the relationship between a single dependent variable and one or more independent variables. With it, we determine the statistical feature in the power of connection and we predict the values of the dependent variable. The impact of each of the independent variables is estimated to be independent of the interactions between independent variables.
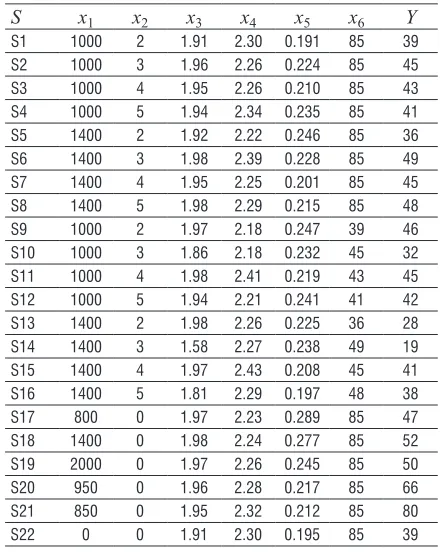
Hybrid evolutionary computation [11] is a generic, flexible, robust, and versatile method for solving complex global optimization problems and could be used in practical applications. We present a new intelligent hybrid systems model in Fig. 8. Data information is presented in Table 3.
Table. 3. Attributes of the hardened specimens
S x1 x2 x3 x4 x5 x6 Y
S1 1000 2 1.91 2.30 0.191 85 39
S2 1000 3 1.96 2.26 0.224 85 45
S3 1000 4 1.95 2.26 0.210 85 43
S4 1000 5 1.94 2.34 0.235 85 41
S5 1400 2 1.92 2.22 0.246 85 36
S6 1400 3 1.98 2.39 0.228 85 49
S7 1400 4 1.95 2.25 0.201 85 45
S8 1400 5 1.98 2.29 0.215 85 48
S9 1000 2 1.97 2.18 0.247 39 46
S10 1000 3 1.86 2.18 0.232 45 32
S11 1000 4 1.98 2.41 0.219 43 45
S12 1000 5 1.94 2.21 0.241 41 42
S13 1400 2 1.98 2.26 0.225 36 28
S14 1400 3 1.58 2.27 0.238 49 19
S15 1400 4 1.97 2.43 0.208 45 41
S16 1400 5 1.81 2.29 0.197 48 38
S17 800 0 1.97 2.23 0.289 85 47
S18 1400 0 1.98 2.24 0.277 85 52
S19 2000 0 1.97 2.26 0.245 85 50
S20 950 0 1.96 2.28 0.217 85 66
S21 850 0 1.95 2.32 0.212 85 80
S22 0 0 1.91 2.30 0.195 85 39
3 RESULTS AND DISCUSSION
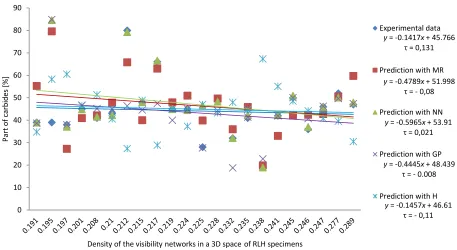
The attributes of the hardened specimens influence on the carbide content (Table 3). The specimens are labeled as S1 to S22. Attribute x1 represents the temperature [°C] and x2 represents the speed of RLH [mm/s]. Attributes x3, x4, and x5 represent the keys for pattern recognition. Parameter x3 represents the complexity in 2D, x4 represents the complexity in 3D, x5 represents the density of the visibility networks in a 3D space, and x6 represents the carbides in specimens. The last attribute Y is the measured surface carbide
content of the RLH specimens. Specimen S22 presents the material before the RLH process. In Table 4, we denote measurement (M) data (D) by MD, prediction data obtained by MR, prediction data obtained by neural network (NN), prediction data obtained by GP, and prediction data obtained by the hybrid system by H. Specimen S14 has a minimal carbide content after hardening, that is, 19 %. Table 4 present the statistical properties of the experimental and predicted patterns. Table 5 present topological properties of 3D visibility network. The measured and predicted carbide content of the RLH specimens is presented in the Fig. 9. The MR model is presented by Eq. (1), GP model is presented by Eq. (2), and hybrid model is presented by Eq. (3). We calculated precision of the GP model, NN and of the MR model by calculating average of absolute difference between measured and predicted data divided by measured data. The GP model has 85.57 % precision, the NN has 90.57 % precision, MR has 80.87 % precision and hybrid system has 62.98 % precision.
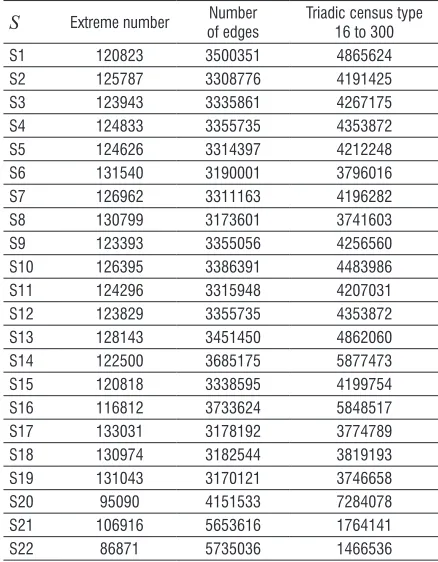
Table 5 presents the topological properties of the 3D visibility network. Measured and predicted parts of carbides of the LHR specimens depend on attributes x1, x2, x3, x4, x5 and x6 are presented in Fig. 9. We use the statistical topological property of the visibility networks to describe the carbide content in the microstructures. Image analysis of the SEM images of the RLH specimens is an interesting approach. With MR, GP and NN, we predict the carbide content in the microstructures. Finally, we present a new hybrid system of intelligent systems. For measured and predicted parts of carbides of the LHR specimens data, we calculated Kendall correlation coefficient. The best results for prediction give us NN, because the Kendall correlation coefficient (0.021) is most close to experimental data (0.131). Table 3 presents the topological properties of the 3D visibility network and attributes of RLH specimens. In this way, we can see how the attributes of speed and temperature influence the topological structures of visibility graphs in 3D space. Table 6 presents the statistical properties of the topological properties of the extreme number, number of edges, and triadic census type 16 to 300 of the 3D visibility network for RLH specimens. Firstly, we calculated the basic statistical properties of the mean, standard deviation, standard error, median, geometric mean, and harmonic mean of the topological properties of visibility graphs in 3D space of RLH specimens. We found significant positive relationships between the kurtosis, Fisher’s G2, the coefficient of variation, the coefficient of dispersion,
Table. 4. Measured and predicted data
S MD MR NN GP H
S1 39 55.28 38.98 38.7 34.77
S2 45 50.93 44.53 45.0 37.32
S3 43 47.84 42.25 45.0 40.61
S4 41 45.89 42.27 41.4 44.78
S5 36 42.41 36.98 40.8 44.18
S6 49 49.69 48.32 44.3 43.32
S7 45 40.97 44.86 46.7 46.45
S8 48 40.00 48.06 44.6 48.86
S9 46 42.74 45.97 46.2 40.85
S10 32 35.98 32.08 18.8 47.98
S11 45 48.01 44.98 40.0 44.99
S12 42 33.04 42.26 42.0 55.08
S13 28 39.91 46.48 27.7 47.05
S14 19 19.88 18.99 22.8 67.35
S15 41 42.15 41.54 45.2 51.32
S16 38 27.23 37.08 38.0 60.50
S17 47 59.78 47.86 47.4 30.50
S18 52 50.58 50.11 49.7 39.58
S19 50 42.10 51.01 50.1 48.54
S20 66 62.98 66.65 47.5 28.93
S21 80 65.82 79.25 46.4 27.35
S22 39 79.59 84.60 84.9 58.25
Table. 5. Topological properties of 3D visibility network
S Extreme number of edgesNumber Triadic census type 16 to 300
S1 120823 3500351 4865624
S2 125787 3308776 4191425
S3 123943 3335861 4267175
S4 124833 3355735 4353872
S5 124626 3314397 4212248
S6 131540 3190001 3796016
S7 126962 3311163 4196282
S8 130799 3173601 3741603
S9 123393 3355056 4256560
S10 126395 3386391 4483986
S11 124296 3315948 4207031
S12 123829 3355735 4353872
S13 128143 3451450 4862060
S14 122500 3685175 5877473
S15 120818 3338595 4199754
S16 116812 3733624 5848517
S17 133031 3178192 3774789
S18 130974 3182544 3819193
S19 131043 3170121 3746658
S20 95090 4151533 7284078
S21 106916 5653616 1764141
Model of multiple regression:
Y = –99.0509 – 0.0178 × x1 – 3.25717 × x2 + 46.65489 × x3 + 38.06208 × x4 – 63.3748 × x5 + 0.165097 × x6. (2)
Model of genetic programming
Y x x x x x
x x x x
x
x x x
= × − − − + +
− + × − +
(
)
+× − + −
0 129654 6 22
2 2 2
6
2 2 2 2
2 6 2 3 6 . ( xx x x x
x x x x x x x
x x x x
x 3 2 2 4 6 2
2 1 2
2
2 2 3 6
2 6 6
6 3 1 + + × − + ×
(
+ ×)
+ − × × + − − ×(
+)
+(
)
×(
+ × ×(
+)
+)
+ − x xx x x x x x x x x
x x x
2 1
3 2 3 5 3 3 2 3 6
2 1 2
2 )
22
4
6
2 6 6
2 2
3 2
1
7 71283 2 + × + × − + − + + x x
x x x
x x
x .
( xx x x x
x x x
x x x x
3 6 6
6
3
2 1
2 3 6
4 + × + − + × + ) . (3) Hybrid model
Y Y A B AB C
A x x x x x
x x x x
2
6 2
2 2 2
2 6
2 2 2 2
2 0 0 129654 +
(
+)
+ − = = − − + + + − + × − + , .((
)
+ − + − + = + xx x x
x x B 6 2 3 6 3 2 2
99 0509 0 0178
,
. . xx x x x x
C x x x
x
1 2 3 5 6
2 3 6
3 25717 46 65489 63 3748 0 165097
+ − + −
= + +
. . . . ,
66 2
2 1 2
2
2 2 3 6 6
2 2
3
3 2 3 6 3 2 3 2
x x x x x x x x
x x
x x x x x x x
− +
(
+)
+ −− +
+
(
)
+(
)
+ × +xx xx x x
x x x x
x x x x
x
3 6
2 1 2
2
2 6 6 6
3
2 1
6
2
7 71283 2
(
)
+(
)
+ − − + − + + − ). xx x
x x
x x x x x
x x x 6 6 2 2 3
3 2 6 6
and the topological properties of visibility graphs in 3D space of RLH specimens.
Table. 6. Statistical properties of topological properties of 3D visibility network
SP Extreme number Number of edges Triadic census type 16 to 300
Mean 121792 3599223 4253132
Standard deviation 11531.35 714391.3 1201353
Standard error 2458.49 152308.8 256129.4
Median 124461 3346826 4209640
Geometric mean 121194 3546497 4055020
Harmonic mean 120509 3505535 3790200
Kurtosis 5.90 7.454659 4.719475
Fisher‘s G2 4.03 5.993685 2.517122
Coefficient of variation 0.094 0.1984849 0.2824632
Coefficient of dispersion 0.05 0.1024648 0.1701942
4 CONCLUSIONS
The paper presents a new method of constructing visibility networks in a 3D space, a new method of describing the complexity of 3D space, and a new hyper-hybrid system of machine learning for the use in mechanical engineering to predict the topographical properties of materials. The paper presents a method of using visibility graphs in 3D
space and fractal geometry to analyze the complexity of RLH specimens. Analyzing the complexity of RLH surfaces is a very hard problem. This new method has many applications in pattern recognition, computer graphics, computational geometry, and so on. The main findings are:
1. We use the method of network theory and fractal geometry to analyse the microstructure.
2. For prediction of the carbide content of hardened specimens, we use intelligent system methods, namely a neural network, multiple regression, and a genetic algorithm. The best results for prediction give us neural network.
3. We present the new hybrid spiral sequences. 4. The paper introduces a new method of machine
learning in metallurgy.
5. We find the statistical significance of the relationship between attributes of the hardened specimens and the experimental and predicted pattern data.
6. The paper compares three methods, namely multiple regression, neural network and genetic programming, with a hybrid system of intelligent systems.
y= -0.1417x+ 45.766
τ= 0,131
y= -0.4789x+ 51.998
τ= - 0,08
y = -0.5965x+ 53.91
τ= 0,021
y= -0.4445x+ 48.439
τ= - 0.008
y= -0.1457x+ 46.61
τ= - 0,11 0
10 20 30 40 50 60 70 80 90
Pa
rt
of
ca
rb
id
es
[%
]
Density of the visibility networks in a 3D space of RLH specimens
Experimental data
Prediction with MR
Prediction with NN
Prediction with GP
Prediction with H
5 REFERENCES
[1] Petrovič, S., D., Šturm, R. (2014). Fine-structured morphology of a silicon steel sheet after laser surface alloying of Sb powder. Strojniški vestnik – Journal of Mechanical Engineering, vol. 60, no. 1, p. 5-11, DOI:10.5545/sv-jme.2013.1347.
[2] Ghosh, S.K. (1997). On recognizing and characterizing visibility graphs of simple polygons. Discrete & Computational Geometry, vol. 17, no. 2, p. 143-162, DOI:10.1007/
BF02770871. ISSN 0179-5376.
[3] Mandelbrot, B.B. (1983). The Fractal Geometry of Nature. W.H. Freeman & Co., San Francisco, DOI:10.1119/1.13295.
[4] Stoev, S., Pipiras, V., Taqqu, M.S. (2002). Estimation of the self-similarity parameter in linear fractional stable motion. Signal Processing, vol. 82, no. 12, p. 1873-1901, DOI:10.1016/
S0165-1684(02)00317-1.
[5] Alta steel (2017). from http://www.altaspecialsteel.com/DIN-1-7225-AISI-4140-38.html, accessed on 2017-12-30.
[6] Babič, M., Hluchy, L., Krammer, P., Matovič, B., Kumar, R., Kovač, P. (2017). New method for constructing a visibility graph-network in 3D space and new hybrid system of
modeling. Journal of Computing and Informatics, vol. 36, no. 5, p. 1107-1126, DOI:10.4149/cai.2017.5.1107.
[7] Babič, M., Kokol, P., Guid, N., Panjan, P. (2014). A new method for estimating the Hurst exponent H for 3D objects. Materials and Technology, vol. 48, no. 2, p. 203-208.
[8] Graves, A., Schmidhuber, J. (2009). Offline Handwriting Recognition with Multidimensional Recurrent Neural Networks, in Bengio, Y., Schuurmans, D.,; Lafferty, J., Williams, C.K.I., Culotta, A. (eds.). Advances in Neural Information Processing Systems, vol. 22, p. 545-552.
[9] Koza, J.R. (1992). Genetic Programming: On the Programming of Computers by Means of Natural Selection, MIT Press.
[10] Armstrong, J.S. (2012). Illusions in regression analysis.
International Journal of Forecasting, vol. 28, no. 3, p. 689-694, DOI:10.1016/j.ijforecast.2012.02.001.
[11] Ravi, V., Naveen, N., Pandey, M. (2013). Hybrid classification
and regression models via particle swarm optimization auto associative neural network based nonlinear PCA. International
Journal of Hybrid Intelligent Systems, vol. 10, p. 137-149,