DEMOGRAPHIC RESEARCH
VOLUME 32, ARTICLE 39, PAGES 1081
−
1098
PUBLISHED 27 MAY 2015
http://www.demographic-research.org/Volumes/Vol32/39/ DOI: 10.4054/DemRes.2015.32.39
Descriptive Finding
The reliability of in-home measures of height
and weight in large cohort studies: Evidence
from Add Health
Jon M. Hussey
Eric A. Whitsel
Carolyn Tucker Halpern
Joyce W. Tabor
Quynh C. Nguyen
Liana J. Richardson
Penny Gordon-Larsen
Pamela P. Entzel
Kathleen Mullan Harris
©2015 Jon M. Hussey et al.
This open-access work is published under the terms of the Creative Commons Attribution NonCommercial License 2.0 Germany, which permits use, reproduction & distribution in any medium for non-commercial purposes, provided the original author(s) and source are given credit.
1 Introduction 1082
2 Methods 1083
2.1 Add Health sample 1083
2.2 Add Health in-home anthropometric measures 1083
2.3 NHANES external comparison sample 1083
2.4 Analysis 1084
2.4.1 Reliability analysis 1084
2.4.2 Digit preference analysis 1085
2.4.3 Add Health [home]-NHANES [clinic] comparisons 1085
3 Results 1086
3.1 Participant characteristics 1086
3.2 Reliability 1087
3.3 Digit preference 1087
3.4 Add Health [home] and NHANES [clinic] BMI/obesity 1087
3.5 Add Health [home] and NHANES [clinic] waist
circumference/central obesity
1089
4 Discussion 1091
Study strengths and limitations 1091
Conclusions 1092
5 Acknowledgments 1092
References 1094
The reliability of in-home measures of height and weight in large
cohort studies: Evidence from Add Health
Jon M. Hussey1,2 Quynh C. Nguyen3
Eric A. Whitsel3,4 Liana J. Richardson2, 5
Carolyn Tucker Halpern1,2 Penny Gordon-Larsen2, 6
Joyce W. Tabor2 Pamela P. Entzel7
Kathleen Mullan Harris2,5
Abstract
BACKGROUND
With the emergence of obesity as a global health issue, an increasing number of major demographic surveys are collecting measured anthropometric data. Yet little is known about the characteristics and reliability of these data.
OBJECTIVES
We evaluate the accuracy and reliability of anthropometric data collected in the home during Wave IV of the National Longitudinal Study of Adolescent to Adult Health (Add Health), compare our estimates to national standard, clinic-based estimates from the National Health and Nutrition Examination Survey (NHANES) and, using both sources, provide a detailed anthropometric description of young adults in the United States.
METHODS
The reliability of Add Health in-home anthropometric measures was estimated from repeat examinations of a random subsample of study participants. A digit preference
1 Department of Maternal and Child Health, Gillings School of Global Public Health, University of North
Carolina at Chapel Hill, U.S.A.
2 Carolina Population Center, University of North Carolina at Chapel Hill, U.S.A.
3
Department of Epidemiology, Gillings School of Global Public Health, University of North Carolina at Chapel Hill, U.S.A.
4 Department of Medicine, University of North Carolina at Chapel Hill, U.S.A.
5 Department of Sociology, University of North Carolina at Chapel Hill, U.S.A.
6 Department of Nutrition, Gillings School of Global Public Health, University of North Carolina at Chapel
Hill, U.S.A.
analysis evaluated the quality of anthropometric data recorded by field interviewers. The adjusted odds of obesity and central obesity in Add Health vs. NHANES were estimated with logistic regression.
RESULTS
Short-term reliabilities of in-home measures of height, weight, waist and arm circumference − as well as derived body mass index (BMI, kg/m2) − were excellent. Prevalence of obesity (37% vs. 29%) and central obesity (47% vs. 38%) was higher in Add Health than in NHANES, while socio-demographic patterns of obesity and central obesity were comparable in the two studies.
CONCLUSIONS
Properly trained non-medical field interviewers can collect reliable anthropometric data in a nationwide, home visit study. This national cohort of young adults in the United States faces a high risk of early-onset chronic disease and premature mortality.
1. Introduction
With the emergence of obesity as a global health threat (Caballero 2007), the value of accurate and reliable anthropometric data has never been greater. This is particularly true for panel studies, which are invaluable for studying the predictors, trajectories, and consequences of overweight and obesity. However, national panel studies in the United States have traditionally relied on potentially biased self-reported anthropometrics (Lee et al. 2011). Only recently have a number of major longitudinal social surveys initiated the collection of measured anthropometric data (Vaupel, Wachter, and Weinstein 2007). Yet little is known about the characteristics and reliability of these data, particularly when collected in the home and by trained non-medical staff. As the first major social survey in the United States to collect reliability data on measured anthropometrics, the National Longitudinal Study of Adolescent to Adult Health (Add Health) is uniquely positioned to address this gap.
2. Methods
2.1 Add Health sample
Add Health is a nationally representative probability sample of U.S. adolescents in grades 7 through 12 in the 1994−95 school year (Harris 2009). At Wave IV (2008), 15,701 original participants, ranging in age from 24−32 years, were re-interviewed (80% response rate). Further study details (Harris et al. 2009) and user guides are available at the project website: http://www.cpc.unc.edu/projects/addhealth. Add Health procedures and the present study were approved by the Public Health-Nursing Institutional Review Board (IRB) at the University of North Carolina.
2.2 Add Health in-home anthropometric measures
After each participant completed the Wave IV interview, typically in their home, one of 323 trained and certified field interviewers (FIs) collected standing height, weight, waist circumference, and (upper) arm circumference. Height was measured in the Frankfort horizontal plane to the nearest 0.5 cm; weight to the nearest 0.1 kg using a high capacity (200 kg), digital bathroom scale; and waist circumference to the nearest 0.5 cm at the superior border of the iliac crest. Measured height, weight, and waist circumference were further classified according to National Institutes of Health Clinical Guidelines. Specifically, BMI was calculated as weight in kilograms divided by height in meters squared. Overweight was defined as a BMI of 25 to 29.9 kg/m2, obesity as a BMI ≥30.0 kg/m2; and central obesity as a waist circumference >88 cm in women and >102 cm in men (NHLBI Obesity Education Initiative Expert Panel on the Identification, Evaluation, and Treatment of Obesity in Adults 1998). To determine the correct blood pressure cuff size, upper arm circumference was measured and categorized as <13 inches, 13−16 inches, or >16 inches. Cooperation rates for the measurement of height, weight, and waist circumference exceeded 99%. Following 11% of interviews, post-encounter telephone calls were made to participants to verify FI adherence to the anthropometric protocol (RTI International 2010). Further details on the study’s anthropometric protocols are published elsewhere (Entzel et al. 2009).
2.3 NHANES external comparison sample
measures. NHANES 2007−2008 was a population-based, cross-sectional survey of the civilian, non-institutionalized U.S. population (CDC 2010). The survey included in-home interviews (78% response rate) and health measurements made in mobile examination centers (75% response rate).
NHANES anthropometric data were collected under uniform conditions in the mobile examination clinics by two staff working together. Standing height was measured to the nearest 0.1 cm using a fixed stadiometer and with the head aligned in the Frankfort horizontal plane, weight to the nearest 0.1 kg using a digital scale, and waist circumference to the nearest 0.1 cm (CDC 2007).
2.4 Analysis
2.4.1 Reliability analysis
In a separate quality control study, the short-term test-retest reliability of anthropometric measures was assessed among a race/ethnicity and sex-stratified random sample of 100 Add Health Wave IV participants (mean age 29 years; 50% female; 64% non-Hispanic White; 16% non-Hispanic Black; 12% Hispanic/Latino; 8% other). The participants were examined twice, one to two weeks (mean: 8.6 days) apart. At both examinations, height, weight, and arm circumference were measured following the protocol described above, typically by the same FI (84% of participants) and at approximately the same time of day (mean absolute difference: 52 minutes; range 0−302 minutes).
A nested, random-effects model was first used to partition the variance of the height, weight, waist and arm circumference measures into their between-participant, between-visit, and within-visit components. To facilitate comparison with other studies, reliability was then computed as the ratio of the between-participant to total variance (
σ
σ
2 2/
TBP ), i.e., an intra-class correlation coefficient (ICC) with 95% confidence
2.4.2 Digit preference analysis
FI-specific digit preference was monitored using a Pearson χ2 test of the null hypothesis that all possible digits (0, 1, 2, …, 9) were observed with equal frequency. Exact tests were implemented when the number of FI-specific participant observations was less than fifty. Adjustments for multiple comparisons were made using the Bonferroni method. Calculation of a digit preference score (DPS) was also used to reduce Type I error, otherwise inherent in identification of divergence from a uniform distribution of digits at even modest sample sizes. The DPS can range from 0 to 100, with scores of 20 or higher considered problematic (National Heart, Lung, and Blood Institute 1989).
2.4.3 Add Health [home]-NHANES [clinic] comparisons
Cross-survey comparisons were made between adults aged 24−32 years in Add Health and NHANES. BMI analyses used data from 14,026 Add Health and 743 NHANES non-pregnant participants aged 24−32 with non-missing survey weights and measured height and weight. Waist circumference analyses used data from 14,119 Add Health and 716 NHANES non-pregnant participants with non-missing survey weights and measured waist circumference.
Mean BMI and waist circumference for Add Health participants were referenced against NHANES participants before and after weighting for unequal sampling probabilities, clustering, and predicted probabilities of participant selection (i.e., propensities). Propensities were conditional on age, sex, race/ethnicity, nativity, education, and income.
3. Results
3.1 Participant characteristics
The socio-demographic characteristics of Add Health and NHANES participants are summarized in Table 1. On average, stratum-specific sample sizes were 17 (range: 5−28 times) times higher and the precision of corresponding estimates much greater in Add Health than in NHANES. In both samples the mean age was 28 and there was an equal representation of females and males. Participants in Add Health were less likely than those in NHANES to be of Mexican origin (6% vs. 13%) and to be foreign-born (5% vs. 19%). Conversely, educational attainment was greater among Add Health participants.
Table 1: Participant characteristics of the Add Health Wave IV (2008) and
NHANES 2007-2008 population, ages 24−32 years
Add Health, Wave IV (Home) NHANES 2007-2008 (Clinic)
n % (95% CI)
a
n % (95% CI)b
Age, Mean (SD) 14751 28 (2) 805 28 (2)
Sex
Males 6899 51 (49, 52) 399 51 (47, 55) Females 7852 49 (48, 51) 406 49 (45, 53)
Race/Ethnicity
White, Non-Hispanic 7833 66 (60, 71) 310 62 (50, 72) Black, Non-Hispanic 2958 15 (11, 19) 175 13 (9, 18) Asian/Pacific Islander, non-Hispanic 834 3 (2, 5) __ __ Other Race/Multiracial 908 5 (4, 6) 32 6 (3, 11) Mexican 981 6 (4, 9) 196 13 (9, 20) Other Hispanic 1177 5 (3, 8) 92 6 (4, 10)
Nativity
U.S. Born 13625 95 (93, 96) 595 81 (73, 87) Foreign-Born 1119 5 (4, 7) 210 19 (13, 27)
Education
0-11 years 1134 9 (8, 11) 217 19 (15, 24) H.S. graduate/GED 2377 18 (16, 20) 192 23 (19, 27) Some college/AA degree 6504 43 (41, 45) 232 31 (25, 37) 4-yr college or greater 4733 30 (27, 33) 164 27 (21, 35) Household income ≤ $20,000c
1590 13 (11, 14) 162 16 (12, 21)
a
Percent (95% confidence interval) weighted to be representative of U.S. adolescents in grades 7-12 in the 1994-1995 school year.
b
Weighted percent (95% confidence interval)
c
3.2 Reliability
The short-term test-retest reliabilities of Add Health Wave IV measured height, weight, waist circumference, and arm circumference − as well as derived BMI − were uniformly excellent. Consistent with other studies (Crespi et al. 2012; El-Moalem et al. 1997; Mueller et al. 1996), ICCs for these measures ranged from 0.92 to 1.00 (Table 2).
Table 2: Variance and reliability of anthropometric measures: Add Health,
Wave IV (2008)
Variance Measurea
Between- Participant
Between- Visit
Within-
Visit Total ICC (95% CI) N
Weight (kg) 588.816 0.0263 0.9948 589.8372 1.00 (1.00-1.00) 100 Height (cm) 103.515 0.8524 1.0017 105.3691 0.98 (0.98-0.99) 100 BMI (kg/m2
) 65.1638 0.0000 0.3248 65.4886 0.99 (0.99-1.00) 100 Waist (cm) 311.944 6.7752 1.0002 319.7194 0.98 (0.97-0.99) 100 Arm Circumference (cm) 3.664 0.0000 0.3356 3.9994 0.92 (0.87-0.97) 42b
a
ICCs were insensitive to log-transformation and did not differ significantly when both observations were recorded by the same vs. different field interviewers.
b
Upper arm circumference was measured to the nearest quarter inch only among pretest participants in the embedded reliability study.
ICC (95% CI) = intra-class correlation coefficient, 95% confidence interval. BMI = body mass index.
3.3 Digit preference
There was little evidence of substantial digit preference in FI recording of measured weight, height, and waist circumference. There was, however, some evidence of whole- and half-unit rounding by FIs, despite training aimed at eliminating it. Although each measure was associated with a significant overall chi-square test statistic, corresponding digit preference scores (DPS) ranged from 1.4 to 6.7 − well below the threshold of concern (i.e., DPS ≥20) applied in prior studies (National Heart, Lung, and Blood Institute 1989).
3.4 Add Health [home] and NHANES [clinic] BMI/obesity
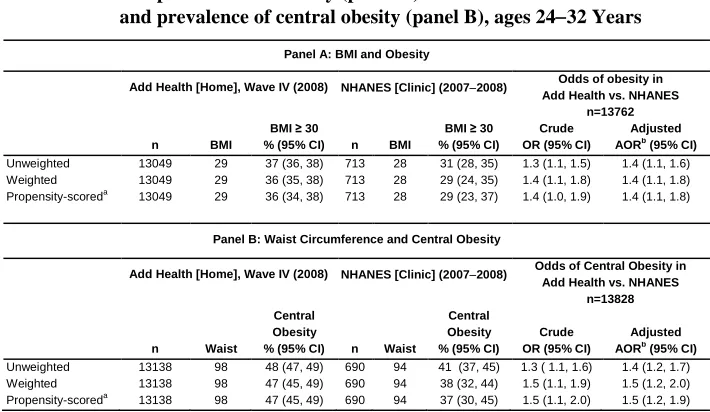
between-study differences in obesity. The adjusted odds of obesity in Add Health versus NHANES were 1.4 (95% CI = 1.1, 1.8; Table 4).
Table 3: Comparison of body mass index and waist circumference (cm) by
socio-demographic characteristics, Add Health (2008) and NHANES
(2007−2008), ages 24−32 yearsa
Mean BMI (SD) % Obeseb
(95% CI) Mean Waist (SD) Central Obesity
c % (95% CI) Add Health Home NHANES Clinic Add Health Home
NHANES Clinic Add Health Home NHANES Clinic Add Health Home NHANES Clinic
Overall 29 (8) 28 (5) 37 (35, 39) 29 (23, 34) 98 (17) 94 (13) 47 (46, 49) 38 (32, 44)
Sex
Males 29 (7) 27 (5) 36 (34, 37) 25 (20, 29) 100 (15) 94 (12) 34 (33, 36) 24 (19, 30) Females 29 (9) 28 (6) 38 (35, 41) 33 (26, 41) 97 (19) 93 (15) 61 (59, 64) 53 (45, 61) Race/Ethnicity
White, Non-Hispanic 29 (7) 27 (4) 34 (32, 36) 27 (21, 35) 98 (15) 94 (11) 46 (44, 48) 38 (31, 47) Black, Non-Hispanic 31 (10) 30 (9) 45 (42, 47) 39 (34, 45) 101 (22) 96 (19) 52 (49, 55) 44 (40, 48) Asian/Pacific Islander 27 (8) __ 24 (18, 32) __ 91 (19) __ 31 (23, 40) __ Other Race/Multiracial 30 (9) 25 (3) 40 (34, 46) 8 (1, 44)d 99 (20) 85 (7) 47 (41, 53) 12 (3, 33)d
Hispanic/Latino 30 (8) 29 (7) 43 (38, 47) 31 (26, 37) 99 (19) 95 (16) 50 (46, 55) 40 (32, 48) Mexican 30 (7) 29 (7) 44 (39, 50) 34 (26, 43) 101 (15) 96 (17) 54 (48, 60) 44 (35, 53) Cuban 29 (11) __ 43 (36, 50) __ 97 (33) __ 44 (37, 51) __ Puerto Rican 29 (8) __ 40 (30, 50) __ 97 (18) __ 44 (36, 53) __ Other Hispanic 30 (6) 28 (7) 41 (33, 50) 25 (17, 36) 98 (15) 92 (16) 48 (39, 57) 33 (22, 45)
Nativity
U.S. Born 29 (7) 28 (5) 37 (35, 39) 30 (25, 35) 98 (17) 94 (13) 48 (46, 49) 40 (34, 46) Foreign-Born 28 (8) 27 (6) 31 (26, 35) 24 (12, 42) 94 (18) 91 (14) 39 (34, 44) 30 (16, 48)
Education
0-11 years 29 (7) 29 (6) 39 (35, 42) 35 (27, 43) 100 (16) 96 (15) 49 (45, 53) 46 (38, 54) H.S. graduate/GED 30 (7) 28 (6) 42 (39, 46) 26 (18, 37) 101 (17) 94 (15) 50 (47, 53) 33 (23, 44) Some college/AA
degree 30 (8) 29 (5) 41 (39, 43) 32 (23, 44) 100 (18) 95 (13) 52 (49, 54) 42 (32, 53) 4-year college or
greater 27 (7) 27 (4) 26 (24, 29) 22 (15, 30) 94 (16) 91 (11) 38 (36, 41) 32 (22, 45) Household income
≤ $20,000 30 (8) 28 (7) 39 (35, 43) 32 (21, 46) 100 (19) 94 (16) 52 (49, 56) 42 (32, 54) > $20,000 29 (7) 28 (5) 36 (34, 38) 28 (23, 34) 98 (17) 94 (12) 46 (45, 48) 37 (31, 44)
a
Estimates exclude pregnant women
b Obese if BMI ≥30 c
Central obesity: Men: > 102 cm; Women > 88 cm
d
Table 4: Effect of weighting and propensity scoring on mean body mass index and prevalence of obesity (panel A) and mean waist circumference
and prevalence of central obesity (panel B), ages 24−32 Years
Panel A: BMI and Obesity
Add Health [Home], Wave IV (2008) NHANES [Clinic] (2007−2008) Odds of obesity in Add Health vs. NHANES
n=13762 BMI ≥ 30 BMI ≥ 30 Crude Adjusted n BMI % (95% CI) n BMI % (95% CI) OR (95% CI) AORb
(95% CI)
Unweighted 13049 29 37 (36, 38) 713 28 31 (28, 35) 1.3 (1.1, 1.5) 1.4 (1.1, 1.6) Weighted 13049 29 36 (35, 38) 713 28 29 (24, 35) 1.4 (1.1, 1.8) 1.4 (1.1, 1.8) Propensity-scoreda 13049 29 36 (34, 38) 713 28 29 (23, 37) 1.4 (1.0, 1.9) 1.4 (1.1, 1.8)
Panel B: Waist Circumference and Central Obesity
Add Health [Home], Wave IV (2008) NHANES [Clinic] (2007−2008) Odds of Central Obesity in Add Health vs. NHANES
n=13828
Central
Obesity
Central
Obesity Crude Adjusted
n Waist % (95% CI) n Waist % (95% CI) OR (95% CI) AORb (95% CI)
Unweighted 13138 98 48 (47, 49) 690 94 41 (37, 45) 1.3 ( 1.1, 1.6) 1.4 (1.2, 1.7) Weighted 13138 98 47 (45, 49) 690 94 38 (32, 44) 1.5 (1.1, 1.9) 1.5 (1.2, 2.0) Propensity-scoreda
13138 98 47 (45, 49) 690 94 37 (30, 45) 1.5 (1.1, 2.0) 1.5 (1.2, 1.9)
a
Adjusted for the predicted probability of being in the Add Health (versus NHANES) population conditional on age, sex, race/ethnicity, nativity, education, and income.
b
Logistic regression model included all above-listed covariates.
This pattern of similar mean BMI values but higher obesity rates in Add Health generally holds throughout Table 3. Mean BMI values in Add Health were typically between 0−2 kg/m2 higher than in NHANES. At the same time, a consistently higher prevalence of obesity was found in Add Health for all socio-demographic categories. In both studies the prevalence of obesity was higher among females, Blacks, and U.S. born participants, and lower among college graduates. Pronounced sex differences in obesity within racial/ethnic groups were also found in both studies (Table 5).
3.5 Add Health [home] and NHANES [clinic] waist circumference/central obesity
obesity (88 cm). In both studies, the prevalence of central obesity was higher among females, Mexican-origin Hispanics, and U.S. born participants. Those with four-year college degrees tended to have a relatively lower prevalence of central obesity, although high school and college graduates in NHANES were indistinguishable on this characteristic. Survey weights and propensities for differential selection into Add Health versus NHANES again failed to account for between-study differences in central obesity. The adjusted odds of central obesity in Add Health versus NHANES were 1.5 (95% CI = 1.2, 1.9; Table 4).
Table 5: Comparison of body mass index and waist circumference by race and
sex, Add Health (2008) and NHANES (2007-2008), ages 24−32 yearsa
Mean BMI (SD) % Obeseb
(95% CI) Mean Waist (SD) Central Obesity % (95% CI)c
Add Health Home NHANES Clinic Add Health Home NHANES Clinic Add Health Home NHANES Clinic Add Health Home NHANES Clinic Among Males
White, non-Hispanic 29 (6) 27 (4) 35 (33, 37) 26 (21, 32) 100 (13) 95 (10) 35 (33, 37) 27 (21, 34) Black, non-Hispanic 29 (7) 28 (6) 37 (33, 40) 31 (23, 41) 99 (19) 92 (16) 33 (30, 36) 22 (16, 29) Asian/Pacific
Islander 28 (8) __ 30 (21, 40) __ 94 (18) __ 21 (14, 30) __ Other
Race/Multiracial 30 (7) 25 (2) 40 (32, 49) 0 100 (18) 86 (6) 36 (28, 45) 0 Hispanic/Latino 30 (7) 28 (6) 40 (35, 46) 26 (20, 33) 101 (17) 96 (15) 36 (31, 42) 25 (18, 33) Mexican 30 (7) 29 (6) 40 (33, 48) 31 (21, 43) 103 (15) 97 (16) 40 (32, 48) 30 (22, 39) Cuban 31 (12) __ 51 (39, 63) __ 103 (37) __ 35 (19, 55) __ Puerto Rican 30 (7) __ 40 (28, 52) __ 99 (17) __ 30 (21, 41) __ Other Hispanic 29 (6) 28 (6) 40 (30, 50) 14 (6, 31)d
99 (14) 94 (14) 33 (23, 44) 14 (7, 28)d
Among Females
White, non-Hispanic 28 (7) 28 (4) 34 (31, 36) 29 (19, 42) 96 (17) 92 (11) 59 (56, 62) 51 (39, 62) Black, non-Hispanic 32 (12) 32 (10) 53 (50, 56) 45 (38, 51) 102 (25) 98 (21) 72 (69, 75) 60 (55, 66) Asian/Pacific
Islander 25 (8) __ 18 (11, 27) __ 87 (17) __ 42 (31, 54) __ Other
Race/Multiracial 30 (10) 25 (4) 40 (34, 47) 27 (3, 81)d 97 (22) 83 (9) 58 (52, 65) 36 (13, 68)d Hispanic/Latino 30 (9) 29 (8) 46 (38, 53) 38 (30, 47) 97 (20) 93 (17) 66 (60, 71) 59 (49, 69) Mexican 30 (8) 29 (7) 50 (41, 58) 38 (28, 49) 98 (18) 95 (17) 71 (66, 77) 63 (50, 74) Cuban 28 (12) __ 37 (29, 45) __ 93 (35) __ 51 (40, 62) __ Puerto Rican 29 (11) __ 40 (27, 56) __ 94 (23) __ 62 (50, 73) __ Other Hispanic 30 (8) 28 (8) 42 (29, 57) 38 (26, 52) 97 (19) 90 (17) 62 (50, 73) 53 (37, 69)
a
Estimates exclude pregnant women
b
Obese if BMI ≥30
c
Central obesity: men: > 102 cm; women > 88 cm
d
4. Discussion
The recent increase in the number of major social and demographic surveys collecting measured anthropometric and other biomarkers in field settings (Harris 2010) has heightened demand for details on the quality of these data. To address this need, we evaluated the characteristics and reliability of in-home anthropometrics collected in a national sample of 15,701 young adults. Based on the findings, we conclude that the reliability of Add Health Wave IV anthropometric measures is high. There was no evidence of substantial digit preference and the short-term test-retest reliabilities of measured height, weight, waist, and arm circumference were excellent.
Our descriptive analysis provides new and troubling data on the anthropometric profile of young adults in the United States. In this nationally representative cohort of 24−32 year-olds, the average BMI (29 kg/m2) was in the overweight category and 37% were obese. Further, apart from Asian/Pacific Islander females, the prevalence of obesity was 30% or greater for every racial/ethnic by sex group examined and 50% or greater for Mexican-origin females (50%), Cuban-origin males (51%), and Black females (53%).
The prevalence of obesity by sex, race/ethnicity, nativity, and education was consistently higher among Add Health versus NHANES young adults. These findings are similar to Add Health-NHANES comparisons made at Waves I and III (Gordon-Larsen et al. 2004). Sample differences likely account, in part, for the discordance. While both samples are nationally representative, Add Health is representative of U.S. adolescents in grades 7−12 during the 1994−95 school year who were followed into adulthood. NHANES, by contrast, is representative of the current U.S. population of young adults. This distinction is important. For example, the percentage of foreign-born young adults − due to recent migration patterns − is significantly higher in NHANES (19%) than in Add Health (5%). Still, the higher prevalence of obesity and central obesity in Add Health versus NHANES persisted even after weighting for unequal sampling probabilities, clustering, and predicted probabilities of participant selection.
4.1 Study strengths and limitations
(vs. NHANES) also yields more precise estimates of obesity and central obesity by key socio-demographic characteristics.
The main limitations of this study pertain to the practical challenges associated with collecting anthropometric data in the home within the context of a large, nationwide sample involving 323 field interviewers. Both cost and logistics were important considerations in the design of the measurement protocols. Field interviewers worked alone and often some walking was required to reach participants, making the weight and portability of their interview materials, which included a laptop and blood spot collection kit, key considerations. Thus, while a portable stadiometer may have provided more accurate height measurements, this potential benefit was offset by its added cost, weight, and bulk.
4.2 Conclusions
Obesity is an established risk factor for morbidity and mortality (Bogers et al. 2007; Flegal et al. 2007). Consequently, its high prevalence in these young adults may foreshadow an exceptional burden of chronic disease and premature mortality as they enter middle adulthood (Reither, Olshansky, and Yang 2011). Indeed, a high prevalence of hypertension and diabetes − both of which are strong risk factors for cardiovascular disease − already exists in this cohort (Nguyen et al. 2011, 2014). These troubling indicators highlight the value of collecting, documenting, and disseminating reliable anthropometric data that − when linked to longitudinal socio-demographic and contextual measures − can significantly advance our understanding of this growing threat to population health.
5. Acknowledgements
This research was supported in part by Awards P01-HD31921, R01-HD057073, R01-HD058535, and R01-HD057194 from the Eunice Kennedy Shriver National Institute of Child Health & Human Development. The content is solely the responsibility of the authors and does not necessarily represent the official views of the Eunice Kennedy Shriver National Institute of Child Health & Human Development or the National Institutes of Health.
References
Bogers, R.P., Bemelmans, W.J.E., Hoogenveen, R.T., Boshuizen, H.C. , Woodward, M., Knekt, P., van Dam, R.M., Hu, F.B., Visscher, T.L.S., Menotti, A., Thorpe, R.J., Jamrozik, K., Calling, S., Strand, B.H., and Shipley, M.J. (2007). Association of Overweight With Increased Risk of Coronary Heart Disease Partly Independent of Blood Pressure and Cholesterol Levels. A Meta-analysis of 21 Cohort Studies Including More Than 300 000 Persons. Archives of Internal Medicine 167(16): 1720−1728. doi:10.1001/archinte.167.16.1720.
Caballero, B. (2007). The Global Epidemic of Obesity: An Overview. Epidemiologic Reviews 29(1): 1−5. doi:10.1093/epirev/mxm012.
CDC [Centers for Disease Control and Prevention] (2007). National Health and Nutrition Examination Survey (NHANES). Anthropometry Procedures Manual [electronic resource]. Atlanta, GA: National Center for Health Statistics. [http://www.cdc.gov/nchs/data/nhanes/nhanes_07_08/manual_an.pdf]
CDC [Centers for Disease Control and Prevention] (2010). NHANES 2007-2008 [electronic resource]. Atlanta, GA: National Center for Health Statistics. [http://wwwn.cdc.gov/nchs/nhanes/search/nhanes07_08.aspx]
Crespi, C.M., Alfonso, V.H., Whaley, S.E., and Wang, M.C. (2012). Validity of child anthropometric measurements in the Special Supplemental Nutrition Program for Women, Infants, and Children. Pediatric Research 71(3): 286−292. doi:10.1 038/pr.2011.37.
El-Moalem, H.E., Gagnon, J., Province, M., Bouchard, C., Leon, A.S., Skinner, J.S., Wilmore, J.H., and Rao, D.C. (1997). Race differences in reproducibilities: The HERITAGE family study. American Journal of Human Biology 9(4): 415−424. doi:10.1002/(SICI)1520-6300(1997)9:4<415::AID-AJHB1>3.0.CO;2-V.
Entzel, P., Whitsel, E.A., Richardson, A., Tabor, J., Hallquist, S., Hussey, J.M., Halpern, C.T., and Harris, K.M. (2009). Add Health Wave IV Documentation. Cardiovascular and Anthropometric Measures [electronic resource]. Chapel Hill, NC: Carolina Population Center. [http://www.cpc.unc.edu/projects/addhealth/ data/guides/Wave IV cardiovascular and anthropometric documentation 110209. pdf]
Flegal, K.M., Graubard, B.I., Williamson, D.F., and Gail, M.H. (2007). Cause-Specific Excess Deaths Associated With Underweight, Overweight, and Obesity. JAMA
Gordon-Larsen, P., Adair, L.S., Nelson, M.C., and Popkin, B.M. (2004). Five-year obesity incidence in the transition period between adolescence and adulthood: the National Longitudinal Study of Adolescent Health. American Journal of Clinical Nutrition 80(3): 569−575.
Harris, K.M. (2009). The National Longitudinal Study of Adolescent to Adult Health (Add Health), Waves I & II, 1994–1996; Wave III, 2001–2002; Wave IV, 2007−2009. (machine-readable data file and documentation). Chapel Hill, NC: Carolina Population Center, University of North Carolina at Chapel Hill.
Harris, K.M. (2010). An integrative approach to health. Demography 47(1): 1−22. doi:10.1353/dem.0.0091.
Harris, K.M., Halpern, C.T., Whitsel, E., Hussey, J., Tabor, J., Entzel, P., and Udry, J.R. (2009). The National Longitudinal Study of Adolescent to Adult Health: Research design [electronic resource]. Chapel Hill, NC: Carolina Population Center. [http://www.cpc.unc.edu/projects/addhealth/design]
Lee, H.E., Lee, D., Guo, G., and Harris, K.M. (2011). Trends in Body Mass Index in Adolescence and Young Adulthood in the United States: 1959–2002. Journal of Adolescent Health 49(6): 601−608. doi:10.1016/j.jadohealth.2011.04.019. Mueller W.H., Taylor, W.C., Chan, W., Sangi-Haghpeykar, H., Snider, S.A., and Hsu,
H.-A. (1996). Precision of Measuring Body Fat Distribution in Adolescent African American Girls From the ‘Healthy Growth Study’. American Journal of Human Biology 8: 325−329. doi:10.1002/(SICI)1520-6300(1996)8:3<325::AID-AJHB3>3.0.CO;2-Z.
National Heart, Lung and Blood Institute, Atherosclerosis Risk in Communities Study (1989). Manual 12: Quality assurance and quality control, section 5.2. Monitoring for digit preference [electronic resource]. Chapel Hill, NC: Collaborative Studies Coordinating Center. [http://www.cscc.unc.edu/aric/visit/] Nguyen, Q.C., Tabor, J.W., Entzel, P.P., Lau, Y., Suchindran, C., Hussey, J.M.,
Halpern, C.T., Harris, K.M., and Whitsel, E.A. (2011). Discordance in National Estimates of Hypertension Among Young Adults. Epidemiology 22(4): 532−541. doi:10.1097/EDE.0b013e31821c79d2.
Annals of Epidemiology 24(12): 903−909. doi:10.1016/j.annepidem.2014.09.0 10.
NHLBI Obesity Education Initiative Expert Panel on the Identification, Evaluation, and Treatment of Obesity in Adults (US) (1998). Clinical Guidelines on the Identification, Evaluation, and Treatment of Overweight and Obesity in Adults: The Evidence Report [electronic resource]. Bethesda, MA: National Heart, Lung, and Blood Institute. [http://www.ncbi.nlm.nih.gov/books/NBK2003/] Oehlert, G.W. (1992). A Note on the Delta Method. American Statistician 46(1):
27−29. doi:10.2307/2684406.
Reither, E.N., Olshansky, S.J., and Yang, Y. (2011). New Forecasting Methodology Indicates More Disease And Earlier Mortality Ahead For Today’s Younger Americans. Health Affairs 30(8): 1562−1568. doi:10.1377/hlthaff.2011.0092. RTI International (2010). Add Health field interviewer verification script [electronic
resource]. Chapel Hill, NC: Carolina Population Center. [http://www.cpc.unc. edu/projects/addhealth/data/guides/FI_verify.pdf]
Appendix
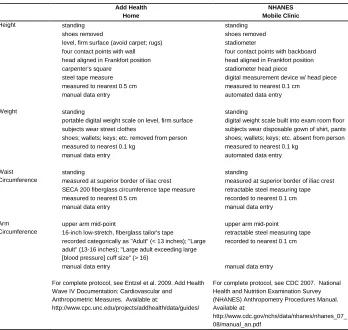
Table A: Comparison of anthropometry procedures for Add Health (2008)
and NHANES (2007−8)
Add Health Home
NHANES Mobile Clinic
Height standing shoes removed
level, firm surface (avoid carpet; rugs) four contact points with wall head aligned in Frankfort position carpenter's square
steel tape measure measured to nearest 0.5 cm manual data entry
standing shoes removed stadiometer
four contact points with backboard head aligned in Frankfort position stadiometer head piece
digital measurement device w/ head piece measured to nearest 0.1 cm
automated data entry
Weight standing
portable digital weight scale on level, firm surface subjects wear street clothes
shoes; wallets; keys; etc. removed from person measured to nearest 0.1 kg
manual data entry
standing
digital weight scale built into exam room floor subjects wear disposable gown of shirt, pants shoes; wallets; keys; etc. absent from person measured to nearest 0.1 kg
automated data entry
Waist Circumference
standing
measured at superior border of iliac crest SECA 200 fiberglass circumference tape measure measured to nearest 0.5 cm
manual data entry
standing
measured at superior border of iliac crest retractable steel measuring tape recorded to nearest 0.1 cm manual data entry
Arm Circumference
upper arm mid-point
16-inch low-stretch, fiberglass tailor's tape recorded categorically as "Adult" (< 13 inches); "Large adult" (13-16 inches); "Large adult exceeding large [blood pressure] cuff size" (> 16)
manual data entry
upper arm mid-point retractable steel measuring tape recorded to nearest 0.1 cm
manual data entry
For complete protocol, see Entzel et al. 2009. Add Health Wave IV Documentation: Cardiovascular and Anthropometric Measures. Available at:
http://www.cpc.unc.edu/projects/addhealth/data/guides/
For complete protocol, see CDC 2007. National Health and Nutrition Examination Survey (NHANES) Anthropometry Procedures Manual. Available at: