DEMOGRAPHIC RESEARCH
VOLUME 31, ARTICLE 32, PAGES 975
1006
PUBLISHED 30 OCTOBER 2014
http://www.demographic-research.org/Volumes/Vol31/32/ DOI: 10.4054/DemRes.2014.31.32
Research Article
Why the racial gap in life expectancy is declining
in the United States
Glenn Firebaugh
Francesco Acciai
Aggie J. Noah
Christopher Prather
Claudia Nau
© 2014 Firebaugh, Acciai, Noah, Prather & Nau.
This open-access work is published under the terms of the Creative Commons Attribution NonCommercial License 2.0 Germany, which permits use, reproduction & distribution in any medium for non-commercial purposes, provided the original author(s) and source are given credit.
1 Introduction 976 2 Cause decomposition as a tool for studying life expectancy 977
3 Analytic methods 978
3.1 Equations for identifying sources of the longevity gap at a point in time
978 3.2 Equations for identifying sources of change in the longevity gap 981
4 Data 981
5 Decomposition of the racial gap by cause in 2000 and in 2010 983 6 Decomposition of the racial gap by cause and by age at death vs.
incidence
985 6.1 Cause-specific probability of death and average age at death for
blacks and whites in 2000 and 2010
985 6.2 Narrowing of the longevity gap: Reductions in the age component
versus reductions in the incidence component
989
7 Decomposition of the racial gap by cause and by sex 991 7.1 Equations for identifying sources of the longevity gap at a point in
time, by sex
991 7.2 Men’s and women’s contributions to the racial gap, by cause: 2000,
2010, and change from 2000 to 2010
993
8 What is new here: Comparison with a prior study 995
9 Discussion and conclusion 996
10 Acknowledgements 999
References 1000
Why the racial gap in life expectancy is declining in the United
States
Glenn Firebaugh1
Francesco Acciai2
Aggie J. Noah3
Christopher Prather4
Claudia Nau5
Abstract
BACKGROUND
Blacks have lower life expectancy than whites in the United States. That disparity could be due to racial differences in the causes of death, with blacks being more likely to die of causes that affect the young, or it could be due to differences in the average ages of blacks and whites who die of the same cause. Prior studies fail to distinguish these two possibilities.
OBJECTIVE
In this study we determine how much of the 2000‒10 reduction in the racial gap in life expectancy resulted from narrowing differences in the cause-specific mean age at death for blacks and whites, as opposed to changing cause-specific probabilities for blacks and whites.
METHOD
We introduce a method for separating the probabilities and difference-in-age components of group disparities in life expectancy.
RESULTS
Based on the new method, we find that 60% of the decline in the racial gap in life expectancy from 2000 to 2010 was attributable to reduction in the age component,
1
Department of Sociology, Pennsylvania State University, 211 Oswald Tower, University Park, Pennsylvania, 16802, U.S.A. E-Mail: [email protected].
2 Pennsylvania State University, U.S.A. E-Mail: [email protected]. 3 Pennsylvania State University, U.S.A. E-Mail: [email protected]. 4
largely because of declining differences in the age at which blacks and whites die of chronic diseases.
CONCLUSION
Our findings shed light on the sources of the declining racial gap in life expectancy in the United States, and help to identify where advances need to be made to achieve the goal of eliminating racial disparities in life expectancy.
1. Introduction
The gap in life expectancy between blacks and whites in the United States has been declining. In the first ten years of this century, gains in life expectancy for blacks outstripped gains for whites by nearly two years, reducing the racial gap from 5.7 years in 2000 down to 3.8 years in 2010, an historic low. This decline is attributable largely to the relative mortality improvement of blacks versus whites with respect to heart disease, HIV/AIDS, accidental poisoning (mostly drug-related), and cancer (Harper, Rushani and Kaufman 2012). The life expectancy gap that persists is due primarily to remaining black-white mortality differences in heart disease, homicide (especially for men), cancer, diabetes, HIV/AIDS, and perinatal conditions (Harper et al. 2012; Kochanek, Arias and Anderson 2013; Wong et al. 2002).
What we do not know is how racial differences in heart disease, cancer, etc., contribute to the gap in life expectancy. Cancer, for example, might contribute to the gap because overall death rates for cancer are higher for blacks than for whites, or because black cancer victims tend to be younger than white cancer victims, or both. Although prior studies identify the causes associated with the gap in life expectancy, they do not indicate which mechanism – the difference-in-age component (or simply
age component) or the difference-in-probability component (or incidencecomponent) – is driving the difference. To fashion effective policy for reducing the racial gap, however, we need to know whether the gap is located in black-white differences in cause-specific incidence (indicating differences in the risk of succumbing to given causes) or in differences in the cause-specific mean age at death (indicating differences in the age-profile of risk-exposure).
across 19 principal causes of death. We use that information to decompose the racial gap in life expectancy, separating the part due to black-white differences in cause-specific incidence from the part due to black-white differences in cause-cause-specific average age at death. By comparing those results for 2000 to 2010 we uncover why the racial gap in life expectancy declined by one-third over that period. Then, in the second phase of our analysis, we use multi-decrement sex-specific life tables to determine the separate contributions of men and women, by cause, to the narrowing of the overall gap. We conclude the paper by summarizing our major findings and discussing their implications.
2. Cause decomposition as a tool for studying life expectancy
Demographers have a longstanding interest in how specific causes of death contribute to life expectancy. As Beltrán-Sánchez, Preston, and Canudas-Romo (2008) note in their illuminating synthesis, demographers have developed two basic methods for estimating this contribution. One method estimates the contribution of a cause by recalculating the life table with no deaths assigned to that cause (often called “cause-deleted” life tables) (Newman 1987). A second method uses decomposition formulas, derived by Arriaga (1984), Andreev (1982), Pollard (1982), and Pressat (1985) and later extended by Andreev et al. (2002) and Vaupel and Canudas-Romo (2002, 2003), to investigate how specific causes of death contribute to life expectancy.
Neither approach suffices, however, when – as in the United States – the stated goal is to eliminate disparities in life expectancy between different segments of the population, such as blacks and whites (US Department of Health and Human Services 2000). To fashion policies to eliminate black-white disparity, we want to know whether the disparity is located in age differences among blacks and whites who succumb to the same cause, or to differences in the causes of death for blacks and whites (that is, in their incidence). Although cause-deletion and decomposition methods can tell us the portion of the black-white gap in life expectancy that is associated with (say) cancer, neither method can distinguish whether cancer matters because blacks are more likely to die of cancer or because black victims of cancer on average are younger than white victims of cancer. Likewise, in accounting for the narrowingof the black-white gap in life expectancy, standard methods do not tell us whether the contribution of a particular cause is due to convergence in incidence, to convergence in the mean age at death, or to a combination of the two.
(3.8 years) than life expectancy for the white population because of higher death rates due to heart disease, cancer, homicide, diabetes, and perinatal conditions” (Kochanek et al. 2013: 3). Yet it is possible that the contributions of heart disease, cancer, and so on are not due – or at least not entirely due – to higher death rates for blacks (the incidence component), but to the lower cause-specific mean age at death for blacks, since in the Arriaga method the incidence component is not separated from the age component.
Similarly, Harper et al. (2007) use the Arriaga method to decompose the black-white gap in life expectancy for 1983, 1993, and 2003. They decompose by cause of death and, in a separate decomposition, by age group. The 2003 results from the cause decomposition are similar to those from Kochanek et al. (2013) for 2010 – heart disease, cancer, homicide (especially for men), diabetes (for women), and perinatal death are all major contributors to the life expectancy gap – but again these findings do not distinguish age-at-death differences from differences in incidence. From the Harper et al. (2007) age decomposition we learn that age group 45-64 accounted for about two-fifths of the gap for both men and women in 2003, and that age group 15-44 accounted for another one-fifth of the gap. From these results we conclude that blacks are more likely than whites to die between the ages of 14 and 65, but we do not know why: is it because of differences in cause-specific incidence (for example, blacks are more likely to die of homicide, which predominately affects the young) or because of blacks’ earlier deaths from the same causes as whites?
We now describe a method for assessing, for each cause of death, the relative contributions of the age and incidence components to the life expectancy gap. The method uses a logic that is akin to the tradition in demography that separates the contribution of population composition from the contribution of differences in rates (Das Gupta 1993; Kitagawa 1955, 1964).
3. Analytic methods
3.1 Equations for identifying sources of the longevity gap at a point in time
gap attributable to differences in the mean age at death ( ̅ ̅ ) from the portion attributable to differences in the probability of dying of each cause ( ), where the subscript c indexes cause of death, B denotes non-Hispanic blacks, and W denotes non-Hispanic whites.6
Because overall life expectancy is the probability-weighted sum of cause-specific life expectancies (life table mean age at death for that cause), the gap in life expectancy for blacks and whites, , is:
∑ ̅ ∑ ̅ (1)
where ∑ ∑ . It follows that ∑ ∑ , where k is a
constant. In particular, let k be ̅ , the simple mean of the life expectancies for blacks and whites. Then, to determine the contribution of specific causes to the longevity gap, we insert ∑ ̅ ∑ ̅, a term that equals zero, into (1) and rearrange terms:
∑ ̅ ∑ ̅ ∑ ̅ ∑ ̅
∑ ( ̅ ̅) ∑ ( ̅ ̅)
(2)
From (2) it follows that the contribution of each cause to the black-white longevity gap is:
( ̅ ̅) ( ̅ ̅) (3)
The first term, ( ̅ ̅), is positive when white victims of cause c on average
outlive the overall simple average life expectancy ( ̅) and negative when white victims tend to die before the overall average. Similarly, the second term in (3) is positive when black victims of cause c on average outlive the overall average and negative when they generally die before the overall life expectancy. If equation (3) – the first term minus the second term – is positive, then cause c increases the racial gap in life expectancy. If the two terms are the same, cause c does not contribute to the gap. If the difference is negative, then cause c narrows the gap.
From (3) we can see that the effects of mean age at death and probability of death are intertwined because they weight each other. To separate out the age component for
6
a specific cause, we remove the incidence component in (3) by setting and at their mean value ( ̅ ) for blacks and whites. Thus the age component is:
̅ ( ̅ ̅ ) (4)
Age differences matter more when they occur in common causes of death than when they occur in rare causes of death, so the equation for the age component weights the age difference ̅ ̅ by the probability of dying of the cause.
We separate out the incidence component in the same way, that is, we remove the influence of differences in age at death in (3) by setting ̅ ̅ and ̅ ̅ at their mean, ( ̅ ̅) ( ̅ ̅) ⁄ . Rewriting ( ̅ ̅) ( ̅ ̅) ⁄ as ̅ ̅, where ̅ ( ̅ ̅ ) ⁄ , and inserting this value into (3), the incidence component is:
( ̅ ̅)( ) (5)
Differences in the probability of dying affect the longevity gap more for causes that strike predominately at the tails as opposed to the middle of the age-at-death distribution, so the equation for the incidence component weights the difference in the probabilities by the average distance from the overall mean age.7
Summing over all causes in (4) reveals how much of the longevity gap is accounted for by differences in the ages at which blacks and whites succumb to specific causes of death:
∑ ̅ ( ̅ ̅ ) (6)
Likewise, summing over all causes in (5) reveals how much of the gap is accounted for by differences in cause-specific incidence for blacks and whites:
∑ ( ̅ ̅)( ) (7)
The all-cause age and incidence components sum to the overall longevity gap.
3.2 Equations for identifying sources of change in the longevity gap
Changein the longevity gap is due to change in the age and incidence components. To determine how much of the narrowing of the longevity gap from 2000 to 2010 was due to declines in each of those components, we add subscripts 0 and 1 to indicate the years 2000 and 2010, respectively. Then, from equation (4), change in the age component over time for cause c is:
̅ ( ̅ ̅ ) ̅ ( ̅ ̅ ) (8)
Similarly, change in the incidence component for the cth cause is, from (5):
( ̅ ̅ )( ) ( ̅ ̅ )( ) (9)
To determine how much of the narrowing of the longevity gap is due to change in the contributions of the age components for all causes, we sum over causes in (8). Likewise, to determine how much of the narrowing of the longevity gap is due to change in the contributions of the incidence components for all causes of death, we sum over causes in (9).
4. Data
We draw upon the 2000 and 2010 Multiple Cause of Death Mortality files (National Center for Health Statistics 2007, 2012), which also include census counts of the U.S. population by sex, age, and race. The NCHS mortality data contain information on all deaths occurring among the U.S. resident population during the calendar year, and include information on the underlying cause of death8 as well as on selected
8
demographic characteristics obtained from death certificates. The 2000 and 2010 population counts are from the U.S. Census Bureau’s April 1st bridged modified race
census counts (National Center for Health Statistics 2007, 2012). We stratify the mortality data by race and cause of death in order to create the cause-age-specific multiple decrement life table data. After removing Hispanics, we create separate multiple decrement life tables for blacks and whites.9By using multiple decrement life tables we eliminate the effect of black-white differences in population size and age composition, and we obtain the life table number of deaths and mean ages at death by cause of death (Carey 1989).10
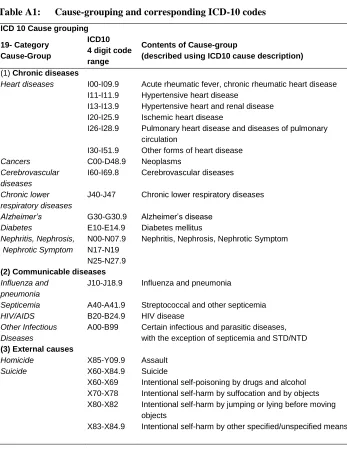
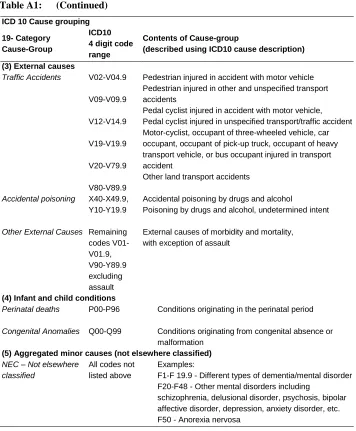
Causes of death were coded using the 10th revision of the International Classification of Diseases (ICD-10). This classification contains over 10,000 individual codes. In order to reduce the number of causes under investigation while still considering the entire landscape of disease, we regrouped causes into broad categories that are sensible from an epidemiological point of view. We began with the coding scheme used to identify the 15 leading causes of death in the National Vital Statistics Report for 2006 (Heron et al. 2009). We then adapted this scheme based on data constraints and on the findings of prior analyses (Harper et al. 2007; Nau and Firebaugh 2012) to include causes that are of particular relevance to the racial gap in life expectancy. Our final cause categorization consists of (a) the 10 leading causes of death in the United States in 2006, with the exception that we substituted traffic accidents and accidental poisoning for the more general category “accidents”; (b) 5 new cause categories – homicide, suicide, infectious diseases other than influenza, septicemia, and HIV/AIDS (which are listed separately), and external causes other than homicide, suicide, traffic accidents, and accidental poisoning (which are also listed separately); (c) two infant and child conditions (perinatal deaths and congenital anomalies), and (d) a residual category of causes not elsewhere classified (“n.e.c.”). The residual category assembles all ill-defined causes of death as well as all causes that had too few deaths to stand on their own or that are not of primary interest from a population health point of view. We included accidental poisoning, HIV/AIDS, suicide, and homicide as separate causes because they are highly associated with race in the United States (Appendix Table 2 reports the racial difference in probabilities for each cause). Appendix Table 1 describes our cause grouping in more detail.
9
Recall that we are comparing the life expectancy of non-Hispanic blacks and non-Hispanic whites. We exclude Hispanics because of their distinctive life expectancy, which differs from that of blacks and of whites. We also exclude the very small percentage of the sample (fewer than 1%) that failed to specify whether or not they were of Hispanic origin.
10
5. Decomposition of the racial gap by cause in 2000 and in 2010
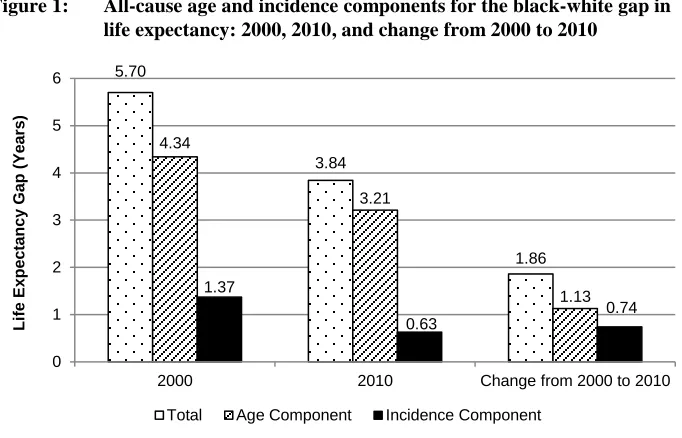
To set the stage for the more detailed analyses to follow, Figure 1 presents the all-cause age and incidence components for the overall racial gap in life expectancy in the United States in 2000 and 2010. The age component accounted for about 4.3 years of the racial gap in 2000 and about 3.2 years of the gap in 2010 (Figure 1), so roughly three-fifths of the 1.9-year decline in the racial gap from 2000‒2010 was due to narrowing of the difference in the average age at death for blacks and whites who died of the same cause. Convergence in cause-specific incidence for blacks and whites accounted for the remaining two-fifths of the decline in the racial gap.
Figure 1: All-cause age and incidence components for the black-white gap in life expectancy: 2000, 2010, and change from 2000 to 2010
Table 1 presents the contribution of each of the 19 causes to the racial gap in life expectancy in 2000 and in 2010. Several findings stand out. First, in terms of years of life expectancy, virtually all causes of death contributed less to the racial gap in 2010 than in 2000. The greater life expectancy gains for blacks, then, were spread out across the 19 causes of death. (The one exception is trivial: communicable diseases other than HIV/AIDS, septicemia, and influenza contributed 0.01 more years – or four more days of life – to the gap in 2010.)
5.70
3.84
1.86 4.34
3.21
1.13 1.37
0.63
0.74
0 1 2 3 4 5 6
2000 2010 Change from 2000 to 2010
Li
fe
E
x
pec
ta
ncy
Ga
p
(Y
e
a
rs
)
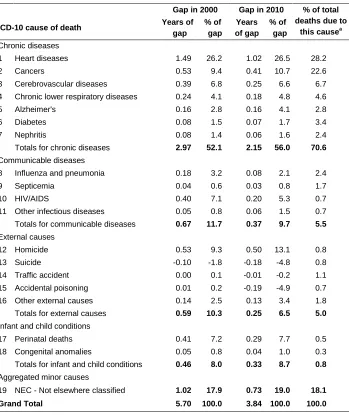
Table 1: Cause-specific components of the black-white gap in life expectancy in the United States in 2000 and 2010, and total percentages of deaths due to each cause
Gap in 2000 Gap in 2010 % of total
deaths due to
this causea
ICD-10 cause of death Years of
gap
% of gap
Years of gap
% of gap
Chronic diseases
1 Heart diseases 1.49 26.2 1.02 26.5 28.2
2 Cancers 0.53 9.4 0.41 10.7 22.6
3 Cerebrovascular diseases 0.39 6.8 0.25 6.6 6.7
4 Chronic lower respiratory diseases 0.24 4.1 0.18 4.8 4.6
5 Alzheimer's 0.16 2.8 0.16 4.1 2.8
6 Diabetes 0.08 1.5 0.07 1.7 3.4
7 Nephritis 0.08 1.4 0.06 1.6 2.4
Totals for chronic diseases 2.97 52.1 2.15 56.0 70.6
Communicable diseases
8 Influenza and pneumonia 0.18 3.2 0.08 2.1 2.4
9 Septicemia 0.04 0.6 0.03 0.8 1.7
10 HIV/AIDS 0.40 7.1 0.20 5.3 0.7
11 Other infectious diseases 0.05 0.8 0.06 1.5 0.7
Totals for communicable diseases 0.67 11.7 0.37 9.7 5.5
External causes
12 Homicide 0.53 9.3 0.50 13.1 0.8
13 Suicide -0.10 -1.8 -0.18 -4.8 0.8
14 Traffic accident 0.00 0.1 -0.01 -0.2 1.1
15 Accidental poisoning 0.01 0.2 -0.19 -4.9 0.7
16 Other external causes 0.14 2.5 0.13 3.4 1.8
Totals for external causes 0.59 10.3 0.25 6.5 5.0
Infant and child conditions
17 Perinatal deaths 0.41 7.2 0.29 7.7 0.5
18 Congenital anomalies 0.05 0.8 0.04 1.0 0.3
Totals for infant and child conditions 0.46 8.0 0.33 8.7 0.8
Aggregated minor causes
19 NEC - Not elsewhere classified 1.02 17.9 0.73 19.0 18.1
Grand Total 5.70 100.0 3.84 100.0 100.0
a
The second notable finding is that the racial gap in life expectancy has multiple sources in both periods, with no single cause of death responsible for the majority of the gap. The largest contributor is heart disease, accounting for 1.5 years of the 5.7-year gap in 2000 and one year of the 3.8-year gap in 2010, or roughly one-fourth of the racial gap each year. These results replicate the findings of Kochanek et al. (2013) and can be attributed to the fact that heart disease accounts for more than one-fourth of all deaths in the United States.
Third, some relatively rare causes of death contribute more to the racial gap than do some common causes of death. Homicide, for example, accounted for more of the racial gap in life expectancy in 2010 than did cancer, even though blacks are about 17 times more likely, and whites about 120 times more likely, to be cancer victims than homicide victims. In both years perinatal deaths accounted for more of the racial gap than did cerebrovascular disease, even though cerebrovascular disease is a much more common cause of death. Homicide, HIV/AIDS, and perinatal deaths are major over-contributors to the racial gap. Suicide and accidental poisoning – also causes of death that disproportionately strike the young – stand out because they narrow, not widen, the racial gap in life expectancy.11 Of the leading causes of death in the United States, heart disease and cerebrovascular disease contribute to the racial gap roughly in proportion to their share of deaths, whereas cancer contributes proportionately less (23% of deaths, 10% of the racial gap).
Prior studies end here, with the decomposition of group differences in life expectancy by cause of death. We extend those results by using our decomposition method to determine, for each cause of death, how much of the contribution to the overall gap in life expectancy reflects group differences in probabilities and how much reflects group differences in age at death. We report those results in the next section.
6. Decomposition of the racial gap by cause and by age at death vs.
incidence
6.1 Cause-specific probability of death and average age at death for blacks and whites in 2000 and 2010
In this section we show that the shorter life expectancy of blacks is the result of (a) racial differences in incidence for select causes and (b) an across-the-board (or nearly so) lower average age at death for blacks than for whites who die of the same cause. To determine how much of the racial gap is due to (a) and how much is due to (b), we
11
decompose the racial gaps in 2000 and in 2010 simultaneously by cause of death and by age at death versus incidence.
Results from the multidecrement life tables for 2000 and 2010 (Appendix Table 2) reveal that whites tend to outlive blacks in the United States for virtually every cause of death (accidental poisoning is the only notable exception, with white victims being 3.6 years younger on average in 2000 and 6.6 years younger in 2010). The magnitude of the black-white age difference varies across causes, from a few months in the case of Alzheimer’s and HIV/AIDS to over 10 years for homicides in 2010. For most causes, however, the age difference is narrowing over time, particularly for chronic diseases. For heart disease victims the black-white disparity in average age at death declined by 0.7 years, from 4.7 years in 2000 to 4.0 years in 2010. For cancer victims the black-white disparity in age at death declined by 0.6 years over the course of the decade (Appendix Table 2).
Changes in the incidence component are more complex. Blacks are about eight times more likely than whites to die of HIV/AIDS and about seven times more likely to be homicide victims. Whites, on the other hand, are about three times more likely to commit suicide and also were more likely, in 2010, to die of accidental poisoning (largely drug-related: Warner et al. 2011). As noted earlier, the effect of these differences on the racial gap in life expectancy depends on whether the cause-specific mean age at death is higher or lower than the overall mean age at death. Because causes of death are competing against each other, the black-white longevity gap would narrow, for example, if a higher proportion of blacks than whites died of Alzheimer’s. Homicide has the opposite effect, with a higher proportion of black victims enlarging the gap.
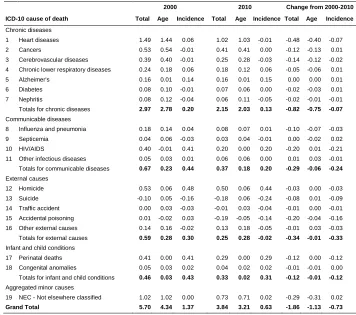
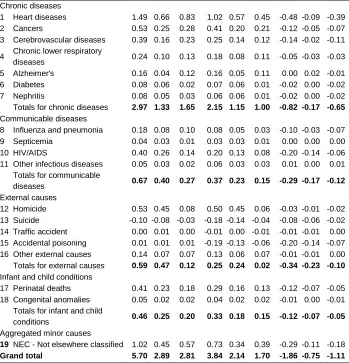
Table 2: Cause-specific age and incidence components of the black-white gap in life expectancy in the United States in 2000 and 2010, and change from 2000-2010 (in years)
2000 2010 Change from 2000-2010
ICD-10 cause of death Total Age Incidence Total Age Incidence Total Age Incidence Chronic diseases 1 Heart diseases 1.49 1.44 0.06 1.02 1.03 -0.01 -0.48 -0.40 -0.07 2 Cancers 0.53 0.54 -0.01 0.41 0.41 0.00 -0.12 -0.13 0.01 3 Cerebrovascular diseases 0.39 0.40 -0.01 0.25 0.28 -0.03 -0.14 -0.12 -0.02 4 Chronic lower respiratory diseases 0.24 0.18 0.06 0.18 0.12 0.06 -0.05 -0.06 0.01 5 Alzheimer's 0.16 0.01 0.14 0.16 0.01 0.15 0.00 0.00 0.01 6 Diabetes 0.08 0.10 -0.01 0.07 0.06 0.00 -0.02 -0.03 0.01 7 Nephritis 0.08 0.12 -0.04 0.06 0.11 -0.05 -0.02 -0.01 -0.01 Totals for chronic diseases 2.97 2.78 0.20 2.15 2.03 0.13 -0.82 -0.75 -0.07 Communicable diseases
8 Influenza and pneumonia 0.18 0.14 0.04 0.08 0.07 0.01 -0.10 -0.07 -0.03 9 Septicemia 0.04 0.06 -0.03 0.03 0.04 -0.01 0.00 -0.02 0.02 10 HIV/AIDS 0.40 -0.01 0.41 0.20 0.00 0.20 -0.20 0.01 -0.21 11 Other infectious diseases 0.05 0.03 0.01 0.06 0.06 0.00 0.01 0.03 -0.01 Totals for communicable diseases 0.67 0.23 0.44 0.37 0.18 0.20 -0.29 -0.06 -0.24 External causes
12 Homicide 0.53 0.06 0.48 0.50 0.06 0.44 -0.03 0.00 -0.03 13 Suicide -0.10 0.05 -0.16 -0.18 0.06 -0.24 -0.08 0.01 -0.09 14 Traffic accident 0.00 0.03 -0.03 -0.01 0.03 -0.04 -0.01 0.00 -0.01 15 Accidental poisoning 0.01 -0.02 0.03 -0.19 -0.05 -0.14 -0.20 -0.04 -0.16 16 Other external causes 0.14 0.16 -0.02 0.13 0.18 -0.05 -0.01 0.03 -0.03 Totals for external causes 0.59 0.28 0.30 0.25 0.28 -0.02 -0.34 -0.01 -0.33 Infant and child conditions
17 Perinatal deaths 0.41 0.00 0.41 0.29 0.00 0.29 -0.12 0.00 -0.12 18 Congenital anomalies 0.05 0.03 0.02 0.04 0.02 0.02 -0.01 -0.01 0.00 Totals for infant and child conditions 0.46 0.03 0.43 0.33 0.02 0.31 -0.12 -0.01 -0.12 Aggregated minor causes
19 NEC - Not elsewhere classified 1.02 1.02 0.00 0.73 0.71 0.02 -0.29 -0.31 0.02 Grand Total 5.70 4.34 1.37 3.84 3.21 0.63 -1.86 -1.13 -0.73
differences in incidence. In the case of communicable diseases the incidence component is larger than the age component because of HIV/AIDS. For all other communicable diseases the age component is larger than the incidence component (Table 2).
The general category of external causes of death – homicides, suicides, traffic fatalities, and accidental poisoning – provides important insights about mortality differences for blacks and whites. For external causes collectively the age and incidence components are roughly the same in 2000, each responsible for about 0.3 years of the racial gap in life expectancy. By 2010 the incidence component was negligible (slightly below zero). The disappearance of the incidence component for external causes largely reflects the fact that the black-white difference in homicide rates was, in 2010, offset by the near-tripling of accidental poisoning among whites, as well as by an increase in white suicides, with little or no increase in the incidence of either cause for blacks over the same period. Indeed, in 2010 whites were almost as likely to be victims of accidental poisoning as blacks were to be homicide victims (Appendix Table 2).
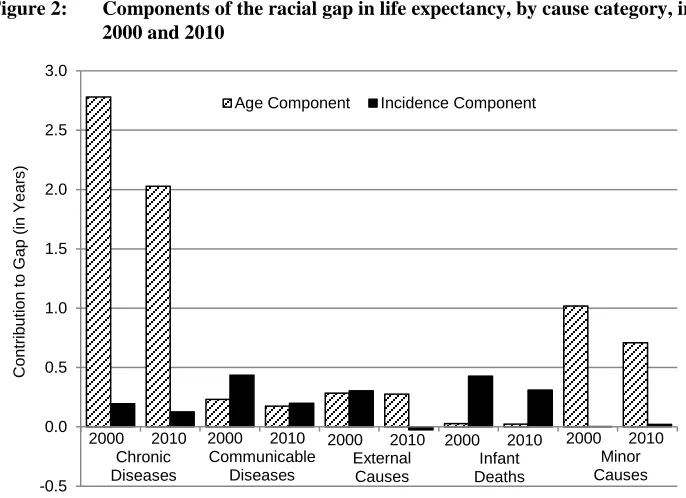
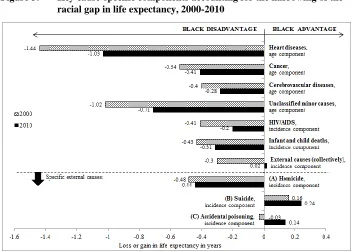
Figure 2: Components of the racial gap in life expectancy, by cause category, in 2000 and 2010
Source: Table 2
-0.5 0.0 0.5 1.0 1.5 2.0 2.5 3.0 C o n tr ibu tion t o Ga p ( in Y e a rs )
Age Component Incidence Component
2000 2010
Chronic Diseases
2000 2010
Communicable Diseases
2000 2010
External Causes
2000 2010
Infant Deaths
2000 2010
To summarize, the age component is responsible for most of the racial gap in life expectancy in both 2000 and 2010. In particular, age-at-death differences account for the major part of the longevity gap associated with chronic diseases, which includes the most common causes of death in the United States. The incidence component contributes significantly to the longevity gap in the case of infant deaths and communicable diseases in 2000 and 2010 and external causes in 2000. Based on these findings about the factors that produced the black-white gaps in life expectancy in 2000 and 2010, we can now turn to the question of what accounts for the narrowingof the longevity gap from 2000 to 2010.
6.2 Narrowing of the longevity gap: Reductions in the age component versus reductions in the incidence component
Because differences in life expectancy between groups are produced by differences in the cause-specific incidence of deaths as well as by differences in the cause-specific mean ages at death, convergence in life expectancy comes from reductions in either or both factors. The final three columns in Table 2 display the results of our decomposition of the change in the life expectancy gap from 2000 to 2010. Change in the age component of heart disease was the largest single contributor to the narrowing of the gap, accounting for 22% (0.40/1.86) of the narrowing. Although other, less frequent, causes of death – such as chronic lower respiratory diseases, diabetes, and influenza – exhibited greater reductions in the black-white difference in average age at death or age gap (Appendix Table 2), change in the agecomponent was significantly greater for heart disease because heart disease is a much more common cause of death in the United States. Change in the age component of minor causes (not elsewhere classified) accounted for another 17% of the reduction in the black-white longevity gap. Change in the incidence component of HIV/AIDS was the next largest single contributor, accounting for 11% of the narrowing of the gap. Change in the incidence component of accidental poisoning and infant deaths reduced the gap by 9% and 6%, respectively. Collectively, then, these five factors accounted for about two-thirds of the narrowing of the gap.
external causes. External causes exhibit a unique pattern in that they narrowed the longevity gap from 2000 to 2010 mainly by reducing the life expectancy for whites (bottom of Figure 3). Deaths due to external causes increased from 4.5% to 5.7% for whites while declining from 5.1% to 4.7% for blacks (Appendix Table 2). In this instance, then, the racial disparity in longevity was compressed by rising mortality for distinctively youthful causes of death among whites – certainly not the method for eliminating population health disparities envisioned in Healthy People 2010 (US Department of Health and Human Services 2000).
Figure 3: Key cause-specific components accounting for the narrowing of the racial gap in life expectancy, 2000-2010
7. Decomposition of the racial gap by cause and by sex
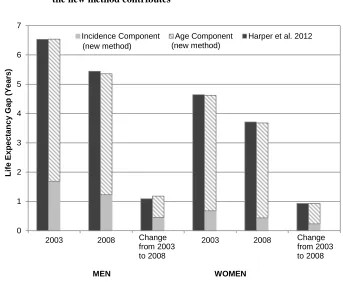
In this section we determine the cause-sex-specific contributions to the difference in life expectancies of blacks and whites. This is not to be confused with the cause-specific contributions to the differences in the life expectancy of black men versus white men, and of black women versus white women, the subject of prior investigations. Harper et al. (2012) find, for example, that heart disease accounts for 22% of the 5.4-year gap in life expectancy between black men and white men in 2008, and for 29% of the 3.7-year gap in life expectancy between black women and white women the same year. Although findings such as these add to our understanding of why white men tend to outlive black men, and why white women tend to outlive black women, they do not tell us how much of the overall black-white gap in life expectancy is attributable to specific racial differences in men’s mortality, and how much is attributable to cause-specific racial differences in women’s mortality – our objective here. By determining the sex-specific underpinnings of the overall gap we identify more precisely where advances are needed to achieve the goal of eliminating racial disparities in life expectancy.
7.1 Equations for identifying sources of the longevity gap at a point in time, by sex
To decompose the black-white longevity gap simultaneously by cause and by sex, let superscripts distinguish men and women, as follows:
Note that , the probability that a white person will die of cause c, and similarly for blacks.
The cause-specific means, ̅ and ̅ , can also be written as the sums of the
̅ ( ⁄ ) ̅ ( ⁄ ) ̅
̅ ( ⁄ ) ̅ ( ⁄ ) ̅
(Note that ⁄ and ⁄ sum to 1.0 for each cause, and similarly for blacks.) From these two equations it follows that the contribution of cause c to the longevity gap, ( ̅ ̅) ( ̅ ̅), can be partitioned into the part attributable to differences between black women and white women and the part attributable to differences between black men and white men as follows:
( ̅ ̅) ( ̅ ̅ )
( ̅ ̅) ( ̅ ̅ )
To determine the sex-specific contributions to the black-white longevity gap, we sum over the causes:
∑ ( ̅ ̅) ( ̅ ̅ ) (10)
∑ ( ̅ ̅) ( ̅ ̅) (11)
7.2 Men’s and women’s contributions to the racial gap, by cause: 2000, 2010, and change from 2000 to 2010
In this section we use the equations presented above to determine how much of the racial gap in life expectancy was generated by differences in cause-specific mortality for black men versus white men, and for black women versus white women, respectively, in 2000 and in 2010. We then use those results to separate the part of the decline in the gap due to change in the racial differences in mortality patterns for men from the part due to change in the racial differences in mortality patterns for women.
In 2000 the racial gap was generated equally by racial differences in mortality among men and among women (2.9 and 2.8 years, respectively: Table 3). However, this overall similarity masks notable cause-specific differences in the contributions of men and women. The contribution of homicide, for instance, is primarily due to racial differences in mortality for men, not women, with the difference for men accounting for 0.45 years of the total homicide contribution of 0.53 years in 2000 (the pattern is similar in 2010). This means that if black men and white men died of homicide following the same pattern, all else being constant, the overall racial gap would decrease by 0.45 years, whereas equalizing the pattern for women would reduce the gap only by 0.08 years. The pattern of mortality for HIV/AIDS is likewise more strongly racially shaped for men than for women.
Although men and women contributed equally to the racial gap in life expectancy in 2000, women made a greater contribution to the narrowingof the gap in the ensuing decade. By 2010 women’s contribution to the gap had declined by 1.1 years, while men’s contribution to the gap had declined by only 0.75 years. Changing racial patterns in chronic diseases for women reduced the overall racial gap by 0.65 years, thus accounting for over one-third of the 1.9-year overall reduction, while changing racial patterns in chronic diseases for men contributed less than 0.2 years to the reduction. Racial differences in heart disease mortality in particular declined much more for women than for men. As a result, change in the racial disparity in heart disease among women accounted for about 0.4 years of the 1.9-year decline in the longevity gap, whereas men’s heart-disease contribution was only about 0.1 years.
Table 3: Cause-specific male and female contributions to the black-white gap in life expectancy in the United States in 2000 and 2010, and change from 2000-2010 (in years)
2000 2010
Change from 2000-2010
ICD-10 cause of death Total Male Female Total Male Female Total Male Female
Chronic diseases
1 Heart diseases 1.49 0.66 0.83 1.02 0.57 0.45 -0.48 -0.09 -0.39
2 Cancers 0.53 0.25 0.28 0.41 0.20 0.21 -0.12 -0.05 -0.07
3 Cerebrovascular diseases 0.39 0.16 0.23 0.25 0.14 0.12 -0.14 -0.02 -0.11
4 Chronic lower respiratory
diseases 0.24 0.10 0.13 0.18 0.08 0.11 -0.05 -0.03 -0.03
5 Alzheimer's 0.16 0.04 0.12 0.16 0.05 0.11 0.00 0.02 -0.01
6 Diabetes 0.08 0.06 0.02 0.07 0.06 0.01 -0.02 0.00 -0.02
7 Nephritis 0.08 0.05 0.03 0.06 0.06 0.01 -0.02 0.00 -0.02
Totals for chronic diseases 2.97 1.33 1.65 2.15 1.15 1.00 -0.82 -0.17 -0.65
Communicable diseases
8 Influenza and pneumonia 0.18 0.08 0.10 0.08 0.05 0.03 -0.10 -0.03 -0.07
9 Septicemia 0.04 0.03 0.01 0.03 0.03 0.01 0.00 0.00 0.00
10 HIV/AIDS 0.40 0.26 0.14 0.20 0.13 0.08 -0.20 -0.14 -0.06
11 Other infectious diseases 0.05 0.03 0.02 0.06 0.03 0.03 0.01 0.00 0.01
Totals for communicable
diseases 0.67 0.40 0.27 0.37 0.23 0.15 -0.29 -0.17 -0.12
External causes
12 Homicide 0.53 0.45 0.08 0.50 0.45 0.06 -0.03 -0.01 -0.02
13 Suicide -0.10 -0.08 -0.03 -0.18 -0.14 -0.04 -0.08 -0.06 -0.02
14 Traffic accident 0.00 0.01 0.00 -0.01 0.00 -0.01 -0.01 -0.01 0.00
15 Accidental poisoning 0.01 0.01 0.01 -0.19 -0.13 -0.06 -0.20 -0.14 -0.07
16 Other external causes 0.14 0.07 0.07 0.13 0.06 0.07 -0.01 -0.01 0.00
Totals for external causes 0.59 0.47 0.12 0.25 0.24 0.02 -0.34 -0.23 -0.10
Infant and child conditions
17 Perinatal deaths 0.41 0.23 0.18 0.29 0.16 0.13 -0.12 -0.07 -0.05
18 Congenital anomalies 0.05 0.02 0.02 0.04 0.02 0.02 -0.01 0.00 -0.01
Totals for infant and child
conditions 0.46 0.25 0.20 0.33 0.18 0.15 -0.12 -0.07 -0.05
Aggregated minor causes
19 NEC - Not elsewhere classified 1.02 0.45 0.57 0.73 0.34 0.39 -0.29 -0.11 -0.18
In short, racial differences in mortality narrowed for virtually all major causes of death from 2000 to 2010. Although this was true for both women and men, women overall contributed more to the narrowing than men did, primarily because the convergence in the racial patterning of chronic diseases was greater among women. In the case of external causes, by contrast, there was greater convergence in the racial patterning for men than for women. Homicide contributed virtually nothing to the narrowing of the racial gap because, for both men and women, the racial patterning of homicide changed very little.
8. What is new here: Comparison with a prior study
Figure 4: Narrowing of the racial gap in life expectancy from 2003-2008: What the new method contributes
9. Discussion and conclusion
This study introduces a general method to account for group differences in life expectancy by separating the portion of the gap due to group differences in the probability of dying from given causes from the portion due to group differences in cause-specific average age at death. We use the method to determine why whites tend to outlive blacks in the United States, and why that racial difference has declined from 2000 to 2010. We find that the average age at death for whites is higher for virtually all causes of death. As a result the age component amounts to 76% of the racial gap in life expectancy in 2000 and to 84% of the gap in 2010. The remainder of the gap is attributable to racial differences in the probability of dying from specific causes of
0 1 2 3 4 5 6 7
2003 2008 2003 2008
Li
fe
E
x
pec
ta
ncy
Ga
p
(Y
e
a
rs
)
Incidence Component Age Component Harper et al. 2012
MEN WOMEN
(new method) (new method)
Change from 2003 to 2008
death, which we call the incidence component. In contrast to our results for the cause-specific age components, we find significant offsetting effects for the cause-cause-specific incidence components. In particular, racial differences in the incidence of HIV/AIDS, homicide, and perinatal deaths widen the racial gap in life expectancy, whereas racial differences in the incidence of suicide narrow the gap. Racial differences in accidental poisoning also narrow the gap, but only in 2010.
Blacks’ life expectancy increased faster than whites’ life expectancy from 2000 to 2010 largely because gains in years of life expectancy were greater for blacks for nearly all chronic diseases, the most prevalent causes of death in the United States. As a result, 60% of the narrowingof the longevity gap was attributable to the age component, with black-white age differences declining for three leading causes of death (heart disease, cancer, and cerebrovascular disease) as well as for minor causes of death not elsewhere classified. The remaining 40% of the reduction in the life expectancy gap was associated with change in the distribution of the causes of death among blacks and whites. In this case, heart disease and other types of chronic disease played only a minor role: the reduction in the incidence component instead was produced almost entirely by greater declines among blacks (than whites) in HIV/AIDS and in perinatal deaths, and by the near-tripling of deaths due to accidental poisoning among whites. Although homicide is a significant contributor to the racial gap in life expectancy in the United States, it contributed very little to the narrowing of the racial gap from 2000 to 2010 because the racial patterning of homicide changed very little over this decade.
For most major causes of death, racial differences in mortality narrowed from 2000 to 2010 for both women and men. Women, however, contributed more to the narrowing of the racial gap because of greater convergence in their racial patterning of chronic diseases. The effect of this trend on the gap in life expectancy was particularly amplified because chronic diseases account for the large majority of all deaths.
disaggregating a particular cause category further would not affect results for the other causes.
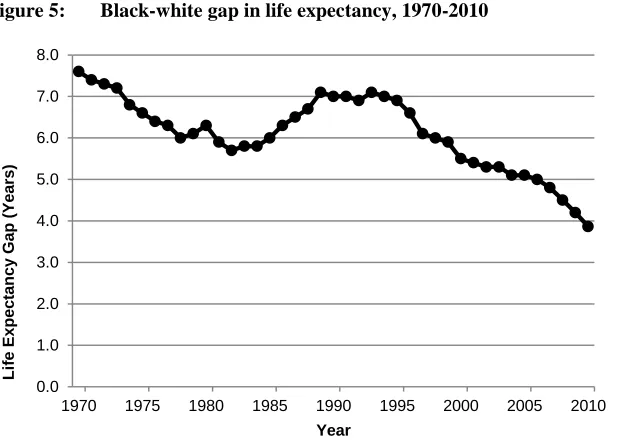
Our study has implications for policy and for future research. With regard to research, the method developed here can be used in subsequent studies to shed light on the factors producing longevity gaps between countries as well as between demographic or socioeconomic groups within countries. The method could also be applied to the racial longevity gap in the United States over a longer span of time. The time period we analyzed in this study is strategic because it corresponds to an initiative in the United States to eliminate racial health disparities (U.S. Department of Health and Human Services 2000). The analysis could be pushed back in time, however, because official life tables by cause of death have been available for the United States since the late 1960s (U.S. Department of Health, Education and Welfare 1968). As Figure 5 shows, the trend in the racial life expectancy gap in the United States has been erratic over the past 40 years, declining in the 1970s, rising in the 1980s, and then declining again from the mid-1990s. The method described in this paper could be used to determine the reasons for this undulating trend.
Figure 5: Black-white gap in life expectancy, 1970-2010
Source: CDC/NCHS, National Vital Statistics System (1970-2008 reported in Arias 2012). Life expectancies for 2009 and 2010 calculated from the CDC/NCHS data.
0.0 1.0 2.0 3.0 4.0 5.0 6.0 7.0 8.0
2010 2005 2000 1995 1990 1985 1980 1975 1970
Li
fe
E
x
pec
ta
ncy
Ga
p
(Y
e
a
rs
)
Our study also bears on policy. By clarifying the factors behind the racial gap in life expectancy in the United States at two points in time, we identify where significant advances have been made with respect to the goal of eliminating racial disparities in life expectancy, reveal places where advances still need to be made to achieve the goal, and inform policy regarding the most strategic targets for intervention to reduce disparities. Consider the implications of our findings for heart disease, for example. The incidence component is negligible, indicating that blacks and whites are equally likely to succumb to heart disease. Heart disease nonetheless accounts for about one-fourth of the racial gap in life expectancy in 2010 because black victims tend to be younger than white victims. Together, these findings point to policy interventions focusing on identifying heart disease and equalizing treatment of those with heart disease. Indeed, for chronic diseases in general – including cancers, cerebrovascular diseases, Alzheimer’s, diabetes, and nephritis – the age component dominates, indicating that treatment may be important in reducing disparities. In the case of HIV/AIDS, by contrast, the racial gap is driven by differences in incidence, not age at death. In that case prevention is the key to reducing disparities.
In short, by isolating the age and incidence components for principal causes of death, we are in a better position to determine where policy interventions are likely to have the greatest payoff for narrowing racial differences in life expectancy. One thing is clear: continued reductions in the black-white longevity gap are unlikely to come about automatically, but will require conscious effort, informed by an understanding of the sources of the gap. The methodology and results of this study are designed to further that understanding.
10. Acknowledgements
References
Andreev, E. (1982). Metod komponent v analize prodoljitelnosty zjizni. [The method of components in the analysis of length of life]. Vestnik Statistiki 3(9): 42–47. Andreev, E., Shkolnikov, V.M., and Begun, A.Z. (2002). Algorithm for decomposition
of differences between aggregate demographic measures and its application to life expectancies, healthy life expectancies, parity progression ratios and total fertility rates. Demographic Research 7(14): 499–522. doi:10.4054/DemRes. 2002.7.14.
Arias, E. (2012). United States life tables, 2008. National Vital Statistics Report 61(3): 1–63.
Arriaga, E. (1984). Measuring and explaining the change in life expectancies.
Demography 21(1): 83–96. doi:10.2307/2061029.
Beltrán-Sánchez, H., Preston, S.H., and Canudas-Romo, V. (2008). An integrated approach to cause-of-death analysis: Cause-deleted life tables and decompositions of life expectancy. Demographic Research 19(35): 1323‒1350.
doi: 10.4054/DemRes.2008.19.35.
Carey, J.R. (1989). The multiple decrement life table: a unifying framework for cause– of-death analysis in ecology. Oecologia 78(1): 131–137. doi:10.1007/ BF00377208.
Das Gupta, P. (1993). Standardization and decomposition of rates: A user's manual. Washington, D.C.: U.S. Bureau of the Census (Current Population Reports). Franzini, L., Ribble, J.C., and Keddie, A.M. (2001). Understanding the Hispanic
paradox. Ethnicity and Disease 11(3): 496–518.
Harper, S., Lynch, J., Burris, S., and Smith, G.D. (2007). Trends in the black-white life expectancy gap in the United States, 1983–2003. Journal of the American Medical Association 297(11): 1224–1232. doi:10.1001/jama.297.11.1224. Harper, S., Rushani, D., and Kaufman, J.S. (2012). Trends in the black-white life
expectancy gap, 2003–2008. Journal of the American Medical Association
307(21): 2257–2259. doi:10.1001/jama.2012.5059.
Heron, M.P., Hoyert, D.L., Murphy, S.L., Xu, J.Q., Kochanek, K.D., and Tejada-Vera, B. (2009). Deaths: Final data for 2006. in National Vital Statistics Reports
Israel, R.A., Rosenberg, H.M., and Curtin, L.R. (1986). Analytical potential for multiple cause-of-death data. American Journal of Epidemiology 124(2): 161– 179.
Keyfitz, N. (1985). Applied Mathematical Demography. New York: Springer-Verlag.
doi:10.1007/978-1-4757-1879-9.
Kitagawa, E.M. (1955). Components of a Difference Between Two Rates. Journal of the American Statistical Association 50(272):1168–1194.
Kitagawa, E.M. (1964). Standardized comparisons in population research. Demography
1(1): 296–315. doi:10.1007/BF03208469.
Kochanek, K.D., Arias, E., and Anderson, R.N. (2013). How did cause of death contribute to racial differences in life expectancy in the United States in 2010?. Hyattsville, MD: National Center for Health Statistics (NCHS Data Brief, No. 125).
National Center for Health Statistics (NCHS). (2007). Multiple Cause of Death File 1999–2004. Washington, D.C.
National Center for Health Statistics (NCHS). (2012). Multiple Cause of Death File 2010. Washington, D.C.
Nau, C. and Firebaugh, G. (2012). A new method for determining why length of life is more unequal in some population than in others. Demography 49(4):1207–1230.
doi:10.1007/s13524-012-0133-9.
Newman S.C. (1987). Formulae for cause-deleted life tables. Statistics in Medicine
6(4): 527–528. doi:10.1002/sim.4780060411.
Noymer, A., Penner, A.M., and Saperstein, A. (2011). Cause of death affects racial classification on death certificates. PloS ONE 6(1): e15812. doi:10.1371/journal. pone.0015812.
Pollard, J. H. (1982). The expectation of life and its relationship to mortality. Journal of Institute of Actuaries 109(2): 225–240. doi:10.1017/S0020268100036258. Pressat, R. (1985). Contribution des Écarts de mortalité par Âge à la différence des vies
moyennes. Population 40(4–5): 765–770. doi:10.2307/1532986.
US Department of Health, Education, and Welfare. (1968). United States Life Tables by Causes of Death: 1959–1961. (Life Tables: 1959–61). Washington, D.C.: U.S. Government Printing Office.
US Department of Health and Human Services. (2000). Healthy People 2010 Health Objectives. Washington, D.C.
Vaupel, J.W. and Canudas-Romo, V. (2002). Decomposing demographic change into direct vs. compositional components. Demographic Research 7(1): 1–14. doi:10. 4054/DemRes.2002.7.1.
Vaupel, J.W. and Canudas-Romo, V. (2003). Decomposing change in life expectancy: A bouquet of formulas in honor of Nathan Keyfitz’s 90th birthday. Demography
40(2): 201–216. doi:10.1353/dem.2003.0018.
Warner, M., Chen, L.H., Makuc, D.M., Anderson, R.N., and Miniño, A.M. (2011). Drug poisoning deaths in the United States, 1980–2008. NCHS Data Brief 81: 1–8.
Wong, M.D., Shapiro, M.F., Boscardin, W.J., and Ettner, S.L. (2002). Contribution of major diseases to disparities in mortality. New England Journal of Medicine
347(20): 1585–1592. doi:10.1056/NEJMsa012979.
Appendix
Table A1: Cause-grouping and corresponding ICD-10 codes
ICD 10 Cause grouping
19- Category Cause-Group
ICD10 4 digit code range
Contents of Cause-group
(described using ICD10 cause description)
(1) Chronic diseases
Heart diseases I00-I09.9 I11-I11.9 I13-I13.9 I20-I25.9 I26-I28.9
I30-I51.9
Acute rheumatic fever, chronic rheumatic heart disease Hypertensive heart disease
Hypertensive heart and renal disease Ischemic heart disease
Pulmonary heart disease and diseases of pulmonary circulation
Other forms of heart disease
Cancers C00-D48.9 Neoplasms
Cerebrovascular diseases
I60-I69.8 Cerebrovascular diseases
Chronic lower respiratory diseases
J40-J47 Chronic lower respiratory diseases
Alzheimer’s G30-G30.9 Alzheimer’s disease
Diabetes E10-E14.9 Diabetes mellitus
Nephritis, Nephrosis, Nephrotic Symptom
N00-N07.9 N17-N19 N25-N27.9
Nephritis, Nephrosis, Nephrotic Symptom
(2) Communicable diseases
Influenza and pneumonia
J10-J18.9 Influenza and pneumonia
Septicemia A40-A41.9 Streptococcal and other septicemia
HIV/AIDS B20-B24.9 HIV disease
Other Infectious Diseases
A00-B99 Certain infectious and parasitic diseases,
with the exception of septicemia and STD/NTD
(3) External causes
Homicide X85-Y09.9 Assault
Suicide X60-X84.9 X60-X69 X70-X78 X80-X82
X83-X84.9
Suicide
Intentional self-poisoning by drugs and alcohol Intentional self-harm by suffocation and by objects Intentional self-harm by jumping or lying before moving objects
Table A1: (Continued)
ICD 10 Cause grouping
19- Category Cause-Group
ICD10 4 digit code range
Contents of Cause-group
(described using ICD10 cause description)
(3) External causes
Traffic Accidents V02-V04.9 V09-V09.9
V12-V14.9
V19-V19.9
V20-V79.9
V80-V89.9
Pedestrian injured in accident with motor vehicle Pedestrian injured in other and unspecified transport accidents
Pedal cyclist injured in accident with motor vehicle, Pedal cyclist injured in unspecified transport/traffic accident Motor-cyclist, occupant of three-wheeled vehicle, car occupant, occupant of pick-up truck, occupant of heavy transport vehicle, or bus occupant injured in transport accident
Other land transport accidents
Accidental poisoning X40-X49.9, Y10-Y19.9
Accidental poisoning by drugs and alcohol
Poisoning by drugs and alcohol, undetermined intent
Other External Causes Remaining codes V01-V01.9, V90-Y89.9 excluding assault
External causes of morbidity and mortality, with exception of assault
(4) Infant and child conditions
Perinatal deaths P00-P96 Conditions originating in the perinatal period
Congenital Anomalies Q00-Q99 Conditions originating from congenital absence or malformation
(5) Aggregated minor causes (not elsewhere classified)
NEC – Not elsewhere classified
All codes not listed above
Examples:
F1-F 19.9 - Different types of dementia/mental disorder F20-F48 - Other mental disorders including
Table A2: Probability of death, and average age at death, for 19 causes of death: Blacks versus whites in 2000 and 2010a
Probability in 2000 Mean Age in 2000 Probability in 2010 Mean Age in 2010 ICD-10 cause of death White Black Diff White Black Diff White Black Diff White Black Diff Chronic diseases
1 Heart diseases 0.314 0.299 0.015 80.4 75.7 4.7 0.255 0.260 -0.004 81.3 77.3 4.0 2 Cancers 0.230 0.226 0.004 73.7 71.4 2.4 0.224 0.224 0.000 75.3 73.5 1.8 3 Cerebrovascular diseases 0.075 0.076 -0.001 82.4 77.1 5.3 0.056 0.062 -0.006 82.8 78.1 4.8 4 Chronic lower respiratory
diseases 0.057 0.029 0.028 78.3 74.2 4.1 0.063 0.033 0.030 79.6 77.1 2.4 5 Alzheimer's 0.026 0.013 0.013 85.9 85.2 0.7 0.043 0.029 0.014 86.8 86.5 0.2 6 Diabetes 0.025 0.045 -0.020 76.2 73.4 2.8 0.023 0.043 -0.020 77.1 75.2 2.0 7 Nephritis, nephrosis, nephrotic
symptoms 0.015 0.026 -0.011 80.4 74.6 5.8 0.020 0.034 -0.014 81.8 77.6 4.2 Total probability, chronic
diseases 0.741 0.713 0.027 0.685 0.686 0.000 Communicable diseases
8 Influenza and pneumonia 0.030 0.024 0.006 83.4 78.2 5.1 0.022 0.020 0.002 82.9 79.6 3.3 9 Septicemia 0.012 0.022 -0.010 78.7 75.0 3.7 0.013 0.022 -0.009 78.6 76.2 2.4 10 HIV/AIDS 0.002 0.016 -0.014 45.0 45.6 -0.6 0.001 0.009 -0.008 51.2 50.9 0.3 11 Other infectious diseases 0.004 0.006 -0.002 69.4 62.9 6.6 0.009 0.008 0.000 75.7 68.7 7.0
Total probability, communicable 0.048 0.068 -0.020 0.045 0.060 -0.015 External causes
12 Homicide 0.002 0.015 -0.012 39.5 32.6 6.9 0.002 0.013 -0.011 40.5 32.2 8.3 13 Suicide 0.010 0.004 0.006 50.0 41.9 8.1 0.012 0.004 0.008 50.0 42.4 7.6 14 Traffic accident 0.013 0.012 0.001 45.5 43.0 2.5 0.010 0.009 0.001 48.2 45.3 2.9 15 Accidental poisoning 0.004 0.005 -0.001 42.4 46.0 -3.6 0.011 0.006 0.004 42.4 49.0 -6.6 16 Other external causes 0.017 0.015 0.002 69.9 60.4 9.5 0.023 0.015 0.008 74.3 64.8 9.5
Total probability, external causes 0.045 0.051 -0.005 0.057 0.047 0.010 Infant deaths
17 Perinatal Deaths 0.003 0.008 -0.006 0.6 0.6 0.1 0.002 0.006 -0.004 0.7 0.6 0.2 18 Congenital Anomalies 0.003 0.003 0.000 27.6 18.8 8.7 0.003 0.003 0.000 27.5 19.6 7.9
Total probability, infant deaths 0.006 0.012 -0.006 0.005 0.009 -0.004 Aggregated minor causes
19 NEC - Not elsewhere classified 0.160 0.156 0.004 78.0 71.6 6.4 0.208 0.198 0.009 80.3 76.8 3.5 Overall 1.000 1.000 0.000 77.0 71.3 5.7 1.000 1.000 0.000 78.1 74.3 3.8
a