Esmaeel Abdollahzadeh
Iran University of Science and Technology [email protected]
Fateme Zolfaghari
Iran University of Science and Technology [email protected]
Abstract
This study compared 2 main approaches to readability assessment. The quantitative approach applied idea density based on part of speech tagging and compared 3 sets of text types (i.e., narrative, expository, and argumentative) with respect to their ease of reading. The qualitative approach was done through developing questionnaires measuring intermediate EFL learners’ perceptions on content, motivation, quality of language, and format of the same text types. The quantitative results indicated significant differences between narrative and argumentative as well as between narrative and expository text types in terms of idea density. In other words, argumentative and expository texts were more readable than narrative ones. Significantly, higher perceived readability for argumentative and lower perceived easiness of expository texts were reported by the participants. It was found that the argumentative texts are more readable than their narrative counterparts. This finding was supported by both qualitative and quantitative approaches to readability assessment. The results indicate that there needs to be a reconsideration of different readability approaches in the selection of texts for their intended readers. Implications for writing instruction and research on readability will be discussed.
Keywords:Readability; Idea Density; Qualitative Readability Assessment;
1. Introduction
Concerns for increasing the readability indices of teaching materials and matching them to proficiency levels of their intended readers have made researchers plod on in spite of the existence of many intervening variables affecting the readabilities of the produced texts. In fact, in every profession, readability can be a determining factor. For example, the sick need to understand the way they have to use their medicines so that they are not hurt. Similarly, businessmen who need to sell their products to other countries should follow the readability standards for the documents that they attach to the products. No doubt, writers of every profession should consider readability at the center of their attention (Marnell, 2008).
According to McLaughlin (1968), the prediction of readability has two main advantages: First, it helps gain special knowledge to decide on the number of people who can be the readers of a special style, and it aids teachers to select appropriate books for their students. Second, readability helps authors to understand the extent to which their writings are suitable for their intended readers.
Different methods and definitions of readability have been proposed. DuBay (2004) defines readability as what makes a text easier to read. Oosten, Hoste and Tanghe (2011) define it as the degree of easiness on the part of its addressee to understand its message. Oosten et al. (2011) believe that the concept of readability is subjective in nature, and the easiness with which a reader can understand a text depends on his or her background knowledge more than anything else.
Readability studies aim to find the right fit between difficulty levels of the texts and reading abilities of the students (Ulusoy, 2006). Ulusoy refers to the differences among students in terms of experiences and background knowledge about the contents of their course books. Hence, he emphasizes that the aim of readability is to find something that is the most suitable.
Quantitative assessments of readability are those methods that use some formulae. Oakland and Lane (2004) believe that most of these formulae depend on two qualities that can be measured quantitatively: vocabulary and syntax. Vocabulary can be assessed by considering the amount of familiarity with the words, or the number of letters and syllables in a word. Syntax is usually assessed by considering the length and complexity of the sentences and paragraphs. In their view, using readability formulae, a level of difficulty will be assigned for each text based on which appropriate level of reading material for a test or a specific learner can be decided. Davison and Kantor (1982) believe that formulae not only measure the text difficulty but also are helpful in the production of texts that meet some specific readability levels. Although very useful, the readability formulae are not free from shortcomings. Carrell (1987) believes that readability formulae have two main shortcomings. On one hand, they ignore some textual features such as syntactic complexity, textual cohesion, propositional density, and rhetorical structure of the text. On the other hand, they ignore reader variables such as background knowledge. These formulae ignore the interactive nature of the relationship between readers and texts, the fit between various features of the text such as its rhetorical organization, its content, the perspective of the text and readers’ schemata on content and rhetorical organization of the texts, the readers’ background knowledge, experiences, and beliefs. These issues are very important, especially when the culture of the readers is different from the culture in which the text comes from.
difficulty which is perceived and the interest factors cannot be considered by readability formulae. Additionally, most of the traditional readability formulae consider only sentence length and vocabulary familiarity and thus, ignore those features of the texts which are essential in determining the difficulty levels of texts (Davison & Kantor, 1982). Due to these shortcomings, quantitative readability assessment is either replaced or implemented with its qualitative counterpart.
Oakland and Lane (2004) posit that some of the factors that can affect the readability of texts cannot be measured through the use of readability formulae (i.e., quantitative methods of assessing readability). The reason is that these methods have limited scope and may create low reliability and validity. For these reasons, the qualitative methods are used to assess some subjective factors such as cognitive aspects and idea densities that can affect the learners’ abilities to read.
Ulusoy (2006) maintains that quantitative approaches to readability employ some techniques including cloze tests, checklists, and scales, but qualitative approaches use leveling and checklists. He refers to the combination of qualitative and quantitative approaches that uses benchmark passages and checklists. Quantitative approaches are criticized because of too much attention to the surface features of the text. However, even qualitative methods are also criticized because of their subjectivity.
examining the reading paces of different discourse modes. This formula does not solely rely on word count; rather, sentence and syllable length is one of the distinguishing features of this formula. Further, it takes into account issues such as coherence and cohesion which could not be assessed using the previous formula which relied on syntax and lexis.
Different text types focus the receiver’s attention on different aspects of the communicative situation and are related to different mental activities. Expository text type involves analysis and synthesis of concepts. In such texts, a certain degree of evaluativeness is common, “...diction is fairly emotive, metaphoric expression is not a rarity and a general feel of semi-formality is allowed” (Hatim & Mason, 1990, p. 191). As Weaver and Kintsch (1991) argue, expositions can be analyzed in terms of their basic procedure: analysis (taking a concept and working out its constituent elements) or synthesis (taking the constituent elements of a complex concept and working out a shorter formulation for it).
In argumentative texts, the need to persuade through evaluation is paramount with a predominance of emotive diction, metaphoric expression, and subtle uses of modality (Hatim & Mason, 1990). In such texts, “text forms have a special character and the ordering must reflect a move from the less to the more evaluative” (Hatim & Mason.1990, p.193). Tirkonnen-Condit (1994) views the production of argumentative text as the cognitive process of problem-solving involving the following structural units: situation, problem, solution, and evaluation. Argumentative texts deal with the mental process of judging. All argumentative texts promote or evaluate certain beliefs or ideas with conceptual relations such a reason, significance, or opposition frequently.
Golding, & Long, 1991). Narrative texts focus on persons, objects, and relations in time (i.e., mental process of perception in time).
In L2, many reading researchers have emphasized the need to study the differential contribution of text-based characteristics such as genre, text structure parameters, and text type to comprehension (Camiciottoli, 2003; Carrell, 1987). Research is also scarce on lexical and propositional density of information in a text, how ideas are divided in a text, the storyline or flow of arguments in a text, and their impact on text difficulty (Leroy, Helmreich, & Cowie, 2010). This study aimed to examine the impact of the cognitive and rhetorical structure of the texts on the reader’s perceptions difficulty. Meanwhile, reader s’ perceptions of difficulty of different text types were compared with the difficulty measure of the same texts obtained through a quantitative measure of difficulty (i.e., propositional density). Such an investigation can pave the way for studies aiming to find more detailed criteria for text selection and materials development. Further, if we could find a close fit between more appropriate quantitative and qualitative measures of readability, then it can help us develop more scalable solutions and a readability gold standard. Therefore, the following questions were investigated in this study:
1. Does the quantitative measurement of readability match the perceptions of EFL learners about the difficulty levels of the texts?
2. Are there any significant differences among expository, argumentative, and narrative texts in terms of readability indexes?
2. Method
2.1 Participants
into three groups of 60 students to answer questionnaires concerning the readability of narrative, expository and argumentative text types.
2.2 Instruments
The instruments employed for conducting the present study were CPIDR software (version 3. 2. 2785. 24603), three sets of questionnaires, and 33 texts.
CPIDR is a computer application whose input is copy-pasted or typed document and calculates the number of propositions (based on part of speech tagging based on Liu’s, 2004 definition) and the idea densities (as the readability measures) of texts. This software was developed by Brown, Snodgrass, Kemper, Herman, and Covington (2008, p. 540) which was “tested against human raters, with the consensus of two human raters better than the team of five raters agree with each other (r(80) = 0.97 vs. r(10) = 0.82, respectively.”
Further, three sets of questionnaires were designed by the researchers with some adaptations from the questionnaire used in a study by Inegbedion (2009). The first part of the questionnaires included demographic questions on age, degree, and field of study of the participants and their perceived English language proficiency. The second part of each questionnaire included two texts representing a particular text type and 31 items, 8 of which measured learner perceptions on content, 2 format, 10 quality of language and the remaining 11 items motivation constructs (see the Appendix).
propositions. Table 1 provides a summary of the features of the texts included in each questionnaire:
Table 1. Features of the Texts Included in Each Type of Questionnaire Number of
Propositions
Number of Words
Idea Density Argumentative Questionnaire
Text 1: 228 423 0.53
Text 2: 200 375 0.53
Expository Questionnaire Text 1:
224 401 0.55
Text 2: 230 413 0.55
Narrative Questionnaire Text 1:
128 245 0.52
Text 2: 139 252 0.55
Finally, to compare the readability levels of the three text types, 33 texts were selected for analysis representing three different types (11 argumentative, 11 expository, and 11 narrative texts). They were selected based on two main criteria. The first criterion was the discourse mode that the texts represented (i.e., text type), and the second criterion was their number of propositions so that they were comparable. The texts were read and analyzed in terms of the prominent features and purposes, and those which met the discourse mode criterion and range of propositions (between 249 and 299) were considered for the study. Table 2 summarizes the features of the selected texts for the study:
Table 2. Features of the Texts Used in the Study
Text Type Number of Propositions
Idea Density
Number of Words A1
A2 A3 A4 A5 A6 A7 A8 A9
272 264 281 294 296 249 286 268 264
0.486 0.483 0.491 0.483 0.55 0.486 0.519 0.46 0.512
Note: A: argumentative text type; E: expository text type; N: narrative text type 2.3 Procedure
The data collection consisted of three parts: selection of appropriate texts, readability rating of the selected text types based on idea density, and designing questionnaires to get information on the learners’ perceptions of the difficulty of each text type. Therefore, this study followed a combination of quantitative and descriptive approaches.
To select appropriate texts, a large sample of texts geared to the level of the participants was selected. Then, they were screened and analyzed with reference to the features related to each text type. Finally, the most representative texts were selected for analysis. The format and presentation of all the selected passages were kept constant. Trying not to manipulate the structures of the texts, the researchers
analyzed a sample of different texts including those in hard copy and in digital format and then comparable texts within the range of 249 to 299 propositions were selected. The propositions were counted based on the definition provided by Liu (2004) applying the CPIDR software (version 3. 2. 2785. 24603).
The readability indices of the text types (i.e., expository, argumentative, and narrative types) were determined through a combination of quantitative and qualitative readability approaches. The quantitative analysis involved employing idea density formula which had been operationalized in the CPIDR application. On the other hand, because readability has to do with the interaction of readers and texts, the readers could not be ignored. Therefore, the questionnaires as one of the qualitative readability instruments were developed and piloted with 21 EFL learners similar to those in the main study. The aims of these questionnaires were to ascertain the learners’ perceptions about the readability of the comparable text types. Thus, each questionnaire type was administered to seven EFL learners to discover the intelligibility, appropriateness, wording, topic familiarity, and other problems that the learners potentially had while answering them. Overall, Cronbach’s alpha reliability of 0.88 was obtained as a representative of the internal consistencies of the items applicable for the three types of questionnaires.
The developed questionnaires were administered to 180 EFL learners (60 participants answered each questionnaire type). The participants were briefed on how to answer the background questions, read the two texts included in each of the questionnaires, and answer the questions regarding the four abovementioned constructs (i.e., content, format, motivation, and quality of language) with reference to each text type ( see the Appendix). The response format of the questions was of close-ended 5-point Likert scale: 5 (strongly agree) and 1 (strongly disagree). The average time for answering the questions was set at 20 min for each group.
level of the focused texts in the three sets of questionnaires were also compared using Kruscall Wallis test.
3. Results
To compare the perceptions of the participants on the difficulty levels of the three focused text types, Kruscall Wallis test was run. Table 3 is a summary of the results obtained from each set of the questionnaires and their related items. The overall significant differences in perceptions across text types are also presented in the last column:
Quality of Language Item 5 Item 10 Item 11 Item 18 Item 20 Item 22 Item 26 Item 28 Item 29 Item 31 115.03 100.38 111.58 126.01 83.67 108.95 108.46 86.53 103.06 107.36 67.23 70.85 79.12 59.47 93.65 85.58 69.44 92.60 70.53 91.53 89.23 100.28 80.80 86.03 94.18 76.97 93.60 92.38 97.92 72.62 28.598 14.600 18.159 56.660 1.996 13.996 19.520 .596 15.820 16.112 .000 .001 .000 .000 .369 .001 .000 .742 .000 .000 Motivation Item 2 Item 3 Item 4 Item 6 Item 8 Item 13 Item 14 Item 15 Item 16 Item 23 Item 27 116.67 96.22 90.47 89.73 93.55 97.94 89.16 94.31 90.87 102.90 91.23 64.46 83.78 93.12 84.57 77.91 78.94 93.03 76.86 82.42 59.99 83.94 90.38 91.51 87.92 97.20 100.04 94.62 89.32 100.33 98.22 108.61 96.33 32.958 1.889 .332 1.920 6.218 4.962 .242 7.118 3.036 36.141 1.890 .000 .389 .847 .383 .045 .084 .886 .028 .219 .000 .389
In terms of content, the responses of the participants showed significant differences among the three text types (i.e., argumentative, expository, and narrative) in terms of consistency of language selection with the content, logical sequencing of contents, the relatedness of information to the contents of texts, lucidity of content, up-to-datedness and accuracy of the given information, and sequence of ideas and arguments.
In terms of format, the three text types were perceived to be significantly different in terms of representativeness of the titles.
With respect to motivation, the text types were perceived significantly different in terms of the readers’ perceptions of their strength while reading the texts, the participants’ perceived interests in the texts, the time they spent for reading the texts, and the readers’ visualizations while reading the texts.
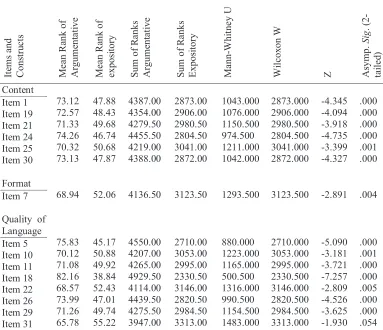
Mann-Whitney U tests were performed across each pairs of text types as post hoc analyses of the significant differences in each of the constructs under investigation to understand exact points of difference. Therefore, comparison of the learners’ perceptions on the readability of expository and argumentative texts is shown in Table 4:
Table 4. Mann Whitney U Test Between Argumentative and Expository Questionnaires It em s and Cons tru ct s M ea n Ra nk of A rgum ent at ive M ea n R ank of ex p os it ory S um of R anks A rgum ent at ive S um of R anks E x p os it ory M ann -W hi tne y U W il cox on W
Z Asym
p . Si g . (2 -ta il ed ) Content Item 1 Item 19 Item 21 Item 24 Item 25 Item 30 73.12 72.57 71.33 74.26 70.32 73.13 47.88 48.43 49.68 46.74 50.68 47.87 4387.00 4354.00 4279.50 4455.50 4219.00 4388.00 2873.00 2906.00 2980.50 2804.50 3041.00 2872.00 1043.000 1076.000 1150.500 974.500 1211.000 1042.000 2873.000 2906.000 2980.500 2804.500 3041.000 2872.000 -4.345 -4.094 -3.918 -4.735 -3.399 -4.327 .000 .000 .000 .000 .001 .000 Format
Item 7 68.94 52.06 4136.50 3123.50 1293.500 3123.500 -2.891 .004
Motivation Item 2 Item 8 Item 15 Item 23
78.13 65.88 66.46 75.36
42.87 55.13 54.54 45.64
4688.00 3952.50 3987.50 4521.50
2572.00 3307.50 3272.50 2738.50
742.000 1477.500 1442.500 908.500
2572.000 3307.500 3272.500 2738.500
-5.806 -1.765 -1.950 -4.993
.000 .078 .051 .000
The expository and argumentative text types were perceived to be significantly different in all the items related to content. The mean ranks of all the items in the argumentative texts were higher than those for the expository texts. This verifies the higher perceived readabilities of the argumentative texts than their expository counterparts for the readers. The argumentative texts were perceived to have better match of content and language. In the same vein, argumentative texts were perceived to have more logical sequencing of contents (item 19), more provision of relevant information in content (item 21), more lucid content (item 24), more up-to-date and accurate information (item 25), and more consideration of idea and argument sequencing (item 30).
Considering format, the significantly higher mean rank of the argumentative texts indicated that they were perceived to be more readable. Also, it was understood that the titles of the argumentative texts in terms of representation were perceived to be better than those for the expository texts.
increase the readability of the texts in terms of quality of language, it can be concluded that the argumentative texts were qualitatively more readable than the expository ones.
In terms of motivation, significant differences between the argumentative and expository text types were found. This means that concerning the argumentative texts, the readers thought they were better readers compared with their readings of the expository texts (item 2), were more interested in reading the texts (item 15), and had better visualization of the argumentative texts than the expository ones (item 23). In fact, better visualization of the texts and being more able to read the texts increase the easiness of the texts. In this regard, the argumentative texts had higher readability than the expository ones.
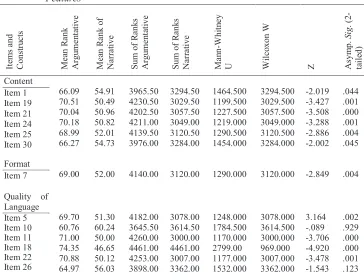
Table 5 shows the results of the second Mann Whitney analysis comparing reader perceptions on argumentative and narrative text types:
Table 5. Mann Whitney U Test Between Argumentative and Narrative Features It em s and C ons tr u ct s M ea n R ank A rgu m en ta ti ve M ea n R ank o f N ar ra ti ve S um o f R ank s A rgu m en ta ti ve S um o f R ank s N ar ra ti ve M an n -W hi tn ey U W il co xon W
Z Asym
p . S ig . (2 -ta il ed) Content Item 1 Item 19 Item 21 Item 24 Item 25 Item 30 66.09 70.51 70.04 70.18 68.99 66.27 54.91 50.49 50.96 50.82 52.01 54.73 3965.50 4230.50 4202.50 4211.00 4139.50 3976.00 3294.50 3029.50 3057.50 3049.00 3120.50 3284.00 1464.500 1199.500 1227.500 1219.000 1290.500 1454.000 3294.500 3029.500 3057.500 3049.000 3120.500 3284.000 -2.019 -3.427 -3.508 -3.288 -2.886 -2.002 .044 .001 .000 .001 .004 .045 Format
Item 7 69.00 52.00 4140.00 3120.00 1290.000 3120.000 -2.849 .004
The results show that the mean ranks of the argumentative texts are significantly higher than those for the narrative texts meaning that compared with the narrative texts, the argumentative texts were perceived to have higher match of language and content (item 1), more logical sequence of content (item 19), more inclusion of relevant information in content (item 21), clearer content (item 24), more up-to-date and accurate information (item 25), and more consideration of idea and argument sequencing (item 30).
As to format, a significant difference between the perceptions of the participants on the well-representation of the titles of the argumentative and narrative texts in the questionnaires was found. This indicates that the titles of the argumentative texts were perceived to have significantly more understandable than those of the narrative texts.
In terms of quality of language, the comparisons showed significant differences between the narrative and argumentative text types. It means that compared with the narrative texts, the argumentative texts were perceived to have clearer language (item 5), more tense consistency (item 11), better match between the language of the texts to the linguistic abilities of the learners (item 18), less gender sensitivity of language (item 22), and more adequate paragraphing.
In terms of motivation, the mean rank of the argumentative text type was more than that for the narrative text type meaning that the readers thought they were better readers of the argumentative texts than the narrative ones (item 2).
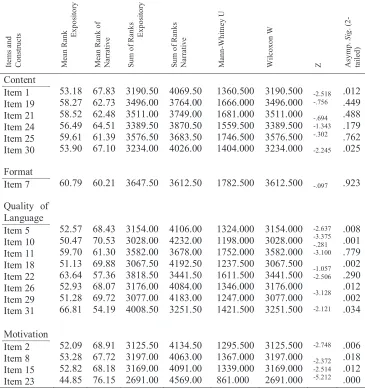
Table 6 represents the results of the third Mann Whitney analysis on the difference in perceptions on the features of the expository and narrative text types: Item 29
Item 31
62.30 72.08
58.70 48.93
3738.00 4324.50
3522.00 2935.50
1692.000 1105.500
3522.000 2935.500
-.625 -3.983
.532 .000 Motivation
Item 2 Item 8 Item 15 Item 23
69.03 58.18 58.35 58.04
51.97 62.83 62.65 62.96
4142.00 3490.50 3501.00 3482.50
3118.00 3769.50 3759.00 3777.50
1288.000 1660.500 1671.000 1652.500
3118.000 3490.500 3501.000 3482.500
-2.875 -.765 -.710 -.867
Table 6. Mann Whitney U Test Between Expository and Narrative Questionnaires It em s a n d Co n st ru c ts M ea n Ra n
k Exp
o si to ry M ea n Ra n k o f N a rra ti v e S u m o f Ra n k s E x p o si to ry S u m o f Ra n k s N a rra ti v e M an n -W h it n ey U W il c o x o n W
Z Asy
m p . S ig . (2 -ta il e d ) Content Item 1 Item 19 Item 21 Item 24 Item 25 Item 30 53.18 58.27 58.52 56.49 59.61 53.90 67.83 62.73 62.48 64.51 61.39 67.10 3190.50 3496.00 3511.00 3389.50 3576.50 3234.00 4069.50 3764.00 3749.00 3870.50 3683.50 4026.00 1360.500 1666.000 1681.000 1559.500 1746.500 1404.000 3190.500 3496.000 3511.000 3389.500 3576.500 3234.000 -2.518 -.756 -.694 -1.343 -.302 -2.245 .012 .449 .488 .179 .762 .025 Format
Item 7 60.79 60.21 3647.50 3612.50 1782.500 3612.500 -.097 .923
Quality of Language Item 5 Item 10 Item 11 Item 18 Item 22 Item 26 Item 29 Item 31 52.57 50.47 59.70 51.13 63.64 52.93 51.28 66.81 68.43 70.53 61.30 69.88 57.36 68.07 69.72 54.19 3154.00 3028.00 3582.00 3067.50 3818.50 3176.00 3077.00 4008.50 4106.00 4232.00 3678.00 4192.50 3441.50 4084.00 4183.00 3251.50 1324.000 1198.000 1752.000 1237.500 1611.500 1346.000 1247.000 1421.500 3154.000 3028.000 3582.000 3067.500 3441.500 3176.000 3077.000 3251.500 -2.637 -3.375 -.281 -3.100 -1.057 -2.506 -3.128 -2.121 .008 .001 .779 .002 .290 .012 .002 .034 Motivation Item 2 Item 8 Item 15 Item 23 52.09 53.28 52.82 44.85 68.91 67.72 68.18 76.15 3125.50 3197.00 3169.00 2691.00 4134.50 4063.00 4091.00 4569.00 1295.500 1367.000 1339.000 861.000 3125.500 3197.000 3169.000 2691.000 -2.748 -2.372 -2.514 -5.212 .006 .018 .012 .000
information to the content (item 21), the intelligibility of content (item 24) and accuracy and up-to-datedness of the given information (item 25).
In terms of format, none of the items were significantly different between the expository and narrative text types.
In terms of quality of language, the mean ranks of the expository text types were less than those of the narrative text types in all the items except item 31. This indicates that compared with the expository texts, the narrative texts had clearer language (item 5), more personal pronouns to help the readers understand they were addressed (item 10), better match between the language of the texts to the linguistic abilities of the learners (item 18), more learner-friendly language (item 26), and shorter and simpler sentences (item 29). On the other hand, comparing with the narrative text types, the expository text types had more adequate paragraphing.
Concerning motivation, the mean ranks of all of the items were significant in the narrative text types and were higher than those in the expository ones. This indicates that the readers felt more consonant with the narrative texts than the expository ones (item 2), liked the narrative texts more than the expository ones because the narrative texts made them think more (item 8), the narrative texts were more interesting than the expository ones for the readers (item 15), and the readers were more able to visualize the narrative texts than the expository ones.
3.1 Text Type Comparison in Terms of Idea Density
Table 7. Descriptive Statistics on Idea Density of the Three Text Types
N Mean SD
Argumentative Expository Narrative Total
11 11 11 33
.49 .50 .53 .51
.024 .032 .007 .028
The analysis of the texts in terms of idea density indicated significant differences among the three text types in terms of idea density:
Table 8. ANOVA of Texts in Terms of Idea Density
Sum of Squares df Mean Square F Sig. Between
Groups
Within Groups
Total
.009
.017
.026
2
30
32
.005
.001
8.324 .001
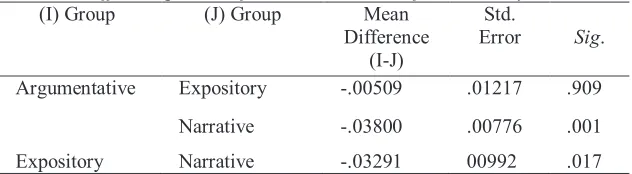
To determine where the loci of the differences lie, post hoc analysis was conducted (see Table 9):
Table 9. Scheffe Comparison of the Texts in Terms of Idea Density
(I) Group (J) Group Mean
Difference (I-J)
Std.
Error Sig.
Argumentative Expository -.00509 .01217 .909
Narrative -.03800 .00776 .001
Expository Narrative -.03291 00992 .017
As can been seen, the argumentative vs. the narrative as well as the expository vs. the narrative text types had significantly different idea densities.
narratives were perceived to be significantly more difficult than the argumentative and expository text types). However, this difference between the argumentative-expository pair was not meaningful.
4. Discussion and Conclusion
Understanding textual material is a function of a wide variety of text-processing variables. In this study, we focused on propositional density and reader perceptions of text difficulty across different text types. Significant differences were found between the argumentative vs. the narrative and the expository vs. the narrative pairs of texts in terms of idea density and thus, readability. Mean comparisons indicated that compared with the narrative texts, the argumentative and expository texts had lower degrees of idea density. Higher degrees of idea density for the narratives imposed higher cognitive load for the readers. Accordingly, the argumentative and expository texts were shown to be more readable than their narrative counterparts.
The questionnaires’ results on the perceptions of the EFL learners on the difficulty levels of the three text types indicated significant differences among learners’ perceptions on these texts. The post hoc comparisons led us to the following interpretations:
x In terms of content, format, motivation, and quality of language, the argumentative texts were found to have significantly higher readabilities than their expository counterparts.
x In comparison with the narrative texts, the argumentative texts had significantly higher readabilities. In other words, in terms of content, motivation, and quality of language which affect readability, the argumentative texts had higher mean ranks than their narrative counterparts.
x The narrative texts were perceived to have significantly higher readabilities than the expository ones in terms of content and motivation. In terms of quality of language, the narrative texts had significantly higher degrees of readability than the expository ones.
x All in all, it is understood that the argumentative texts were perceived as the easiest, and the expository texts were considered the most difficult texts in terms of ease of reading as shown below:
Argumentative > Narrative > Expository
4.1 Comparison of the Findings of Quantitative and Qualitative Approaches to Readability Assessment
The comparison of idea densities indicated that the argumentative and expository texts had lower idea densities (i.e., higher readabilities) compared with the narrative texts. This finding is in agreement with the results of the readability analysis using the questionnaires. Nevertheless, the comparison of idea densities of the expository vs. narrative texts based on the questionnaire findings and the readability formula were in contradiction. This indicates that there needs to be a reconsideration of different readability approaches in the selection of different texts for their intended readers. Integration of reader perceptions of difficulty with quantitative formula can be one positive step in determining textual difficulty.
Contrary to our findings, it is generally believed that narrative texts need lower use of memory and are easier than other text types (Daghir, 2010, Feathers, 2004). Both qualitative and quantitative readability assessments in this study showed lower degrees of easiness for the narrative texts compared with the argumentative texts. In narrative comprehension, different readers are likely to visualize different scenes depending on their prior experience and expectations. It seems that “... it is harder to recall such text accurately because of the contamination from the visualization process” (Alderson, 2000, p. 64). In addition, higher load of moral and cultural involvement in narrations might make understanding these texts not as easy as argumentative or expository texts which are mostly analytic and conceptual and not much affected by cultural issues (Denis, 1982).
The contradiction between the findings of quantitative assessment and qualitative assessments of readability can be partly related to the shortcomings of the readability approaches in considering reader factors such as their interests, familiarity, and background knowledge. The readability formulae are based on the surface structure of the texts; therefore, the readers’ beliefs about the difficulty level of such texts than the other ones may be in conflict with the predictions of readability formulae. Hence, the common beliefs concerning higher readabilities of narratives compared with expository texts may not match the findings of readability formulae.
done in this study, drawing on expert knowledge, as well as learner judgment seem essential in addition to the classic readability measures based on idea density, word, or syllable count. Such a quest should take the complex interaction between reader perceptions and text type into account and determine the extent to which they contribute to textual readability.
In this study, we compared the perceived readability of the texts with a quantitative measure of them. One limitation of this study is that the relationship between perceived and actual readability procedures was not examined. Further research is needed regarding the reader dimensions of textual intelligibility while reading different text types. It should deal with modes of processing, amount of recall, types of inferences and strategies, and reading time using both online and offline comprehension measurement techniques such as recall protocols, self-paced reading time, think aloud, or cloze tests (Parry, 1996; Wolfe & Mienko, 2007; Yoshida, 2012).
References
Alderson, J. C. (2000).Assessing reading. Cambridge: Cambridge University Press. Brown, C., Snodgrass, T., Kemper, S. J., Herman, R., & Covington, M. A. (2008).
Automatic measurement of propositional idea density from part-of-speech tagging.Behavioral Research Methods, 40(2), 540-545.
Camiciottoli, B. C. (2003). Metadiscourse and ESP reading comprehension: An exploratory study.Reading in a Foreign Language, 15(1), 1-31.
Carrell, P. L. (1987). Readability in ESL. Reading in a Foreign Language, 4,21-40. Chambers, F. (1983). Readability formulae and the structure of text. Educational
Review, 35(1), 3-13.
Davison, A., & Kantor, R. N. (1982). On the failure of readability formulae to define readable texts: A case study from adaptations. Reading Research Quarterly, 17(2), 187-209.
Denis, M. (1982). Imaging while reading text: A study of individual differences. Memory & Cognition, 10(6), 540-545.
DuBay, W. H. (2004). The principles of readability. California: Impact Information. Feathers, K. M. (2004). Infotext reading and learning. Toronto: Pippin Publishing
Corporation.
Graesser, A. C., Golding, G. M., & Long, D. L. (1991) Narrative representation and comprehension. In R. Barr, M. Kamil, P. Mossenthal, & P. Pearson (Eds.). Handbook of reading researchII (pp. 171-204). White Plains, NY: Longman.
Hatim, B., & Mason, I. (1990). Discourse and the translator. New York: Longman Inc. Horning, A. S. (1985). Readability: Reading/writing tools for measurement. Journal
of Advanced Composition, 7, 101-111.
Inegbedion, J. O. (2009). Assessing the difficulty index of course materials in National Open University of Nigeria. Journal of Educational Research, 12(1), 18-35.
Kintch, W., & Van Dijk, T. A. (1978). Toward a model of text comprehension and production. Psychological Review, 85(5), 363-394.
Lehman, S. D., & Schraw, G. (2002). Effects of coherence and relevance on shallow and deep text processing. Journal of Educational Psychology, 94(4), 738-750.
Liu, H. (2004). MontyLingua: An end-to-end natural language processor with common sense [Computer software and documentation]. Retrieved September 30, 2012, from the World Wide Web: http://web.media.mit.edu/~hugo/montylingua
Meyer, B. J. F., & Poon, L. W. (2004). Effects of structure strategy training and signaling on recall of text. In R. B. Ruddell & N. J. Unrau (Eds.),Theoretical models and processes of reading (pp. 810-851). Newark, DE: International Reading Association.
Marnell, G. (2008). Measuring readability, part 1: The spirit is willing but the Flesch is weak. Southern Communicator, 14, 12-16.
McLaughlin, G. H. (1968). Proposals for British readability measures. In J. Downing & A.L. Brown (Eds.), The third international reading symposium (pp. 186-205). London: Cassell.
Meyer, B. J. F., Marsiske, M., & Willis, S. L. (1993). Text processing variables predict the readability of everyday documents read by older adults. Reading Research Quarterly, 28(3), 235-249.
Oakland, T., & Lane, H. (2004). Language, reading, and readability formulas: Implications for developing and adapting tests. International Journal of Testing, 4, 239-252.
Oosten, V. P, Hoste, E., &Tanghe, D. (2011). A posteriori agreement as a quality measure for readability prediction systems. CICLing, 2,424-435.
Parry, K. (1996). Culture, literacy and L2 reading. TESOL Quarterly, 30(4), 665-692.
Ulusoy, M. (2006). Readability approaches: Implications for Turkey. International Education Journal, 7(3), 323-332.
Urquhart, A.H. (1984). The effect of rhetorical ordering on readability. In J.C., Alderson, & A.H., Urquhart (Eds.),Reading in a Foreign Language (pp. 160-175).London: Longman.
Weaver, C. A., & Kintsch, W. (1991). Expository text. In R. Barr, M. Kamil, P. Mossenthal, & P. Pearson (Eds.), Handbook of reading researchII, (pp. 230-245). White Plains, NY: Longman.
Wolfe, M. B. W., & Mienko, J. A. (2007). Learning and memory of factual content from narrative and expository text. British Journal of Educational Psychology, 77, 541-564.