The Thirty-Third AAAI Conference on Artificial Intelligence (AAAI-19)
Deep Transformation Method for
Discriminant Analysis of Multi-Channel Resting State fMRI
Abhay M S Aradhya
School of Computer EngineeringNTU, Singapore [email protected]
Aditya Joglekar
Computer Science DepartmentUCLA, USA [email protected]
Sundaram Suresh
Department Of AerospaceIISC, India [email protected]
M. Pratama
School of Computer Engineering NTU, Singapore [email protected]
Abstract
Analysis of resting state - functional Magnetic Resonance Imaging (rs-fMRI) data has been a challenging problem due to a high homogeneity, large intra-class variability, limited samples and difference in acquisition technolo-gies/techniques. These issues are predominant in the case of Attention Deficit Hyperactivity Disorder (ADHD). In this pa-per, we propose a new Deep Transformation Method (DTM) that extracts the discriminant latent feature space from rs-fMRI and projects it in the subsequent layer for classification of rs-fMRI data. The hidden transformation layer in DTM projects the original rs-fMRI data into a new space using the learning policy and extracts the spatio-temporal correlations of the functional activities as a latent feature space. The sub-sequent convolution and decision layers transform the latent feature space into high-level features and provide accurate classification. The performance of DTM has been evaluated using the ADHD200 rs-fMRI benchmark data with cross-validation. The results show that the proposed DTM achieves a mean classification accuracy of 70.36% and an improve-ment of 8.25% on the state of the art methodologies was ob-served. The improvement is due to concurrent analysis of the spatio-temporal correlations between the different regions of the brain and can be easily extended to study other cognitive disorders using rs-fMRI. Further, brain network analysis has been studied to identify the difference in functional activities and the corresponding regions behind cognitive symptoms in ADHD.
Introduction
Blood Oxygen Level Dependent (BOLD) fMRI is widely used to map the brain functional activities (Song and Lu 2017). The correlations between the regional functional ac-tivities during a cognitive task are studied using the multi-channel time series fMRI data to evaluate the interactions
Copyright c2019, Association for the Advancement of Artificial Intelligence (www.aaai.org). All rights reserved.
between the various regions of the brain (Yousefnezhad and Zhang 2017). fMRI data have been used to understand the etiopathogenesis of neurological disorders such as Atten-tion Deficit Hyperactivity Disorder (ADHD) (Mahanand, Savitha, and Suresh 2013), autism (Subbaraju et al. 2017) and epilepsy (Gill, Mirsattari, and Leung 2017). Studies on the automatic diagnosis of neurological disorders from fMRI data have focused on analyzing the correlations between the regions to find discriminant activities. Among them, Spatial Filtering Method (SFM) (Subbaraju et al. 2017) proposed a spatial transformation method to obtain discriminatory fea-tures by projecting the fMRI data into a new dimension, such that the two classes are highly separable. Their results represent the state of the art diagnostic performance on the Autism dataset. Recently, (Aradhya et al. 2018) utilized a regularized SFM based technique to improve the accuracy in the automatic detection of accuracy of ADHD from rs-fMRI data. SFM and its deravative techniques have adopted the ‘Fukunaga-Koontz ‘transform (Fukunaga 2013) to math-ematically derive the spatial transformation filter which is greatly dependent on the mean distribution of the training data. Further, the mean co-variance based spatial transfor-mation methodologies such as SFM overlooks the temporal information of the data, resulting in plausible loss of dis-criminative information.
psycholog-ical disorders (Vieira, Pinaya, and Mechelli 2017). The re-sults indicate that deep learning methodologies achieve bet-ter classification in comparison to the traditional methods. However, direct application of deep learning methodologies on neurological datasets is a challenge due to - the small size of the dataset, imbalanced class distribution, high vari-ability in the data and lack of discriminatory information between the classes. Deep learning approaches have been explored in the diagnosis of ADHD, (Kuang and He 2014) used Restricted Boltzmann Machines (RBM) for classifica-tion of ADHD. They converted the fMRI time series into a 1D spectral feature vector and then trained a Deep Belief Network (DBN) for the classification task and reported a classification accuracy below50%on the ADHD200 bench-mark dataset.
Recently, there has been increasing interest in the applica-tion of Convoluapplica-tion Neural Networks (CNNs) in the detec-tion and identificadetec-tion of biomarkers of diseases from fMRI, X-ray images, computed tomography scans and positron emission tomography scans (Rav`ı et al. 2017). (Riaz et al. 2017) adopted a CNN based feature extraction method to identify the discriminant functional activities using rs-fMRI and phenotypic information. They obtained an average ac-curacy of 62%, with a Support Vector Machine (SVM) clas-sifier. (Zou et al. 2017) introduced a multi-modal 3D CNN approach to study ADHD. Here, the encoded structural-MRI and fMRI are jointly extracted as features and achieved a classification accuracy of 69.15%. In (Vieira, Pinaya, and Mechelli 2017), the functional connectivity in the brain be-tween the different regions was examined and the results concluded that the functional connectivity between the var-ious regions of the brain encodes critical information in understanding ADHD. However, directly applying existing CNN algorithms to diagnose ADHD is not feasible due to the small size of the publicly available ADHD dataset and the lack of separability between the two classes. Motivated by the findings in the above studies and to address the chal-lenges in the automatic diagnosis using rs-fMRI data, in this paper, we develop a new deep learning method to effectively capture the spatio-temporal functional correlations between the different regions of the brain.
In this paper, we propose a Deep Transformation Method (DTM), which project the rs-fMRI time series data into la-tent feature space using hidden transformation layer and the subsequent convolution/decision layers help in classifica-tion. The cross-correlations across the different regions are used by hidden transformation layer to capture the spatio-temporal correlations between the regions of the brain. Fur-ther, the convolution layer transforms the latent space to high-level features. A softmax activation function in the de-cision layer estimates the class conditional probabilities to classify the rs-fMRI data. DTM shows that the functional correlations and convolution filters are complementary, and not only help in extracting the spatio-temporal correlations in the multi-channel data but also boost the classification performance.
The three significant contributions of this paper are: 1. The hidden transformation layer in DTM handle the
ho-mogeneity and provide discriminant analysis by
preserv-ing the spatial-temporal information. Further, DTM is suitable to handle transformation from a small sample size, and uncertainties in time-series data due to differ-ences in data acquisition methods.
2. We find that the functional activity disruptions in ADHD are spatio-temporally correlated and the proposed methodology provides support to the brain network dys-function hypotheses proposed to explain dysdys-functional functional brain activities in ADHD.
3. The proposed methodology achieves a state of the art classification accuracy of 70.36% on a hold-out testing dataset from the ADHD200 consortium dataset, demon-strating the significance of concurrently analyzing the spatio-temporal information in fMRI for the diagnosis of neurological disorders.
The rest of the paper is organized as follows, first, an overview of the problem, its implications and a brief liter-ature review is presented. Further, a detailed methodology of the proposed Deep Transformation Method (DTM) is de-scribed. The results and discussion section presents the in-ferences and classification performance of DTM using the ADHD200 dataset. In the next section, a brief overview of the experimental setup and dataset is presented. The perfor-mance of the DTM is evaluated using the state of the art methodologies and the significance of the concurrent analy-sis of the spatio-temporal correlations are presented. Finally, the conclusions from the study are summarized and future scope of work is defined.
Problem Formulation
Diagnosis of ADHD from rs-fMRI is challenging due to a highly homogeneous dataset with large intra-class vari-ability. ADHD is one of the most prevalent developmen-tal neurological disorders in the world with (3-10% world-wide) (Burd et al. 2003). Traditional diagnostic methods for ADHD are based on cognitive tests, interviews and obser-vations by the doctors and associates. However, these are highly prone to variations due to human errors like inaccu-rate observations and inter-observer variability. The intelli-gence quotient, culture and language of the subject is also known to have a major influence on the diagnostic dure. These discrepancies in the current diagnostic proce-dure have led to a high risk of misdiagnosis and administra-tion of improper medicaadministra-tions.
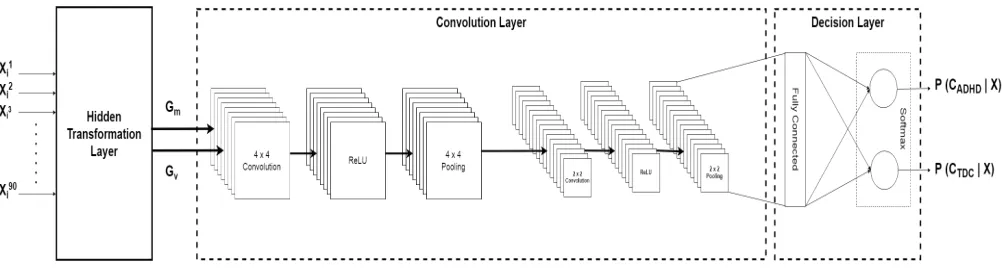
Figure 1: Architecture of the proposed DTM for the diagnosis of ADHD from rs-fMRI data.
resting state fMRI (rs-fMRI) which measures the intrinsic brain activities to underline the causal factors of ADHD. rs-fMRI although independent from task-directed cognitive processes, are extremely homogeneous and presents a chal-lenge in identifying the discriminant functional activities.
(Mahanand, Savitha, and Suresh 2013) studied the re-gional anatomy of the brain using the amygdala and cerebel-lar vermis regions. They used a meta-cognitive learning clas-sifier and achieved a classification accuracy of 65%. Analyz-ing rs-fMRI activity from specific regions of the brain leads to a potential loss of valuable discriminative information. (Anderson et al. 2014) used a decision tree based approach to achieve a maximum classification accuracy of66.8% us-ing both the phenotypic and rs-fMRI data. However, the classification accuracies of studies focusing of automated di-agnosis of ADHD from rs-fMRI alone (without using phe-notypic information or predetermined neural regions) have been substantially lower. (Ghiassian et al. 2013) used a his-togram based feature reduction technique along with an Sup-port Vector Machine (SVM) classifier and achieved a clas-sification accuracy of 62.81%. (Guo et al. 2014) studied the regional connectivity between the regions of the brain and reported an accuracy of 63.75%. The existing approaches is not able to handle high homogeneity, large intra-class vari-ability, limited samples and difference in acquisition tech-nologies/techniques.
Deep Transformation Method (DTM)
DTM is a deep learning based classifier that projects the rs-fMRI data into a latent space and captures the spatio-temporal correlations to handle the above-mentioned issues and understand the discriminant functional activities of the brain. For this purpose, we propose a multi-layered Deep Transformation Method (DTM). The schematic representa-tion of the DTM architecture is shown in Figure 1. DTM uses the Hidden Transformation Layer (HTL) to project the rs-fMRI data into a latent space where the classes are highly separable. The convolution layers extract high-level features from the grey scale correlation images and the decision layer uses a sigmoid activation function to classify the data.
Hidden Transformation Layer (HTL)
The hidden transformation layer transforms the time series rs-fMRI dataXi ={Xi1, Xi2, Xi3,· · ·, Xi90}(annotated in
accordance to the automated anatomical labeling template) into an image data by preserving spatio-temporal informa-tion. These transformed images are highly discriminative for both the classes. Conventionally the transformation filters are determined using mathematical derivations such as the ‘Fukunaga-Koontz ‘transform (Fukunaga 2013). Previous studies (Subbaraju et al. 2017) have used the derivative ap-proaches and have achieved significant improvement in clas-sification accuracy. However, the clasclas-sification performance of such deterministic methodologies are greatly reliant on the accurate estimation of the spatial filterW∈R90×90, that transforms the BOLD rs-fMRI time series dataX ∈R90×T
(from the 90 regions of the brain with Ttime points). The different classes of the rs-fMRI data are highly separable in the new space and the transformed rs-fMRI dataY∈R90×T
calculated as
Y =W X (1)
Although the eigen value decomposition based ap-proaches provide a good approximation of the transforma-tion filter, they are highly reliant on the mean distributransforma-tion of the data. Also, such methods are susceptible to noise in problems with small dataset and high intra-class variability resulting in loss of discriminatory information. The discrim-inatory functional activities of the brain in the transformed rs-fMRI are represented as differences in functional con-nectivity between the different regions of the brain (Vieira, Pinaya, and Mechelli 2017). Therefore, it is beneficial to de-velop a non-deterministic approach to study the correlations between the rs-fMRI signals in order to validate the discrim-inant activities of the brain.
S(i,j)=
Yi[t]Yj[t−d]0
trace(Yi[t]Yj[t−d]0)
(2)
The above equation can be simplified as
b
S(i,j)=
Wi[t]Xi[t]Xj[t−d]0Wj[t−d]0
trace(Wi[t]Xi[t]Xj[t−d]0Wj[t−d]0)
(3)
where, d=−tn,· · · , tn and i, j= 1,2,· · · ,90
In Equation 3, tn represents the total number of time
points in the time series dataX,dis the delay used in cal-culating the cross-correlations whileiandjare indices rep-resenting a pair of regions. The regional covariance matrix
S ∈ R90×90×tn is a non-symmetric three dimensional
ma-trix where0≤ ||S|| ≤1. In order to determine the regional connectivity, it is beneficial to analyze the cross-correlation between the rs-fMRI time series signals as cross-correlation effectively captures the temporal correlations between the various regions of the brain, which is otherwise lost during simple linear correlation based estimation.
Further, as Equation 3 can be represented as a series of linear matrix operations and therefore is differentiable with respect toW. The transformation filterW is therefore updated using the backpropagation based learning strategy such that error in classification performance is minimized. Therefore, DTM uses a data-centric deep learning approach to derive the transformation filterWto optimize the classifi-cation performance. Moreover, this enables the formulation of HTL as an independent deep learning layer which can be used in a multi-layer deep learning network to transform the data into a latent feature space.
In this paper, we have applied a multi-layer convolutional network along with the HTL transformation layer in order to extract high-level features from the rs-fMRI data. Con-volution neural networks use two-dimensional filters and therefore necessitate the conversion of the three-dimensional regional covariance matrix into a two-dimensional feature space. Hence, the mean (Sbm) and variance (Sbv) across the
time dimension was calculated as
b
Sm=
1 (2tn−1)
(2tn−1)
X
t=1
b
S(t) (4)
b
Sv=var
b
S(t) (5)
where,SbmandSbvare non-symmetric matrices of
dimen-sion90×90which encapsulate the spatio-temporal func-tional activity between the 90 regions of the brain.
Convolutional Layer
The functional relationship between the different regions of the brain is represented by the correlations between the neighbouring (spatially correlated) elements in the regional covariance matrices (Vieira, Pinaya, and Mechelli 2017).
Convolutional neural networks is a popular deep learning method that is adept at capturing spatial information and has been effective in the classification of natural images (Le-Cun, Bengio, and Hinton 2015). DTM exploits the convo-lutional layers to extract low-level spatial features and trans-form them into high-level features. The regional connectiv-ity matricesSbmandSbvare converted into normalized mean
greyscale imageGmand the variance greyscale imageGv
are given as
Gm= 0.5 (Sbm+ 1) (6)
Gv= 0.5 (Sbv+ 1) (7)
GmandGvare used as inputs to train the two convolution
layers. Convolution operations are generally data intensive, wherein the accuracy is directly proportional to the quantity of data used to train the network and the number of layers (depth) used.
However, neurological datasets pose a challenging prob-lem as the number of data samples available are generally limited. Using a large number of convolution layers would thus lead to over-fitting, resulting in a bad generalization of the data. Therefore, DTM uses a shallow LeNet (LeCun and others 2015) based architecture with two layers of Conv-RELU-Maxpool followed by a decision layer.
The first convolutional layer consists of eight4×4filters with a depth two (corresponding to the 2 input channels). A stride of one was adopted in both horizontal and vertical directions to ensure that none of the discriminatory infor-mation is neglected. In order to maintain the dimension of the inputs, they are padded with zeros (’SAME’ padding). Further, a Leaky Rectified Linear Units (ReLU) layer with
α = 0.2 was used to add non-linearity to the network. A max-pooling layer with a8×8filter and8×8stride was introduced which although leads to some information loss, prevents having too many learnable parameters compared to the size of the dataset to avoid overfitting. The second con-volution layer had more depth along with narrower filters as per the standard practice. It consisted of sixteen2×2filters with8input channels with a unit stride, followed by a leaky ReLU (α= 0.2) non-linearity and a max-pooling layer with 4×4filter and4×4stride.
Decision Layer
The decision layer consists of a fully connected layer and a softmax layer. The output from the last Conv-RELU-Maxpool layer is connected to a fully connected layer with about 1000 neurons, which are then connected to the soft-max layer with two output neurons. The softsoft-max layer with a sigmoid activation function was used to estimate the condi-tional probabilityP(Cx|X); that is, the confidence of DTM
in predicting the class of the current inputXcorrectly asCx.
The class with the maximum conditional probability was given as the predicted class for the inputX.
Brain Functional Activity Maps
between subjects with neurological disorders and neurotyp-ical subjects. The differences in neural activity are obtained using the inverse of the spatial filter W, derived such that the original time series can be regenerated from the inverse spatial filter (W−1) and the projected time series dataYas
b
X =W−1Y (8)
where Xb is the regenerated BOLD rs-fMRI data. The columns ofW−1is referred to as spatial distributions. Each element in the column ofW−1is called as a spatial weight and is assigned to each of the corresponding of the 90 Au-tomated Anatomical Labelling (AAL) regions. The spatial weights with significant variance from the mean of each col-umn highlights the significant regions with differences in BOLD rs-fMRI signals between the classes. The polarity of the spatial weights do not hold any significance, and only the absolute value of the spatial weight needs to examined. The mean spatial distribution and standard deviation of each of the spatial distribution were calculated and the regions with spatial weights whose magnitude is greater than two times the standard deviation away from the mean were considered significant in this paper. The inverse spatial filter from the trail with the highest classification accuracy was chosen and a representative spatial distribution is plotted and the dis-tribution of the spatial weights are analyzed. The regions are further visualized using a brain functional map to depict the regions with discriminant functional activity between the classes.
Experimental Setup
The deep transformation method was implemented as a ”TensorFlow” graph in ”Python” scripting language and was trained over one hundred (100) iterations with a learning rate of0.001using a mini-batch gradient descent approach with a batch size of 32. The batch learning approach prevents con-vergence is a trade-off between avoiding local minima and the convergence time. Although the DTM took thirty min-utes (30) of training time using an ’Intel(R) Xeon(R) CPU E5-1630 v4 @ 3.70GHz’ central processing unit, it signif-icantly reduced to seven (7) minutes with the use of ’Tesla P100-SXM2-16GB’ graphical processing unit. Each fold of data consisted of non-intersecting training and testing data samples drawn in the ratio 371:54. Every consecutive fold of test data was ensured to have no overlap with the pre-vious test data to obtain generalized results and the aver-age performance over the five folds are reported as the mean classification performance measure.
ADHD200 Dataset
In order to validate the performance of the DTM, we have used the benchmark ADHD200 dataset from the Interna-tional Neuroimaging Data-sharing Initiative (INDI). INDI has facilitated Deep learning research on ADHD by aggre-gating rs-fMRI data from 947 people between the age of 7 years to 22 years, aggregated from 8 different institutions under the ADHD200 consortium. However, for the study presented in this paper the data from Brown University were excluded as the diagnostic information of the rs-fMRI data
were not available at the time of compilation of this study. Of the 947 people in the ADHD200 consortium dataset, 563 people (59.45%) were found to male right-handed. Previ-ous studies (Skounti, Philalithis, and Galanakis 2007) have shown that the gender and handedness of a person severely influence the presentation of functional brain activities in rs-fMRI data. Hence, in order to preserve the homogeneity in the data, this study is confined to male right-handed people. The rs-fMRI data from the ADHD200 consortium was pre-processed using the ATHENA pipeline (Bellec et al. 2017) in order to remove the variations due to the physio-logical noise, head motion and scanner drifts. The denoised rs-fMRI data without bandpass filtering provided by (Bellec et al. 2017) was anatomized using the AAL template into 116 regions. The 26 regions corresponding to the cerebel-lum were excluded to minimize the effects of involuntary activities such as breathing and cardiac activity. Finally, a manual quality control (QC) check was performed and sam-ples with incomplete data and that failed the QC in (Bellec et al. 2017) were removed and rs-fMRI data from the 90 AAL regions were obtained from 465 people. Further details on the preprocessing and QC measures can be obtained from (Bellec et al. 2017).
To facilitate cross-validation and evaluate the perfor-mance of the algorithm, the dataset was partitioned into training and test data-sets of 371 and 94 subjects respec-tively. A 10-fold random partition was done ensuring the ratio of ADHD to TDC remained constant across the folds. The mean classification accuracy and the standard deviation across the partitions are considered as the key indicators of the performance of DTM.
Results and Discussion
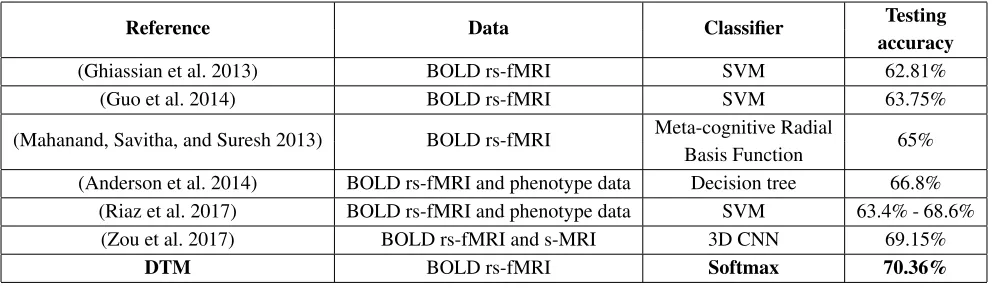
Table 1: Comparison of diagnostic performance between the proposed DTM and state of the art methodologies using ADHD200 consortium dataset
Reference Data Classifier Testing
accuracy
(Ghiassian et al. 2013) BOLD rs-fMRI SVM 62.81%
(Guo et al. 2014) BOLD rs-fMRI SVM 63.75%
(Mahanand, Savitha, and Suresh 2013) BOLD rs-fMRI Meta-cognitive Radial 65% Basis Function
(Anderson et al. 2014) BOLD rs-fMRI and phenotype data Decision tree 66.8% (Riaz et al. 2017) BOLD rs-fMRI and phenotype data SVM 63.4% - 68.6%
(Zou et al. 2017) BOLD rs-fMRI and s-MRI 3D CNN 69.15%
DTM BOLD rs-fMRI Softmax 70.36%
show the highest accuracy in diagnosis achieved by previ-ous studies. Although from the above results it is observed that phenotype data and s-MRI data when used along with the rs-fMRI data improves the classification performance, it hinders the derivation significant conclusions on the dis-criminant functional activities in ADHD. Therefore, DTM uses only BOLD rs-fMRI as input and in comparison yields a better diagnostic performance on a hold-out test dataset. DTM achieves a mean classification accuracy of 70.36% with a low standard deviation of 0.02 which is a significant improvement of 8.25% over the existing methods. The con-fusion matrix of the classification performance is given in
Table 2.
Table 2: Classification performance of DTM Parameter Train Percentage Test Percentage
True Positive 49.8% 41.5%
True Negative 39.5% 28.9%
False Positive 10.5% 13.7%
False Negative 0.2% 15.9%
Evaluation of significance of concurrent analysis of
spatio-temporal information
Table 3: Comparison of diagnostic accuracy of DTM with different region correlation methodologies
Region correlation Training Testing
measure Mean S.D Mean S.D
Linear correlation 95.12% 0.12 55.27% 0.01 Cross-correlation 89.23% 0.007 70.36% 0.02
The advantages of substituting the linear correlation re-gional covariance matrix with the mean and variance of the region covariance matrix derived using the cross-correlation
approach is shown inTable 3. Adopting the linear correla-tion approach to derive the regional covariance matrix al-though leads to an increase in mean training accuracy, the mean testing accuracy sharply reduces to 55.27% due to overfitting. These results indicate that the time series signals of the different regions of the brain have higher correlations when shifted in time. These findings prove that the func-tional activity disruptions in ADHD are spatio-temporally correlated and supports the brain network dysfunction the-ory proposed by (Menon 2011).
Identification of distinguishable brain activities in
ADHD right handed male subjects
The spatial weight distribution and brain activity maps of the regions of the brain highlight the discriminant regions of the brain with significant differences in functional activity. The spatial weights from the 90 regions of one of the prominent spatial distributions is plotted inFigure 2. The magnitude of the spatial weights in the figure represent the importance of the region for classification. As the signs of the spatial weights do not signify any information the absolute value of the spatial weights is considered. The magnitude of each of the spatial weights corresponds to the influence of the cor-responding regions functional activity in the classification process.
Figure 2: AAL regions exhibiting discriminant functional activity and the associated spatial weights obtained from DTM
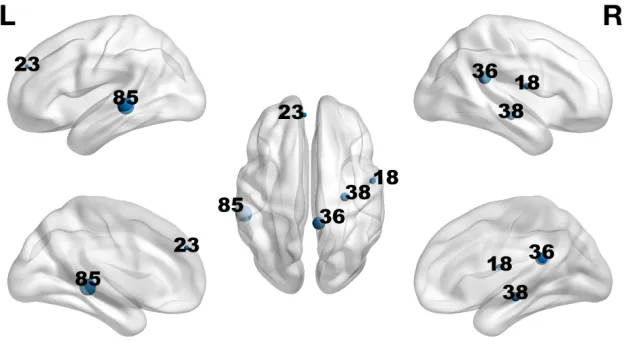
Figure 3: Brain functional activity map showing the lateral and dorsal view of the brain, presenting the regions of the brain with significant variances in rs-fMRI signal between ADHD patients and neurotypical males
Note: Rolandic Operculum (18), Medial Frontal Gyrus (23), Posterior Cingulate Gyrus (36), Hippocampus (38) and the Middle Temporal Gyrus (85)
observed that the regions identified with discriminant func-tional activity by DTM are related to the cognitive symp-toms associated with ADHD such as hyperactivity, impul-sivity and inattentiveness.
Conclusions
The proposed deep transformation method uses a hidden transformation layer to project the rs-fMRI into discrimi-native latent space and preserve the spatio-temporal infor-mation. Further, the convolution layers and decision layer
as a brain network dysfunctional neurological disorder. The brain network analysis reveals that the difference in func-tional activities is predominant in the temporal lobe and pos-terior cingulate cortex which implies inattentiveness and im-pulsivity in ADHD.
References
Anderson, A.; Douglas, P. K.; Kerr, W. T.; Haynes, V. S.; Yuille, A. L.; Xie, J.; Wu, Y. N.; Brown, J. A.; and Cohen, M. S. 2014. Non-negative matrix factorization of mul-timodal mri, fmri and phenotypic data reveals differential changes in default mode subnetworks in adhd. NeuroImage
102:207–219.
Aradhya, A. M. S.; Subbaraju, V.; Sundaram, S.; and Sun-dararajan, N. 2018. Regularized spatial filtering method (r-sfm) for detection of attention deficit hyperactivity disor-der (adhd) from resting-state functional magnetic resonance imaging (rs-fmri). In2018 40th Annual International Con-ference of the IEEE Engineering in Medicine and Biology Society (EMBC), 5541–5544.
Bellec, P.; Chu, C.; Chouinard-Decorte, F.; Benhajali, Y.; Margulies, D. S.; and Craddock, R. C. 2017. The neuro bureau adhd-200 preprocessed repository. Neuroimage
144:275–286.
Burd, L.; Klug, M. G.; Coumbe, M. J.; and Kerbeshian, J. 2003. Children and adolescents with attention deficit-hyperactivity disorder: 1. prevalence and cost of care. Jour-nal of Child Neurology18(8):555–561.
Bush, G. 2011. Cingulate, frontal, and parietal cortical dys-function in attention-deficit/hyperactivity disorder. Biologi-cal psychiatry69(12):1160–1167.
Fransson, P., and Marrelec, G. 2008. The pre-cuneus/posterior cingulate cortex plays a pivotal role in the default mode network: Evidence from a partial correlation network analysis. Neuroimage42(3):1178–1184.
Fukunaga, K. 2013.Introduction to statistical pattern recog-nition. Elsevier.
Ghiassian, S.; Greiner, R.; Jin, P.; and Brown, M. 2013. Learning to classify psychiatric disorders based on fmr im-ages: Autism vs healthy and adhd vs healthy. InProceedings of 3rd NIPS Workshop on Machine Learning and Interpre-tation in NeuroImaging.
Gill, R. S.; Mirsattari, S. M.; and Leung, L. S. 2017. Resting state functional network disruptions in a kainic acid model of temporal lobe epilepsy.NeuroImage: Clinical13:70–81. Guo, X.; An, X.; Kuang, D.; Zhao, Y.; and He, L. 2014. Adhd-200 classification based on social network method. InInternational Conference on Intelligent Computing, 233– 240. Springer.
Konrad, K., and Eickhoff, S. B. 2010. Is the adhd brain wired differently? a review on structural and functional con-nectivity in attention deficit hyperactivity disorder. Human brain mapping31(6):904–916.
Kuang, D., and He, L. 2014. Classification on adhd with deep learning. InCloud Computing and Big Data (CCBD), 2014 International Conference on, 27–32. IEEE.
LeCun, Y., et al. 2015. Le5, convolutional neural net-works. URL: http://yann. lecun. com/exdb/lenet 20. LeCun, Y.; Bengio, Y.; and Hinton, G. 2015. Deep learning.
nature521(7553):436.
Mahanand, B.; Savitha, R.; and Suresh, S. 2013. Computer aided diagnosis of adhd using brain magnetic resonance im-ages. InAustralasian Joint Conference on Artificial Intelli-gence, 386–395. Springer.
Menon, V. 2011. Large-scale brain networks and psy-chopathology: a unifying triple network model. Trends in cognitive sciences15(10):483–506.
Rav`ı, D.; Wong, C.; Deligianni, F.; Berthelot, M.; Andreu-Perez, J.; Lo, B.; and Yang, G. Z. 2017. Deep learning for health informatics. IEEE Journal of Biomedical and Health Informatics21(1):4–21.
Riaz, A.; Asad, M.; Al-Arif, S. M. R.; Alonso, E.; Dima, D.; Corr, P.; and Slabaugh, G. 2017. Fcnet: a convolutional neural network for calculating functional connectivity from functional mri. InInternational Workshop on Connectomics in Neuroimaging, 70–78. Springer.
Simons, J. S., and Spiers, H. J. 2003. Prefrontal and medial temporal lobe interactions in long-term memory.Nature Re-views Neuroscience4(8):637.
Skounti, M.; Philalithis, A.; and Galanakis, E. 2007. Varia-tions in prevalence of attention deficit hyperactivity disorder worldwide.European journal of pediatrics166(2):117–123. Song, X., and Lu, H. 2017. Multilinear regression for em-bedded feature selection with application to fmri analysis. InAAAI, 2562–2568.
Subbaraju, V.; Suresh, M. B.; Sundaram, S.; and Narasimhan, S. 2017. Identifying differences in brain activities and an accurate detection of autism spectrum disorder using resting state functional-magnetic resonance imaging: A spatial filtering approach. Medical image analysis35:375–389.
Vieira, S.; Pinaya, W. H.; and Mechelli, A. 2017. Using deep learning to investigate the neuroimaging correlates of psychiatric and neurological disorders: Methods and appli-cations.Neuroscience & Biobehavioral Reviews74:58 – 75. Yousefnezhad, M., and Zhang, D. 2017. Local discriminant hyperalignment for multi-subject fmri data alignment. In
AAAI, 59–65.