R E S E A R C H
Open Access
Simulating the yields of bioenergy and food
crops with the crop modeling software BioSTAR:
the carbon-based growth engine and the
BioSTAR ET
0
method
Roland Bauböck
Abstract
Background:With a growing production and use of agricultural substrates in biogas facilities, the competition between food and energy production, environmental issues, and sustainability goals has seen an increase in the last decade and poses a challenge to policy makers. Statistical yield data has a low spatial resolution and only covers standard crops and makes no statement in regard to yields under climate change. To support policy makers and regional planners in an improved allocation of agricultural land use, a new crop model (BioSTAR) has been developed.
Results:Simulations with weather and yield data from 7 years and four regions in Lower Saxony have rendered overall good modeling results with prediction errors (RMSE and percentage) ranging from 1.6 t and 9.8% for winter wheat to 2.1 t and 11.9% for maize. The model-generated ET0and ETavalues (mean of four locations) are lower than ET0/ETavalues calculated with the Penman-Monteith method but appear more realistic when compared to field trial data from northern and eastern Germany.
Conclusions:The model has proven to be a functioning tool for modeling site-specific biomass potentials at the farm level, and because of its Access® database interface, the model can also be used for calculating biomass yields of larger areas, like administration districts or states. Out of the seven crops modeled in this study, only limited yield and test site data was available for winter barley, winter rye, sorghum, and sunflower. For further improvement of model performance and model calibration, more trial data and data testing are required for these crops.
Keywords:Crop modeling; Energy crops; BioSTAR; Biomass potentials; Evapotranspiration modeling
Background
The demand for biomass from agricultural resources as an energy source is currently seeing a strong increase. This is particularly true for Germany, as the country is trying to double the share of bioenergy (agricultural,
forest, and waste biomass combined) to the country’s
energy total by the year 2020 [1].
In 2011, 2.2 million ha of the total agricultural area (17 million ha) was already in use for either energy crop production or renewable primary products. Of this area, 800,000 ha was in use for biogas crops, mainly maize,
900,000 ha for oilseed rape (mainly for biodiesel produc-tion) and, the smallest share, 250,000 ha for starch and bioethanol production. By 2020, the agricultural area in use for renewable resource production in Germany is projected to be further expanded and will then have a share of around 20% of the country’s total agricultural
area. Even though Germany’s food production is close
to self-sufficient today, a growing competition between food production, environmental issues, sustainability goals, and the production of energy and renewable pri-mary products is moving into the focus of policy makers and researchers. At present, the production of biogas from energy crops and agricultural wastes (manure and other residual materials) appears to be the most (land Correspondence:[email protected]
Department of Cartography, GIS and Remote Sensing, Research Project‘BIS’, University of Göttingen, Goldschmidtstraße 5, Göttingen 37077, Germany
resource) efficient way to use agricultural areas for en-ergy production. This is due to the relatively high enen-ergy yield of biogas per hectare [2]. This advantage of biogas is even higher when power-heat cogeneration technology is applied.
In an intensively used agricultural landscape, as it is the case in Germany, good management and farming practices and diverse crop rotation cycles are of import-ance, and the introduction of new energy crops into the existing crop rotation cycles can be beneficial for ecological reasons [3,4]. One research project working on this interdisciplinary topic is the currently running bioenergy project of the University of Göttingen [5].
On the contrary, using mainly maize as a substrate in biogas facilities can lead to monocultures, soil erosion, and nitrate problems in the drinking water. This is even exacerbated in areas where a lot of maize is already grown for animal feed as is the case in the western part of Lower Saxony.
Using a crop modeling tool, yield differences of differ-ent crop rotations and crops can be approximated and optimized solutions, with economical as well as eco-logical perspectives in view, can be found out.
Crop models have been in existence for about four decades now [6]. Resource capture of an agricultural crop can be implemented in a model in different ways. Commonly used approaches are either carbon-based [7], ra-diation use efficiency (RUE)-based [8], water productivity-based (WP) [9], or transpiration-productivity-based (BTR) [10].
BioSTAR’s primary growth engine is carbon-based,
and it uses an asymptotic exponential light response curve [11]. Among the well-known crop models, the RUE approach is probably the one which is most often used. Examples for crop models with this type of growth engine are CropSyst [12], APSIM [13], CERES (DSSAT) [14], and LINTUL. Carbon-based growth engines are used in all of the older models from Wageningen such as WOFOST and in the model CROPGRO (DSSAT).
The water productivity approach is relatively new [15], and it has been implemented in the model AquaCrop [16]. The transpiration-based growth engine (BTR) is used as a second growth engine in the model CropSyst. Because the Tanner-Sinclair relationship becomes un-stable at low VPD, the RUE method is used as a main growth engine in the model CropSyst.
Even though there are numerous crop models in exist-ence today, no single model can claim to adequately cover all possible demands a user might put to such a model. One big advantage of developing a new model is the ability to structure and build the model according to user specifications and to be able to modify it and add on to it to suit future demands.
The crop model Biomass Simulation Tool for Agricul-tural Resources (BioSTAR) [17,18] has been developed
to simulate climate and soil-dependent biomass yields for bioenergy crops, but obviously it can also be used to predict yields for food crops like wheat or rye. The model’s software is built in such a way that, depending on the resolution of the input data, large-scale (single plots or farms) or small-scale (larger areas with many input datasets) yield predictions can be generated very easily. Novelties in the BioSTAR crop modeling software are a MS Access® database connection for fast data editing and organization and the possibility to choose between four different growth engines and four ET0 methods. Validation runs for several agricultural crops
grown in Lower Saxony have proven the models’
capabil-ity to serve as a user-friendly biomass simulation tool for small- and large-scale agricultural planning.
Results and discussion
Biomass yields
To validate the model BioSTAR, yield, soil, and climate data from five different locations in Lower Saxony, Germany have been used. The first two locations are farm plots in Hedeper and in Troegen. The other two are field trial sites of the Chamber of Agriculture of Lower Saxony (LWK), situated in Poppenburg and in Werlte. Winter wheat and maize were grown at all four localities, sunflower, sorghum, winter rye, and winter barley only in Poppenburg and Werlte, and sugar beet only in Hedeper.
The overall simulation results (all have been per-formed with the carbon-based growth engine and the
BioSTAR ET0method) have shown that the model
pre-dicts biomass yields at a good level of accuracy, though differences between cultures exist (Table 1). For the cul-ture sugar beet (in the following referred to as beet), the analysis has been divided up into three parts: (1) all soil types, (2) clay soil types, and (3) no clay soils. This has been done to distinguish the unique reaction (overesti-mation) of beet to soils with high clay contents. The model produced the lowest error values (root-mean-square error (RMSE) and percentage error) for winter wheat (RMSE = 1.6 t and 10.1%), sorghum (RMSE = 1.0 t and 5.9%), winter barley (RMSE = 1.8 t and 11.0%), win-ter rye (RMSE = 1.9 t and 10.4%). Beet (clay), beet (no clay), and beet (all) simulation results show up with er-rors of 10.7%, 10.8%, and 11.4%, respectively, and an RMSE of 1.7 t on clay and 2.4 t for the other two. Sun-flower and maize results show errors of 12.0% and 11.9% and RMSE values of 1.6 and 2.1 t, respectively. All crops combined in one analysis show up with mid-range error values (RMSE 2.1 t and 12.2%). The percentage error values have been calculated by dividing the RMSE by the mean observed yield (both are in tons per hectare).
resulting order of the crops is a different one. Now maize and beet (clay) are ranked first, both with a WIA of 0.94 followed by winter wheat (0.86), beet (no clay) (0.85), and sorghum (0.78). The lower ranks are now occupied by beet (all) (0.77), winter rye (0.73), winter barley (0.64), and sunflower (0.56). All crops combined in one analysis have achieved a high WIA of 0.92.
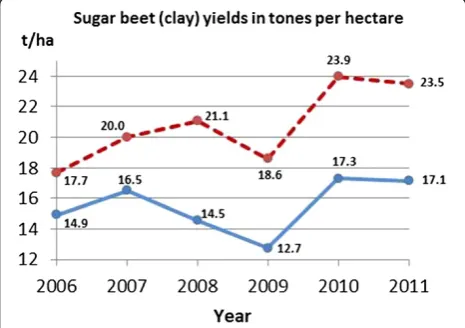
The low WIA values for the winter grains (other than winter wheat) can be explained by an approximately equal over- and underestimation of the observed results (and pos-sibly a low number of samples), whereas the predicted bio-mass for beet on clay type soils is exclusively overestimated at a similar level (Figure 1). Sorghum yields have been cal-culated well for the years 2008/2009 but were then
overesti-mated at a high level in 2010 (Figure 2). Sunflower’s
biomass yield is predicted well in 4 years and then overesti-mated highly in 2007 (Figure 3). To some extent, this could be the result of a fungus infection (Sclerotinia sclerotiorum) which has reportedly [19] damaged the sunflower crops in the extremely rainy summer of 2007.
The overall reaction of the model in response to inter-annual climatic variations is at a good level of accuracy with the curves of the predicted vs. the observed bio-mass yields following the same pattern (Figure 4). This is particularly true for maize (Figure 5), winter barley and winter rye (Figure 6), winter wheat (Figure 7), and sugar beet (no clay) (Figure 8). The corresponding curves of beet (clay), beet (all) (Figures 1 and 9), sor-ghum (Figure 2), and sunflower (Figure 3) display some deviations from the inter-annual trend.
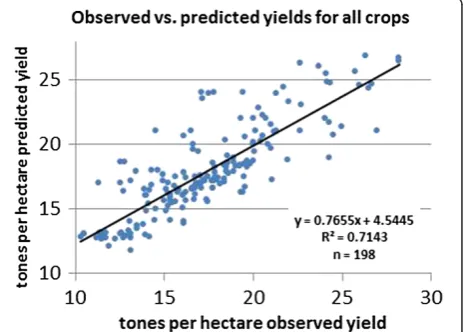
For all crops combined in one analysis, a linear
regres-sion analysis has been performed. The R2 value (0.71)
for the whole dataset (observed vs. predicted yields) is at a satisfactory level (Figure 10) and has a high correlation (Pearson correlation coefficient of 0.845 at a highly significant level ofα≤0.01).
Evapotranspiration levels
Unlike other crop models, BioSTAR can generate its own crop and phenology-dependent potential transpiration
Table 1 Mean for observed and simulated yields, RMSE, percentage error, and WIA for tested crops
Mean observed Mean simulated RMSE Number Percentage error WIA
Maize 17.7 18.2 2.1 31 11.9 0.94
Winter wheat 15.8 16.1 1.6 102 10.1 0.86
Beet (all) 21.0 21.8 2.4 40 11.4 0.77
Beet (clay) 15.9 21.1 1.7 8 10.7 0.94
Beet (no clay) 22.3 21.9 2.4 32 10.8 0.85
Winter barley 16.3 16.1 1.8 6 11.0 0.64
Winter rye 18.3 18.7 1.9 6 10.4 0.73
Sunflower 13.3 13.4 1.6 9 12.0 0.56
Sorghum 17.0 17.3 1.0 5 5.9 0.78
All crops 17.2 17.7 2.1 198 12.2 0.92
WIA, Willmott index of agreement (1 = perfect agreement, 0 = no agreement). Mean observed, mean simulated, and RMSE (root-mean-square error) given in tones dry mass per hectare.
Figure 1Inter-annual comparison of observed (full line) and predicted (broken line) yields for beet (clay).
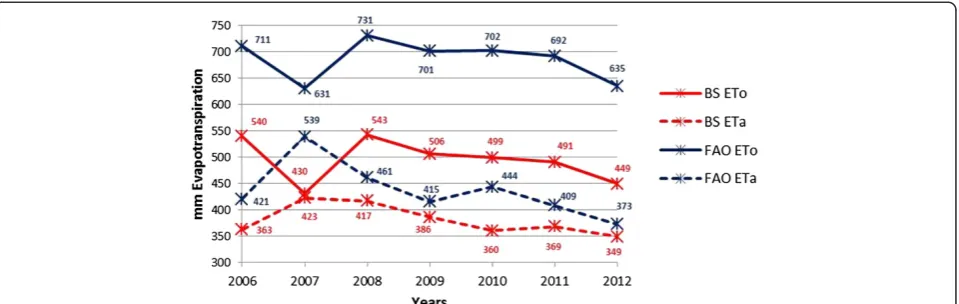
rates (see ‘Main model processes’) to which a leaf area-dependent soil evaporation value is added. In Figure 11, the mean values of all four locations of the simulation and all 7 years of the BioSTAR ET0(potential
evapotranspir-ation) and ETa (actual evapotranspiration) method are
displayed along with the corresponding Food and Agricul-ture Organization (FAO) (Penman-Monteith) values cal-culated for these years. For both calculations a maize crop with a cropping period from the end of April until the
be-ginning of September was chosen. ET0values calculated
with the BioSTAR method are considerably lower than their FAO method equivalents. To a lesser extent, this is
also true, when the ETa values of the two methods are
compared. The BioSTAR ET0and ETavalues range from
543 mm (2008) to 430 mm (2007) and from 423 mm (2007) to 349 mm (2012), respectively. The FAO curves for ET0and ETafollow a similar inter-annual trend but at levels which are approximately 200 mm (ET0) and 50 mm (ETa) above the BioSTAR values. The high ET0values of
the FAO calculation can be explained by the fact that no crop or phenology parameters have been considered here (grass reference evapotranspiration). Looking at the literature data for ETa values for northern and eastern Germany, the FAO values appear to be overestimated. Haferkorn [20] and Zenker [21] give ETavalues for various crops measured by lysimeters in eastern Germany, ranging from 280 to 530 mm (April until September), with average values around 350 mm. The DVWK [22] estimates the share of the evapotranspiration from May until September to be about 70% of the year’s total precipitation. Since Germany’s climate is of a humid character and average an-nual precipitation values range between 600 and 800 mm, annual evapotranspiration for this climate is not likely to be higher than 600 mm. In fact the DVWK gives an aver-age annual evapotranspiration value (ETa) of 433 mm for northern Germany. Eulenstein et al. [23] give annual ET0 values for eastern Germany for the years 1971 to 1998 ranging from 420 to 680 mm (the approximate mean is Figure 3Inter-annual comparison of observed (full line) and
predicted (broken line) yields for sunflower.
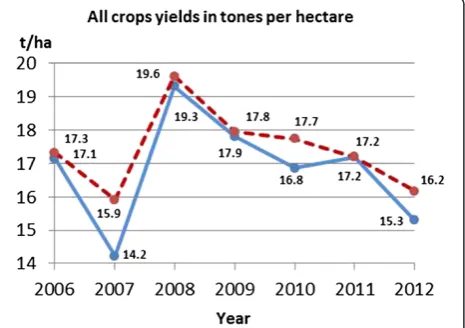
Figure 4Inter-annual comparison of observed (full line) and predicted (broken line) yields for all crops combined.
Figure 5Inter-annual comparison of observed (full line) and predicted (broken line) yields for maize.
around 570 mm). Additionally it needs to be mentioned that eastern Germany has a more arid and continental cli-mate than Lower Saxony.
In comparison with this data, the BioSTAR ET0 and
ETa values seem to be more realistic than the FAO
values and underline the relevance of this ET method for the computation of crop biomass potentials.
Conclusions
The performance of the crop model BioSTAR has been tested with datasets from four locations in Lower Sax-ony, Germany for seven agricultural crops. The model predicts biomass yields for all crops combined at a satis-factory level (mean error of 12.1%). The yields of all crops have been predicted by the model with errors ran-ging from 8.4% (winter wheat) to 12.1% (maize). The model has proven to be a functioning tool for modeling site-specific biomass potentials at the farm level. Because of its Access® database interface, the model can also
easily be used for the prediction of potential biomass yields of larger areas, like administration districts or states and can therefore serve as a decision support tool when questions of regional and trans-regional crop plan-ning are concerned. Because the model reacts adequately to inter-annual climatic differences, transferability to dif-ferent climates is probably possible but still needs to be validated. BioSTAR offers its own method for calculating evapotranspiration during the course of crop growth. The model-generated evapotranspiration levels are lower than the ones calculated using the Penman-Monteith ap-proach but seem to be closer to actually measured ET values in northern and eastern Germany.
Out of the seven crops modeled in this study, only limited yield and test site data was available for winter barley, winter rye, sorghum, and sunflower. For further improvement of model performance and model calibra-tion, more trial data and data testing are required here. Figure 7Inter-annual comparison of observed (full line) and
predicted (broken line) yields for winter wheat.
Figure 8Inter-annual comparison of observed (full line) and predicted (broken line) yields for beet (no clay).
Figure 9Inter-annual comparison of observed (full line) and predicted (broken line) yields for beet (all).
The reaction of the sugar beet yield development on clay-type soils still needs to be investigated further and improved in the model. Up to date (September 2013), the model is capable of simulating the general reaction of crops to water and nitrogen stress. To further expand the models’ range of application, soil salinity content and related salinity stress reaction of plants should be implemented in the model.
Grasses and perennial cultures like the cup plant (Silphium perfoliatum) or short rotation coppices like poplar or willow are potential cultures for bioenergy production in the German agricultural sector. Up to date (September 2013), the model BioSTAR is capable of modeling these cultures, but calibration and validation still have to be performed before the model can be used for yield prediction of these cultures.
Methods
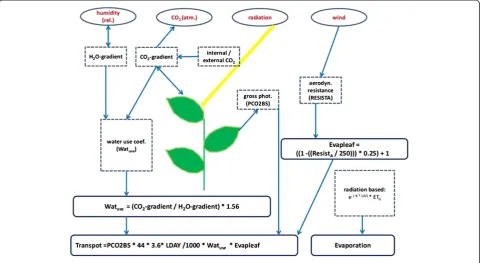
Main model processes
BioSTAR’s primary growth engine is carbon-based (see
above) and calculates a radiation and temperature-dependent gross CO2exchange rate in mmol CO2m−2s−1 (Equation 1).
Photorespiration (maintenance and growth) and nitrogen-induced photosynthesis inhibition are accounted for in
a second step. The remaining fraction of CO2 (net
photosynthesis) is then used to calculate a net photosynthesis-dependent transpiration rate. This is done using the gradients of the water vapor pressure
and of the CO2concentration inside the leaves to the
corresponding pressures of the atmosphere (Equations 2 to 5). Due to this calculation procedure, BioSTAR
does not need a separate ET0calculation (e.g., Penman,
FAO, Turc, or other) to compute crop transpiration (Figure 12):
PG¼Pmax1−expð−QePPFDI=PmaxÞ; ð1Þ
where PG is the gross photosynthesis rate (mmol CO2
m−2s−1), Qe is the initial light use efficiency (mmol CO2
mol−1 light quantum), PPFDI is the intercepted
photo-synthetic active radiation (mmol m−2 s−1), and Pmax is the maximum photosynthesis rate (mmol CO2m−2s−1).
H2Ograd:ððVPdefVolmolÞ=18Þ 1;000 ð2Þ
CO2grad:ðCO2con–ðCO2conCi=CaÞÞ=1;000 ð3Þ
Watuse: H2Ograd=CO2grad
1:56 ð4Þ
Transpot: Prate3:6Lday441;000
Watuse ð5Þ
Evapleaf:fð1−ðResistA=250ÞÞ 0:25g þ1 ð6Þ
Preduct:PnetðETa=ET0Þ Sreduct; ð7Þ
where H2Ograd is the H2O gradient from leaf to atmos-phere (mmol mol−1), VPdef is the vapor pressure deficit of the air (g m−3), Volmolis the volume of 1 mol dry air, CO2grad is the CO2 gradient from leaf to atmosphere (mmol mol−1), CO2con is the CO2 concentration of the atmosphere (ppm),Ci/Cais the internal-external CO2 ra-tio dimensionless, range approximately 0.1 to 1.0, Watuse is the H2O-CO2evolution ratio dimensionless, Transpot
is the CO2 assimilation-dependent potential
transpir-ation rate (L day−1), Prate is the CO2 assimilation rate (mmol CO2m−2s−1),Ldayis the daylight hours, Evapleaf is the aerodynamic resistance-dependent multiplier for leaf evaporation, ResistA is the aerodynamic resistance (s m−1), Preduct is the stomata conductance-induced photosynthesis reduction (g day−1), Pnet net photosyn-thesis (after respiration and nitrogen-induced reduction) (g day−1), and Sreduct is the function for water stress-induced photosynthesis reduction.
(Equation 6) and then added to a leaf area-dependent soil evaporation value. The resulting evapotranspiration value (ET0) is then used in the soil sub-model to check if enough water for evapotranspiration is available in the rooted layers of the soil profile. Soil water availability is de-fined by each layer’s individual soil water retention curve. If the available soil water, available for evapotranspiration (ETa), is smaller than the calculated ET0, biomass accumu-lation is lowered correspondingly (Equation 7).
Crop development and leaf area index (LAI) develop-ment are temperature driven and divided into two main stages: emergence until anthesis (development stages 0 to 1) and anthesis until ripeness (development stages 1 to 2). Maximum LAI is reached at development stage 1, and the curve of LAI development is modeled as a Gaussian integral (normal distribution).
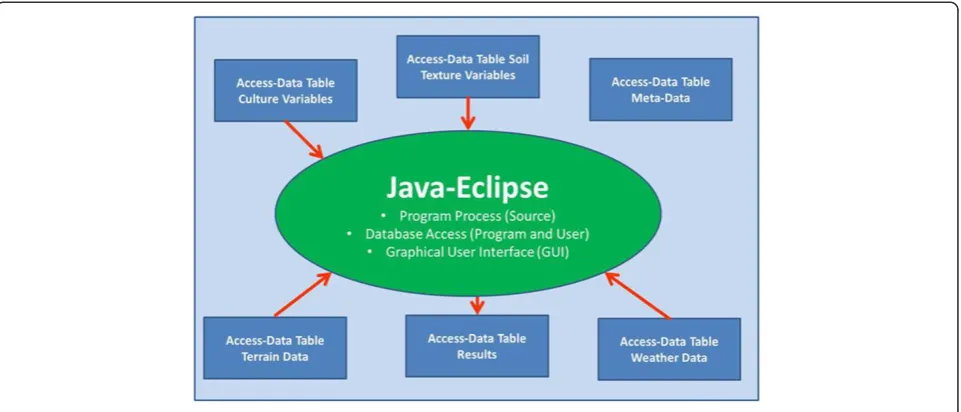
Software architecture and model features
The BioSTAR software is written in Java and uses a con-nection to Microsoft Access® database tables to read in-put data and write outin-put data (Figure 13 and Table 2).
Data can easily be imported into these tables from spreadsheets like Excel®, and output data can be ex-ported to a GIS for spatial visualization via the dbf for-mat. One advantage of this software architecture is that all relevant data for running simulations is stored in one Access® database which contains different tables storing location, weather, crop, and soil texture variables. For each simulation run (combination of location and wea-ther data), a new result table is generated in the
database. Because all parameters (for crops and soil) are stored in the same database file, editing and comparison of the contents is easily done. Running the model on a PC or laptop requires an installed version of Microsoft Access® (versions 2007 or later) and the installation of Java runtime environment (freeware). The model soft-ware itself is contained in an executable JAR file and does not need to be installed on the computer.
Model calibration and input data
The model has been calibrated and tested for different sites and years in Lower Saxony for the winter cereals wheat, rye, triticale, and barley, for maize, sorghum, and sugar beet, and for sunflower. Further cultures which have been implemented in the model are canola (oilseed rape), cup plant (S. perfoliatum), and the short rotation coppices poplar and willow, although no validation for these cultures has been performed so far.
and sorghum. The growth engine and ET0 method
set-tings used for these tests are CO2 and BioSTAR (see
above).
Statistical methods used for data analysis
For the interpretation of the model output data (model
performance), the Wilmott index of agreement [24]
(Equation 8) and the RMSE (root-mean-square error) (Equation 9) values have been calculated for all tested crops individually as well as all crops combined in one analysis (Table 1). For all crops combined, a linear
re-gression and the corresponding R2value have been
cal-culated (Figure 10). To see how the model reacts to inter-annual variations in climate, an inter-annual compari-son of the observed and simulated yields has additionally
been done for all crops combined and individually (Figures 1, 2, 3, 4, 5, 6, 7, 8, 9).
d¼1− ∑
n
i¼1 ðPi−OÞ−ðOi−OÞ 2
h i
∑n
i¼1 ðjPi−OjÞ þðjOi−OjÞ 2
h i ð8Þ
RMSE¼ n−1∑ni¼1ðPi−OiÞ2 −0:5; ð9Þ
wherePiis the instance of predicted value, Oiis the
in-stance of observed value, Ō is the mean of observed
values, RMSE is the root-mean-square error, anddis the Willmott index of agreement (0 = no agreement, 1 = per-fect agreement).
Table 2 Summary of model features
Features
Software
Data storage Fast data reading, writing, and editing due to MS Access® data table interface
Multiple sites Capability to process either individual sites or large datasets
Program type Program runs from an executable Java file
Data organization Soil, weather, crop, and result data are all kept in one database
Crop model
Growth engines User can choose between four growth engines and four ET0methods
Time step Daily or monthly climate data can be processed
Minimum data If data availability is limited, the model can be run with only daily mean temperature
Perennial crops Modeling of perennial crops like short rotation coppices or cup plant is possible
Soil model Computation of soil water budget in a one-dimensional 2-m soil profile with decimeter layer increments using van Genuchten soil texture parameters
Crop water stress Crop water stress simulation enhancement with crop-specific stress phase modeling
Crop development Crop development tracking with BBCH (EC) stages Figure 13Software architecture of the BioSTAR model.
Abbreviations
APSIM:agricultural production simulator; AquaCrop: FAO crop model; BBCH/ EC scale: growth scale of monocot and dicot plants; BioSTAR: Biomass Simulation Tool for Agricultural Resources; CERES: crop model in the DSSAT family; CROPGRO: crop model in the DSSAT family; CropSyst: cropping systems model; DSSAT: decision support system for agronomy transfer; ETa: actual evapotranspiration rate; ET0: potential (reference)
evapotranspiration rate; FAO: Food and Agriculture Organization;
LINTUL: crop model in the Wageningen family; LWK: Landwirtschaftskammer (Niedersachsen); RMSE: root-mean-square error; RUE: radiation use efficiency; VPD: vapor pressure deficit of the air; WIA: Willmott index of agreement; WOFOST: crop model in the Wageningen family.
Competing interests
The author declares that he has no competing interests.
Acknowledgements
The development of the model BioSTAR has been made possible by funds of the Lower Saxony Ministry of Sciences and Culture (Germany). The research group responsible for developing the model is part of the interdisciplinary research project‘Sustainable use of bioenergy: bridging climate protection, nature conservation and society,’sub-project 2.2‘bioenergy potentials.’
Received: 20 September 2013 Accepted: 6 December 2013 Published: 21 January 2014
References
1. BMWI-BMU:Energiekonzept für eine umweltschonende, zuverlässige und bezahlbare Energieversorgung.Berlin; 2010. http://www.iwo.de/fileadmin/ user_upload/Dateien/Standpunkte/Energiekonzept-2010.pdf.
2. FNR:Fachagentur für nachwachsende Rohstoffe.Basisdaten Bioenergie; 2011. http://mediathek.fnr.de/media/downloadable/files/samples/f/n/fnr_basisdaten_ 2012_web_neu.pdf.
3. Karpenstein-Machan M, Weber C:Energiepflanzenanbau für Biogasanlagen–Veränderungen in der Fruchtfolge und der Bewirtschaftung von Ackerflächen in Niedersachsen.Naturschutz und Landschaftsplanung.2010,42:312–320.
4. Ruppert H:Wege zum Bioenergiedorf–Leitfaden für eine eigenständige Wärme-und Stromversorgung auf Basis von Biomasse im ländlichen Raum.
3rd edition. Güstrow: FNR; 2010.
5. BiS-Project of the University of Goettingen: homepage (English).http://www. bioenergie.uni-goettingen.de/index.php?id=107.
6. Bouman BAM, van Keulen H, Van Laar HH, Rabbinge R:The‘School of de Wit’crop growth simulation models: a pedigree and historical overview.
Agr Syst1996,52:171–198.
7. De Wit CT:Photosynthesis of Leaf Canopies, Agricultural Research Report 663. PUDOC: Wageningen; 1965.
8. Monteith JL:Climate and the efficiency of crop production in Britain.
Philos Translat Royal Soc1977,281:277–294.
9. Steduto P, Hsiao TC, Ferres E:On the conservative behavior of biomass water productivity.Irrig Sci2007,25:189–207.
10. Tanner CB, Sinclair TR:Efficient water use in crop production: research or re-search?InLimitations to Efficient Water Use in Crop Production.Madison: American Society of Agronomy; 1983.
11. Boote K, Loomis R:The prediction of canopy assimilation. InModeling Photosynthesis–from Biochemistry to Canopy, CSSA Special Publication no.19. Madison: CSSA; 1991.
12. Stöckle C, Donatelli M, Nelson R:CropSyst, a cropping systems simulation model.Eur J Agron2003,18:289–307.
13. Keating B, Carberry PS, Hammer GL, Probert ME, Robertson MJ, Holzworth D, Huth NI, Hargreaves JNG, Meinke H, Hochman Z, McLean G, Verburg K, Snow V, Dimes JP, Silburn M, Wang E, Brown S, Bristow KL, Asseng S, Chapman S, McCown RL, Freebairn DM, Smith CJ:An overview of APSIM, a model designed for farming systems.Eur J Agron2003,18:267–288. 14. Jones JG, Porter C, Boote K, Batchelor W, Hunt L, Wilkens P, Singh U,
Gijsman AJ, Ritchie JT:The DSSAT cropping system model.Eur J Agron
2003,18:235–265.
15. Todorovic M, Albrizio R, Zivotic L, Abi MT, Stöckle C, Steduto P:Assesment of aqua crop, CropSyst, and WOFOST models in the simulation of sunflower growth under different water regimes.Agron J2009,101:508–521.
16. Steduto P, Hsiao TC, Ferres E:AquaCrop—the FAO crop model to simulate yield response to water: I: concepts and underlying principles.Agron J
2009,101:426–437.
17. Bauböck R:GIS-gestützte Modellierung und Analyse von Agrar-Biomassepotenzialen in Niedersachsen–Einführung in das Pflanzenmodell BioSTAR, PhD thesis. University of Göttingen; 2013. http://hdl.handle.net/ 11858/00-1735-0000-000E-0ABB-9.
18. Workgroup BioSTAR:Cartography, GIS and remote sensing section.University of Goettingen: homepage (English). http://www.uni-goettingen.de/en/ 431252.html.
19. LWK:Energiepflanzen in Niedersachsen–Anbauhinweise und Wirtschaftlichkeit.
Landwirtschaftskammer Niedersachsen; 2010. http://www.ml.niedersachsen. de/download/59388.
20. Haferkorn U:Größen des Wasserhaushaltes verschiedener Böden unter landwirtschaftlicher Nutzung im klimatischen Grenzraum des Mitteldeutschen Trockengebietes–Ergebnisse der Lysimeterstation Brandis, PhD thesis. University of Göttingen; 2000. http://hdl.handle.net/11858/00-1735-0000-000D-F107-4. 21. Zenker T:Verdunstungswiderstände und Gras-Referenzverdunstung
Lysimeter-untersuchungen Zum Penman-Monteith-Ansatz im Berliner Raum, Volume PhD thesis. TU Berlin: TU Berlin; 2003. http://nbn-resolving.de/urn/resolver. pl?urn:nbn:de:kobv:83-opus-6956.
22. DVWK:Merkblätter zur Wasserwirtschaft–Ermittlung der Verdunstung von land- und Wasserflächen.Bonn: Heft 238/1996.
23. Eulenstein F, Olejnik J, Willms M, Schindler U, Chojnicki B, Meißner R:
Mögliche Auswirkungen der Klimaveränderungen auf den Wasserhaushalt von Agrarlandschaften in Nord-Mitteleuropa. In
Wasserwirtschaft.Wiesbaden: Springer-Vieweg; 2006.
24. Willmott CJ:Some comments on the evaluation of model performance.
Bull Am Meteorol Soc1982,63:1309–1313. doi:10.1186/2190-4715-26-1
Cite this article as:Bauböck:Simulating the yields of bioenergy and food crops with the crop modeling software BioSTAR: the carbon-based growth engine and the BioSTAR ET0method.Environmental Sciences
Eur-ope201426:1.
Submit your manuscript to a
journal and benefi t from:
7Convenient online submission 7Rigorous peer review
7Immediate publication on acceptance 7Open access: articles freely available online 7High visibility within the fi eld
7Retaining the copyright to your article