R E S E A R C H A R T I C L E
Open Access
Design of experiment avenue for
development and validation of
RP-HPLC-PDA method for determination of
apremilast in bulk and in
in
-
house
tablet
formulation
Suraj R. Chaudhari
*and Atul A. Shirkhedkar
Abstract
Background:Apremilast is phosphodiesterase-4 and an immunomodulating agent used for treatment of refractory psoriatic arthritis.
Methods:The reversed-phase high-performance liquid-chromatography method for analysis of apremilast was developed and validated as per ICH guidelines. The separation of apremilast was performed on PrincetonSPHERE Ultima C18 column (250 mm × 4.6 mm, i.d., 5μm particle size) with photodiode array detection carried out at 231 nm. A Box–Behnken design with response surface methodology was executed out for optimization of chromatographic conditions of reversed-phase high-performance liquid-chromatography for finished desired chromatographic separation of apremilast from its formulation with less number of experimental trials. Three independent factors, namely methanol composition in the mobile phase, pH of an aqueous phase, and flow rate, were used to construct a mathematical model and study the effects of these
independent factors on responses such as retention time, theoretical plates, and tailing factor.
Results:Optimized experimental conditions for proposed work consists of methanol and water, pH 3.50 adjusted with ortho-phosphoric acid (70:30 %v/v) as a mobile phase at a flow rate 1 ml/min with a retention time was found to be 5.15 min. Accuracy study was completed at three different levels and was found in the range of 99.44–101.49%.
Conclusion:The 3D response surface graphs revealed that the methanol composition and pH of an aqueous phase were both most stringent factors affecting the responses. Thus, a new, precise, and accurate HPLC method was developed and validated and can be used for regular analysis of apremilast.
Keywords:Apremilast, HPLC, in-house tablets, Box–Behnken design, Validation
Introduction
Apremilast (APL) is a new therapeutic medicinal agent accepted for the management of psoriasis and psoriasis arthritis (Baumer et al.2007; Keating2017). APL is used as orally administered medicine and acts by inhibiting phosphodiesterase 4, which is inhibited intracellularly and responsible for inflammation by lowering the pro-portion of cAMP; needful for producing the pro- and
anti-inflammatory mediators (Rajiv 2004; Michalek et al.
2017). APL structurally is (Fig. 1) [N-[2-[(1S)-1-(3-ethox-y-4-methoxyphenyl)-2-methylsulfonylethyl]-1, 3 dioxoisoindol-4-yl] acetamide] (Man et al.2009). APL is a yellowish white amorphous powder which is insoluble in water and quickly soluble in methanol and acetonitrile. De-sign of experiments (DOE) has been often executed to optimize analytical methods because of its application, like a decrease in the total number of attempts that need be carried out bringing about less reagent utilization and ex-tensively lower laboratory task. Moreover, DOE permits the buildup of a statistical model that allows appraisal of the * Correspondence:[email protected]
Department of Pharmaceutical Chemistry, R.C. Patel Institute of Pharmaceutical Education and Research, Dist. Dhule, Shirpur, Maharashtra 424405, India
significance and also statistical acceptation of the vari-ous factor effects on the responses being examined and in addition assess the mutual interactions between them (Ferreira et al. 2007). Literature survey acknowl-edged that several analytical methods have been re-ported for optimization of chromatographic conditions in high-performance liquid-chromatography (HPLC) methods using Box–Behnken design (Gumustas et al.
2018; De Almeida Borges et al. 2013; Zacharis and Vastardi 2018; Dragomiroiu et al. 2015; Awotwe-Otoo et al.2012; Bai et al.2010; Beg et al.2012; Gomes et al.
2017; Ihssane et al. 2011; Jovanov et al. 2015; Mirza and Tan2001and Patel et al.2017).
Several analytical methods have been developed to estimate APL in pharmaceutical dosage form as well as in biological samples. These methods include HPLC, stability-indicating HPLC, UPLC-MS/MS, and UV-spectrophotometry (Xiong et al. 2016; Lonkar et al.
2017a; Chen et al.2016; Lonkar et al. 2017b; Landge et al. 2017; Ravisankar et al. 2017; Chaudhari and Shir-khedkar 2018; Chaudhari et al. 2018; Lu et al. 2017; Iqbal et al. 2016). Prior art search regarding analytical method for APL depicts that high-performance thin-layer chromatography method (Chaudhari and Shir-khedkar 2018) has been performed using DOE approach for determination of robustness of method as HPLC is more specific and sensitive. The proposed study focuses on development of HPLC method using design of experiment (DOE) approach, followed by validation.
Material and methods
Chemical and reagents
Pharmaceutical grade APL was purchased from Sigma-Aldrich (India); HPLC grade methanol, ortho phos-phoric acid and double-distilled water were purchased from Merck (Mumbai, India).
Instrumentation
The UFLC HPLC system (Shimadzu Corporation, Japan) consisted of model LC-20 AD binary pump, rehodyne in-jector with 20μl capacity per injection, CTO-10ASVP col-umn oven compartment, and photodiode array detector (SPD-M20A). The HPLC system was controlled by LC so-lution software version 1.25. All weighing operations for the proposed analysis were carried out with the help of SHIMADZU AUX-120 analytical balance. Separation of APL was performed on PrincetonSPHERE Ultima (250 mm × 4.6 mm × 5 μm) C18 column from Princeton
Chromatography INC, Cranbury South River Road, Cran-bury, NJ. The column temperature was maintained at 30 ° C. The binary mobile phase consisted of methanol:water (pH 3.50) 70:30% v/v. The mobile phase flow rate was maintained at 1 ml/min. The total analysis run time was less than 7 min with photodiode array detector (PDA) wavelength set to 231 nm.
Statistical engine
Design Expert® (Version 10.0.7), Stat-Ease Inc., Minneap-olis, MN, USA statistical software was utilized for optimization of the method. The remaining calculations for the analysis were performed by Microsoft excel 2010 software (Microsoft, USA).
Preparation of stock solution
The stock standard solution of APL (0.1 mg/ml) was prepared by dissolving 10 mg of APL in 100 ml of mobile phase.
Preparation of sample
As the pharmaceutical formulation of APL is not obtain-able in the local Indian market, hence in-house tablets were prepared with 30 mg of APL and frequent excipients. The sample solution was prepared fromin-house formu-lated APL tablets. Accurately weighed power drug equiva-lent to 30 mg, APL was quantitatively transferred into 100 ml volumetric flask dissolved and diluted volume with methanol. The solution was filtered through a 0.45μm fil-ter (Millifilfil-ter, Milford, MA, USA). From the filtrate, an appropriate volume of solution was diluted to get a final concentration 6μg/ml using mobile phase.
Chromatographic conditions
Chromatographic separation of APL was carried out on PrincetonSPHERE Ultima (250 mm × 4.6 mm × 5μm) C18
analytical column at ambient temperature; mobile phase consisted of methanol:water (70:30%v/v, pH 3.5) and the pH of aqueous phase were adjusted with orthophosphoric acid. Before the analysis, mobile phase was filtered through a 0.2μm Ultipor N66Nylon 6, 6 membrane and
20μl was an injected and the chromatogram was moni-tored at a detection wavelength of 231 nm.
Optimization of RP-HPLC-PDA method
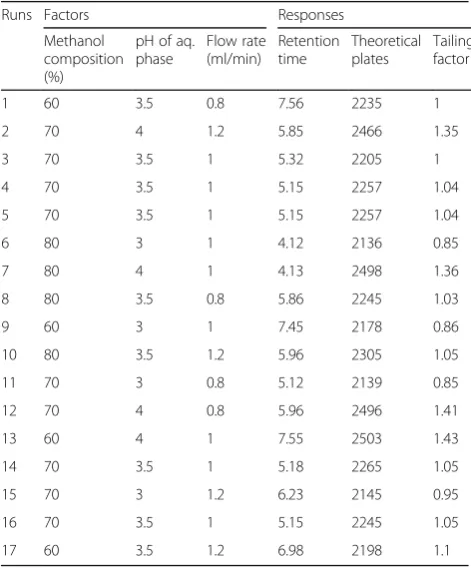
Initially, trial and error method was applied to gain knowledge about the method performance and recogni-tion of various vital independent parameters and its ef-fect on dependent variables. The prime importance of developing RP-HPLC method mainly separates the APL from its degradants and recommended that the reso-lution is greater than 2.0. Further, the Box–Behnken de-sign with response surface was employed for optimization of experimental conditions of the method. In the present investigation, experiments were planned and conducted according to the Box–Behnken design. The independent factors used in the present investiga-tion had three levels resulting in total 17 experimental runs was shown in Table1. The stated value for all three factors, namely (A) methanol composition, pH of aq. mobile phase, and flow rate, were 70%, 3.5 pH, and 1 ml/min. A Box–Behnken statistical screening design was used to optimize the compositional parameters and to evaluate quadratic effects of the methanol compos-ition in the mobile phase, pH of aq. mobile phase, and flow rate on the retention time (Rt), theoretical plates, and tailing factor. The linear polynomial equations are generated from ANOVA, depicted below.
Y¼boþb1x1þb2x2þb3x3þb12x1x2þb13x1x3 þb23x2x3þb11x22þb22x22þb33x23
Where ‘y’ is the measured response (dependent vari-able) connected with each factor level combination; ‘b0’
symbolizes the polynomial equation intercept represent-ing average arithmetic mean of all quantitative outcomes of 17 runs and ‘b1–b33’ is regression coefficients
com-puted from the observed experimental values of ‘y,’ ‘y1,’ ‘y2,’ ‘x1,’ ‘x2,’ and ‘x3’ represent the coded levels of
inde-pendent variables. Where x1: methanol composition in
mobile phase, x2: pH of mobile phase, x3: flow rate
re-spectively, for x1, x2, and x3. The considered responses
were retention time (y1), theoretical plates (y2), and
tail-ing factor (y3). In this situation, methanol volume was
selected as 60% to 80%. While pH of mobile phase was fixed between 3 and 4 appropriately, similarly flow rate was put up between 0.8 to 1.2 ml/min respectively. The statistical analysis was performed using Design Expert® (Version 10.0.7), Stat-Ease, Inc. 2021 East Hennepin Ave., Suite 480 Minneapolis, MN 55413, USA.
Validation of method
The proposed method was validated in accordance with the International Conference of Harmonisation (2005), for various parameters like system suitability, % recovery, precision, detection and quantification limit, robustness, ruggedness specificity, and force degradation study.
System suitability
In order to perform system suitability studies, six repli-cate injections of 10μg/ml standard solution of APL was injected and analyzed with HPLC. The results of system suitability parameters were studied for capacity factor, tailing factor, theoretical plate, and peak area.
Linearity study
The linearity study of the proposed method was examined as per the International Conference on Harmonization (ICH) guidelines. The calibration curve for APL was obtained in the concentration range of 2–12μg/ml; further, the calibration curve was constructed within peak area versus concentration. The regression equation was Y= 10,304x+ 13,583 and regression coefficientr2= 0.998.
Accuracy
The accuracy of a commenced investigation was ap-praised by standard addition methods, where a known amount of the standard was added in three different levels, i.e., 80, 100, and 120% toin-housetablet formu-lation of APL and analyzed by the commenced method in a set of three. The % recovery studies for APL were Table 1Box–Behnken design experimental runs
Runs Factors Responses
Methanol composition (%)
pH of aq. phase
Flow rate (ml/min)
Retention time
Theoretical plates
Tailing factor
1 60 3.5 0.8 7.56 2235 1
2 70 4 1.2 5.85 2466 1.35
3 70 3.5 1 5.32 2205 1
4 70 3.5 1 5.15 2257 1.04
5 70 3.5 1 5.15 2257 1.04
6 80 3 1 4.12 2136 0.85
7 80 4 1 4.13 2498 1.36
8 80 3.5 0.8 5.86 2245 1.03
9 60 3 1 7.45 2178 0.86
10 80 3.5 1.2 5.96 2305 1.05
11 70 3 0.8 5.12 2139 0.85
12 70 4 0.8 5.96 2496 1.41
13 60 4 1 7.55 2503 1.43
14 70 3.5 1 5.18 2265 1.05
15 70 3 1.2 6.23 2145 0.95
16 70 3.5 1 5.15 2245 1.05
carried out by spiking three different amount of APL standard (80, 100, and 120%) to the in-house tablet formulation. The % recovery of APL was estimated for each level.
Precision
The precision of the commenced analysis was evalu-ated by carrying out by intra-day and inter-day preci-sion. The three sets of three different concentrations, i.e., 4, 8, and 10 μg/ml, of APL was analyzed on the same for repeatability and continuous 3 days for intermediate precision.
Detection limit and quantification limit
The detection limit and quantification limit of the present study were assessed from the standard deviation of the peak area and the slope of the linearity curve of APL. The detection limit was communicated as a signal-to-noise ratio of 3:1, while quantification limit was indicated as signal-to-noise ratio 10:1; as a result of the detector response. The different concentrations of 2–4 μg/ml were prepared and tested. The % RSD was calculated.
Specificity
Chromatogram ofin-housetablet mixture was compared with the standard as well as with blank to revel obstruc-tion of excipients. But the chromatogram of the mixture was not showing any eloquent interference at the reten-tion time of APL.
Robustness
Robustness can be interpreted as the capability to re-produce the (analytical) method in diverse laborator-ies or under different conditions without the occurrence of unexpected differences in the obtained results, and a robustness test as an experimental set-up to evaluate the robustness of a method. To check the capability of the proposed method, different factors were knowingly changed like a change in col-umn oven temperature (25–35 °C), detection wave-length (228–232 nm), and injection volume (15– 25 μl).
Results and discussion
Optimization and development of RP-HPLC-PDA method using Box–Behnken design
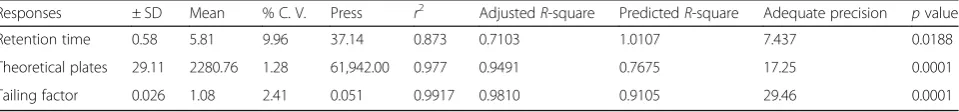
In proposed investigation, 17 experimental runs were performed and analyzed for obtained results of reten-tion time, theoretical plates, and tailing factors in accord with the Box–Behnken design. Further investi-gation was performed using response surface method-ology (RSM) to evaluate the relationship between the dependent responses and independent variables (factors) using obtained data was reported in Table 1. The model was also validated by analysis of variance (ANOVA) using design expert software, and the results are as presented in Table 2. Based on press value, a quadratic model was selected for responses such as retention time, theoretical plates, and tailing factor of APL. The significant effects showed p value less than 0.05, while the low standard deviation (% C.V) and a high adjustedR-square value indicated a good rela-tionship between the experimental data and those of the fitted model. The predictedR-square value was in accept-able concordance with the adjustedR-square value for all responses.
The final equation in terms of actual compo-nents and factors which can be used to make pre-dictions about the response for given levels of each factor,
Retention time¼ þ5:19−1:18x1þ0:071x2þ0:065x3 −0:023x1x2þ0:17x1x3−0:31x2x3 þ0:75x21−0:089x22þ0:69x23
ð1Þ
Theoretical plates¼ þ2245:80þ8:75x1þ170:62x2 −0:13x3þ9:25x1x2þ24:25x1x3 þ9:00x2x3þ8:60x21þ74:35x22 −8:65x23
ð2Þ
Tailing factor¼1:04−0:012x1þ0:25x2þ0:020x3 0:015x1x2−0:020x1x3−0:040x2x2 −3:000E−003x21
þ0:092x2
2þ0:612x23
ð3Þ
A positive value represents an effect that favors optimization while a negative value indicates an inverse relationship between the factors and the responses. 3-D
Table 2ANOVA results
Responses ± SD Mean % C. V. Press r2 AdjustedR-square PredictedR-square Adequate precision pvalue Retention time 0.58 5.81 9.96 37.14 0.873 0.7103 1.0107 7.437 0.0188
Theoretical plates 29.11 2280.76 1.28 61,942.00 0.977 0.9491 0.7675 17.25 0.0001
response surface plots revealed the effect of factors such as methanol composition in a mobile phase, pH of aq. mobile phase, and flow rate of HPLC system on the responses re-tention time, theoretical plates, and tailing factor. The representative plots for responses are presented in Fig.2, in which the interaction between variables factors A and B and their mutual dependence is clearly observed, while factor C is kept constant. Figure2a indicates that methanol com-position in mobile phase showed a prominent effect on re-tention time. The rere-tention time is increased with decreased in methanol composition in the mobile phase and increased or decreased in pH of aqueous mobile phase; there is not show any effect on retention time. The retention time
not show any significant effect on tailing factor was shown in Fig.2f, g.
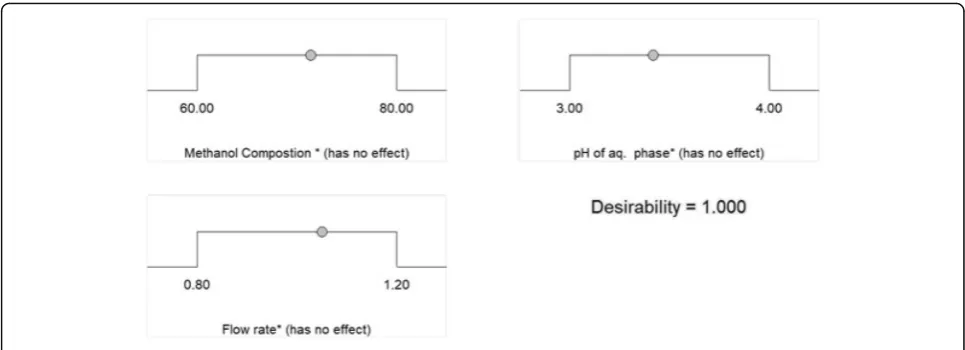
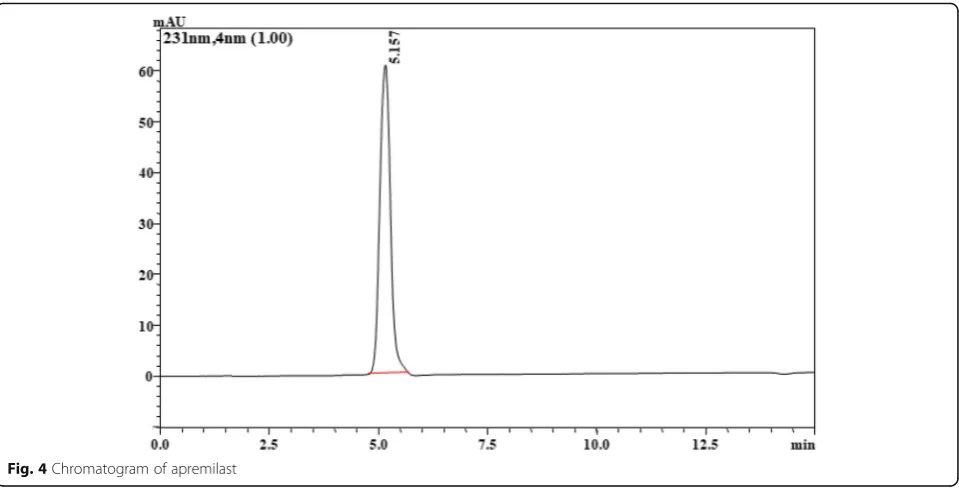
During numerical optimization shown in Fig. 3, the Box–Behnken design presented 30 solutions for optimized chromatographic conditions, but the solutions were reduced by setting the goals. Different limitations for factors and responses were sets and one solution was selected for optimization of chromatographic conditions. It was clearly shown that the experiential value of chromatographic condition was very nearer to the anticipated value. Hence the optimized chromato-graphic conditions, methanol composition (70%), flow rate (1 ml/min), and pH of aqueous mobile phase (3.5), respectively the chromatogram of APL were shown in Fig. 4.
Validation
The optimized chromatographic conditions were aggran-dized applied to validation of assertion for the system suitability, linearity, accuracy, precision, sensitivity, se-lectivity and robustness.
System suitability
System suitability tests are referred for assessing chromatographic system before the sample ana-lysis can start. The system suitability estimated by six represents analysis of 10 μg/ml concentra-tion of APL. The system suitability testing was evaluated and % RSD (percent relative standard deviation) was commencing less than 2% confine demonstrating appropriateness of strategy ad-vancement. The results were shown in Table 3.
Linearity
The calibration curve for APL was constructed and the linearity was obeyed in the given concentration range of 2–12 μg/ml of APL which depicts excellent correlation coefficientr2= 0.998.
Accuracy
The accuracy study was examined by the standard addition method testing the three unequal concentra-tions 3.2, 4, and 4.8 μg/ml of APL. The % recovery was found in the range of 99.44–101. Then, 49% with % RSD values were within the range 0.71–0.88 and fulfilling the acknowledgment criteria for the examination.
Precision
For the assessment of precision of the method, three distinct concentrations of APL were deter-mined by assay at distinctive time period on the same day and by alteration for the three succes-sive days (intra-day and inter-day precision) ac-cording to the ICH guidelines. The proposed developed method displayed the % RSD for intra-day and inter-day precision were in the range of 0.15–0.77 and 0.17–0.78%. The results of precision study were epitomized in Table 4.
Sensitivity
Sensitivity of proposed method was determined using the formulas DL = 3.3 α/S and QL = 10 α/S. The de-tection limit and quantification limit (DL and QL) were found to be 0.015 and 0.416 μg, respectively for APL.
Robustness
The robustness of the present analysis was per-formed by executing small intended modification in chromatographic circumstances. The robustness study of commenced method were evaluated using different factors such as column oven temperature (25–35 °C), detection wavelength (228–232 nm), and injection volume (15–25 μl). The influence of each of the factors was predicated and none of the factors go beyond the utmost and in this way dem-onstrated the studied independent variables did not influence the results. Besides, the commence method was found to be specific as the excipients did not show a bit of interference at a retention time of APL. The summary of the proposed method was shown in Table5.
Analysis ofin-housetablet formulation
The proposed RP-HPLC-PDA method was used to esti-mate APL in prepared in-house tablet formulation. The
% amount of drug found in triplicate analysis for APL was found to be 98.85 ± 0.13%, respectively. In the future, the developed method can be frequently used for analysis of APL.
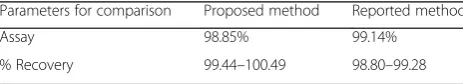
Comparison of proposed method with reported method
The assay and % recovery studies of APL using proposed method was compared with reported RP-HPLC method (Lonkar et al. 2017b). On the basis of results obtained for assay and % recovery studies, proposed method is comparable with the existing reported method (Table 6).
Fig. 4Chromatogram of apremilast
Table 3System suitability results
Parameters Estimates
Retention time (min) 5.15
Theoretical plates 2257
Tailing factor 1.045
Capacity factor 1.063
Table 4Precision study
Standard concentration (μg/ml)
Amount found (μg/ml)
% Amount found (μg/ml) (n= 3)
% RSD
Intra-day precision
4 3.98 99.69 0.15
8 8.07 100.89 0.31
10 10.14 101.44 0.77
Inter-day precision
4 3.94 98.61 0.17
8 8.07 100.87 0.82
10 9.56 98.63 0.98
Conclusion
A precise, accurate, rugged, cost-effective, and ro-bust RP-HPLC method using Box–Behnken prin-ciples has been developed for estimation of APL in bulk and in in-house tablet dosage form. By employing the DOE approach, Box–Behnken de-sign permitted assessment of the independent fac-tors simultaneously with addition of mutual interactions between the factors in order to optimize experimental conditions. According to the response surface plots, the methanol compos-ition was found to be the most inflexible factor for retention time. The pH of aqueous mobile phase was found to be a more deliberate factor for tailing factor as well as for theoretical plates. It is understood that the utilization of design of experiment approach is an adaptable practice to decrease the total experimental runs required for the optimization and development of RP-HPLC method can create most extreme data within a short duration of time. The excellent % recovery
of a drug shows that the excipients present in the tablet formulation have no obstruction in the de-termination of APL. The optimized chromato-graphic conditions of the proposed method confirmed that the proposed study was accurate, precise, rugged, and robust. Therefore, the devel-oped method can be used for the regular analysis of APL in bulk and in a pharmaceutical formula-tion. The proposed method was also compared with the reported method and found comparable.
Abbreviations
APL:Apremilast; BBD: Box–Behnken design; DL and QL: Detection limit and quantification limit; DOE: Design of experiments; HPLC: High-performance liquid-chromatography; ICH: International Conference on Harmonization; PDA: Photodiode array detector; RSM: Response surface methodology; Rt: Retention time
Acknowledgments
We acknowledge our sincere thanks to R. C. Patel Institute of Pharmaceutical Education and Research Shirpur, Dist: Dhule (MS) 425 405.
Funding Not applicable
Availability of data and materials Not applicable
Authors’contributions
SRC executed experimental and method development work. AAS organized a preliminary draft of the article. Both authors read and approved the final manuscript.
Competing interests
The authors declare that they have no competing interests.
Publisher’s Note
Springer Nature remains neutral with regard to jurisdictional claims in published maps and institutional affiliations.
Received: 20 November 2018 Accepted: 11 February 2019
References
Awotwe-Otoo D, Agarabi C, Faustino PJ, Habib MJ, Lee S, Khan MA, Shah RB. Application of quality by design elements for the development and optimization of an analytical method for protamine sulfate. J Pharm Biomed Anal. 2012;62:61–7.https://doi.org/10.1016/j.jpba.2012.01.002.
Bai XL, Yue TL, Yuan YH, Zhang HW. Optimization of microwave-assisted extraction of polyphenols from apple pomace using response surface methodology and HPLC analysis. J Sep Sci. 2010;33:3751–8.https://doi.org/ 10.1002/jssc.201000430.
Baumer W, Hoppmann J, Rundfeldt C, Kietzmann M. Highly selective
phosphodiesterase 4 inhibitors for the treatment of allergic skin diseases and psoriasis. Inflamm Allergy Drug Targets. 2007;6:17–26.https://doi.org/10.2174/ 187152807780077318.
Beg S, Kohli K, Swain S, Hasnain MS. Development and validation of RP-HPLC method for quantitation of amoxicillin trihydrate in bulk and pharmaceutical formulations using Box-Behnken experimental design. J Liq Chromatogr Relat Technol. 2012;35:393–406.https://doi.org/10.1080/10826076.2011.601493. Chaudhari SR, Patil AS, Shirkhedkar AA. Studies on derivative spectroscopy and
area under curve UV-spectrophotometric methods for estimation of Apremilast in bulk andin-house Tablets. Asian J Pharm Res. 2018;8:11–6.
https://doi.org/10.5958/2231-5691.2018.00003.5.
Chaudhari SR, Shirkhedkar AA. Application of Box-Behnken Design for Validation of high-performance thin-layer chromatography/densitometry method for robustness determination of Apremilast in bulk andin-housetablets. Pharm Methods. 2018;9:9–15.https://doi.org/10.5530/phm.2018.1.3.
Table 5Summary of regression, validation, andin-housetablet assay parameters for proposed RP-HPLC-PDA method
Validation parameters Results
Regression coefficient 0.998
Slope 13583
Intercept 10304x
Linearity range (μg/ml) 2–12
Intra-day precision (n= 3, RSD, %) 0.15–0.77 Inter-day precision (n= 3, RSD, %) 0.17–0.98 Repeatability (n= 3, RSD, %) 1.66
Accuracy 99.44–100.49
DL (μg) 0.015
QL (μg) 0.41
Ruggedness
Analysts I (n= 3, RSD, %) 1.59 Analysts II (n= 3, RSD, %) 1.27
Robustness Robust
Specificity Specific
In-housetablet assay 98.85 ± 0.13 nnumber of determinations
Table 6Comparison of proposed method with the reported methods for analysis of APL (Lonkar et al.2017a,2017b)
Parameters for comparison Proposed method Reported method
Assay 98.85% 99.14%
Chen L-g, Wang Z, Wang S, Li T, Pan Y, Lai X. Determination of apremilast in rat plasma by UPLC–MS-MS and its application to a pharmacokinetic study. J Chromatogr Sci. 2016;54:1336–40.https://doi.org/10.1093/chromsci/bmw072. De Almeida Borges VR, Ribeiro AF, de Souza Anselmo C, Cabral LM, de Sousa VP.
Development of a high performance liquid chromatography method for quantification of isomersβ-caryophyllene andα-humulene in copaiba oleoresin using the Box-Behnken design. J Chromatogr B. 2013;940:35–41.
https://doi.org/10.1016/j.jchromb.2013.09.024.
Dragomiroiu GTAB, Cimpoieşu ADINA, Ginghina O, Baloescu C, Barca M, Popa DE, Ciobanu AM, Anuta V. The development and validation of a rapid HPLC method for determination of piroxicam. Farmacia. 2015;63:123–31. Ferreira SC, Bruns RE, Ferreira HS, Matos GD, David JM, Brandao GC, da Silva EP,
Portugal LA, Dos Reis PS, Souza AS, Dos Santos WNL. Box-Behnken design: an alternative for the optimization of analytical methods. Anal Chim Acta. 2007;597:179–86.https://doi.org/10.1016/j.aca.2007.07.011.
Gomes SV, Portugal LA, dos Anjos JP, de Jesus ON, de Oliveira EJ, David JP, David JM. Accelerated solvent extraction of phenolic compounds exploiting a Box-Behnken design and quantification of five flavonoids by HPLC-DAD in Passiflora species. Microchem J. 2017;132:28–35.https://doi.org/10.1016/j. microc.2016.12.021.
Gumustas M, Caglayan MG, Onur F, Ozkan SA. Simultaneous determination and validation of emtricitabine, rilpivirine and tenofovir from biological samples using LC and CE methods. Biomed Chromatogr. 2018;32:4158.https://doi. org/10.1002/bmc.4158.
Ihssane B, Charrouf M, Abourriche A, Abboud Y, Bouabidi A, Bennamara A, Saffaj T. Optimization and validation of a new high-performance liquid chromatographic method for analysis of acetazolamide in tablets using Box-Behnken statistical experiment design. Acta Chromatogr. 2011;23:41–57.
https://doi.org/10.1556/AChrom.23.2011.1.2.
International Conference of Harmonisation. Q2 (R1), validation of analytical procedures: text and methodology. In: International Conference on Harmonization, Geneva; 2005. p. 11–12.
Iqbal M, Ezzeldin E, Al-Rashood ST, Imam F, Al-Rashood KA. Determination of apremilast in rat plasma by UPLC–MS/MS in ESI-negative mode to avoid adduct ions formation. Bioanalysis. 2016;8:1499–508.https://doi.org/10.4155/ bio-2016-0098.
Jovanov P, Guzsvány V, LazićS, Franko M, SakačM,ŠarićL, Kos J. Development of HPLC-DAD method for determination of neonicotinoids in honey. J Food Compos Anal. 2015;40:106–13.https://doi.org/10.1016/j.jfca.2014.12.021. Keating GM. Apremilast: a review in psoriasis and psoriatic arthritis. Drugs. 2017;
77:459–72.https://doi.org/10.1007/s40265-017-0709-1.
Landge SB, Dahale SB, Jadhav SA, Solanki PV, Bembalkar SR, Mathad VT. Development and validation of stability indicating rapid RP-LC method for determination of process and degradation related impurities of Apremilast, an anti-inflammatory drug. Am J Anal Chem. 2017;8:380.https://doi.org/10. 4236/ajac.2017.86029.
Lonkar N, Dole M, Sawant S. Development and validation of
UV-spectrophotometric method for the estimation of apremilast in bulk form by absorbance maxima method. W. J Pharm Pharm Sci. 2017b;6:758–66.https:// doi.org/10.20959/wjpps20177-9437.
Lonkar N, Sawant S, Dole M. Development and validation of stability indicating RP-HPLC method for the estimation of apremilast by forced degradation studies. W. J Pharm Pharm Sci. 2017a;6:1493–502.https://doi.org/10.20959/ wjpps20174-8934.
Lu Y, Shen X, Hang T, Song M. Identification and characterization of process-related substances and degradation products in apremilast: process optimization and degradation pathway elucidation. J Pharm Biomed Anal. 2017;141:70–8.https://doi.org/10.1016/j.jpba.2017.03.067.
Man HW, Schafer P, Wong LM, Patterson RT, Corral LG, Raymon H, et al. Discovery of (S)-N-{2-[1-(3-ethoxy-4-methoxyphenyl)-2-methanesulfonylethyl]-1, 3-dioxo-2, 3-dihydro-1 H-isoindol-4-yl} acetamide (apremilast), a potent and orally active phosphodiesterase 4 and tumor necrosis factor-αinhibitor. J Med Chem. 2009;52:1522–40.https://doi.org/10.1021/jm900210d.
Michalek I, Loring B, John SA. Systematic review of worldwide epidemiology of psoriasis. J Eur Acad Dermatol Venereol. 2017;31:205–12.https://doi.org/10.1111/jdv.13854.
Mirza T, Tan HS. Determination of captopril in pharmaceutical tablets by anion-exchange HPLC using indirect photometric detection; a study in systematic method development. J Pharm Biomed Anal. 2001;25:39–52.https://doi.org/ 10.1016/S0731-7085(00)00462-3.
Patel KG, Patel AT, Shah PA, Gandhi TR. Multivariate optimization for simultaneous determination of aspirin and simvastatin by reverse phase
liquid chromatographic method using aqbd approach. Bull F Pharm Cairo Uni. 2017;55:293–301.https://doi.org/10.1016/j.bfopcu.2017.08.003. Rajiv J. Immunopathogenesis of psoriasis. Ind J Dermatol Venereol Leprol.
2004;70:10–2.
Ravisankar P, Sulthana MS, Babu PS. Development and validation of stability-indicating UV spectrophotometric method for determination of Apremilast in bulk and pharmaceutical dosage form. Ind J Res Pharm Biotechnol. 2017;5:47. Xiong K, Ma X, Cao N, Liu L, Sun L, Zou Q, et al. Identification, characterization
and HPLC quantification of impurities in apremilast. Anal Methods. 2016;8: 1889–97.https://doi.org/10.1039/C5AY01759A.