www.adv-radio-sci.net/7/11/2009/
© Author(s) 2009. This work is distributed under the Creative Commons Attribution 3.0 License.
Advances in
Radio Science
Comparison of methods for broadband electromagnetic
characterization of Molded Interconnect Device materials
C. Orlob, D. Kornek, S. Preihs, and I. Rolfes
Leibniz Universität Hannover, Institut für Hochfrequenztechnik und Funksysteme, Appelstr. 9A, 30167 Hannover, Germany
Abstract. Combining the Molded Interconnect Device tech-nology with the Laser Direct Structuring techtech-nology exhibits the potential of designing electrical and mechanical compo-nents on three-dimensional surfaces to increase functionality, level of integration and to reduce costs. When taking advan-tage of this technology especially in the design of RF de-vices, a precise knowledge of the electromagnetic parameters of the MID material is required, as the complex permeability and permittivity strongly influence the device performance. At present time, these materials are not electromagnetically characterized in the RF frequency range. In this paper differ-ent methods are therefore presdiffer-ented and compared with re-spect to their potentials for broadband electromagnetic char-acterization of Molded Interconnect Device materials.
1 Introduction
The Molded Interconnect Device technology (MID) in com-bination with Laser Direct Structuring (LDS) offers the pos-sibility of designing electrical and mechanical components on three-dimensional surfaces to increase functionality, level of integration and to reduce costs. For example, transmission lines, antennas, switches, and connectors can be integrated on carriers like the covers of cellular phones or the cases of exterior mirrors of a car. However, applying this novel tech-nology to RF circuits implies the precise knowledge of the electromagnetic properties of the MID material. Especially for MID based development of antennas dedicated for dif-ferent applications like IEEE 802.11 WLAN, IEEE 802.15.1 Bluetooth or IEEE 802.16 WiMAX it is necessary to deter-mine the complex permittivityr=r0−j
00
r and complex per-meabilityµr=µ0r−j µ
00
r over a wide frequency range.
Correspondence to: C. Orlob
Since these parameters are not quantified for RF frequen-cies at the present time, this paper presents a first charac-terization of an exemplarily chosen MID material Pocan DP T7140 LDS (Lanxess AG) demonstrating the features of the measurement methods, which were chosen with respect to the constraint of available samples geometries. Measurement principle, capability, bandwidth, uncertainties and sample re-quirements of each method are pointed out.
In Sect. 2 the known properties of the considered MID ma-terial are indicated and the MID LDS processing is shortly described. In the subsequent section the measurement meth-ods are presented in detail followed by the measurement re-sults shown and discussed in Sect. 4. The paper ends with a conclusion.
In the following, the investigated materials are generally categorized with the terms low permittivity, medium loss and low loss. The term low permittivity refers to materials where r0≤5 and the terms medium loss and low loss correspond to 3×10⁻⁴≤tanδ≤3×10⁻²and tanδ<3×10⁻⁴, respectively.
2 MID LDS materials and processing
This section gives information on relevant properties of the investigated material Pocan DP T7140 LDS and how it is applied in the MID LDS process. According to the data sheet, Pocan DP T7140 LDS is a solid polyethylene tereph-thalate/polybutylene terephthalate (PET/PBT) polymer with low permittivity and medium loss. In detail, a dielectric con-stant r0=4.1 and loss factor tanδ=r00/r0=1.38×10−2 are stated atf=1 MHz.
Fig. 1. MID LDS activation step.
Subsequently, the cleaning step follows, in which the debris from laser structuring is removed. Finally, the metallization is build up on the activated area by use of current-free cop-per baths. Depending on application, the copcop-per layer can additionally be plated with gold or other metals by means of electroforming baths.
3 Measurement methods
In this section, the analyzed measurement methods are shortly presented in terms of functionality, measurement ca-pability, frequency range of operation, measurement uncer-tainty and sample requirements. Further information about each method can be found in Clarke et al. (2002).
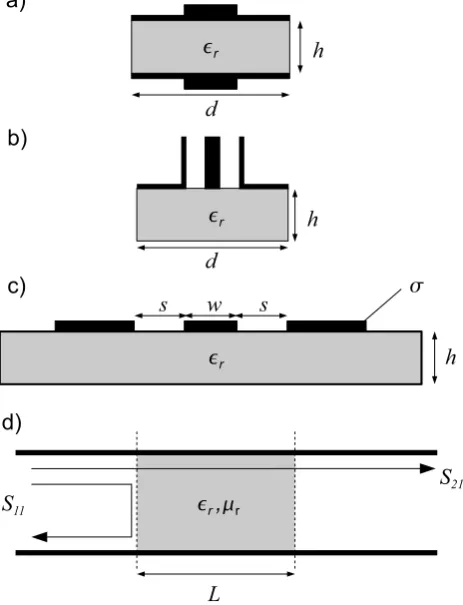
The first method considered is a commercially avail-able admittance cell Agilent 16453A connected with the impedance analyzer Agilent E4991A. As shown in Fig. 2a, the dielectric is sandwiched by two electrodes forming a ca-pacitor. The complex permittivityris determined as the ra-tio of the admittances for the material filled electrodes and for the air filled electrodes. This method can be used in the range from a few MHz to 1 GHz and requires planar sheets with a thickness 0.3 mm≤h≤3 mm and a diameter d≥15 mm. In accordance to the data specification of the impedance ana-lyzer, a minimal uncertainty of approximately1r0/r0=7% can at best be achieved for measurement of low permittivity dielectrics.
The second technique refers to the coaxial probe HP 85070A, which is pressed against a flat surface of the di-electric, as shown in Fig. 2b. Assuming an isotropic, ho-mogeneous and non-magnetic sample, the complex permit-tivityr is derived from the reflection coefficient based on an quasi static model of the probe termination. Corre-sponding to the manufacturer’s data, the theoretical operating range is 200 MHz≤f≤20 GHz, which is practically short-ened by the effect of falling sensitivity with decreasing fre-quency. A minimum uncertainty of10r/r0=5% in the up-per part of the frequency range can be accomplished assum-ing appropriate contactassum-ing and calibration. This method re-quires samples with at least one flat surface and dimensions h≥20/√|r|mm andd>20 mm.
The third method relies on on-wafer scattering-parameters measurement for coplanar waveguides (CPW) of different lengths (Arz and Leinhos, 2008). A CPW is formed from a signal conductor and a pair of groundplanes, all arranged
Fig. 2. Cross-sections of measurement setups: (a) admittance
cell, (b) coaxial probe, (c) coplanar waveguide and (d) rectangu-lar waveguide.
The last method investigated is based on the rectangular waveguide technique. The sample, filling a section of waveg-uide of lengthLas demonstrated in Fig. 2d, is electromag-netically characterized by the scattering-parameters
S11=
(1−z2)0
1−(0z)2 (1)
S21=
(1−02)z
1−(0z)2 (2)
with the transmission coefficient
z=e−γ L (3)
and the reflection coefficient 0=
µ γ −
µ0 γ0 µ γ +
µ0 γ0
. (4)
The terms γ0 and γ=f (r, µr) stand for the waveguide propagation constants of the fundamental mode TE10 in air and material, respectively. In comparison with the other three discussed techniques this method features the capabil-ity to measure the relative permittivcapabil-ity as well as the rela-tive permeability by solving the system Eqs. (1)–(2) via the Nicolson-Ross solution (Nicolson and Ross, 1970). In the case of measuring long samples this approach leads to the drawback of instability at frequencies corresponding to in-teger multiples of one-half wavelength in the material. Al-ternatively, when a non-magnetic material can be assumed the permittivity can be determined in a stable way by solv-ing Eq. (2) numerically accordsolv-ing to the procedure of Baker-Jarvis et al. (1990). In both approaches this method cov-ers a frequency range of a single waveguide band, which is in this paper 8.4 GHz≤f≤12 GHz, and requires samples, which should be precisely matched to the inside dimensions of the waveguide to avoid air gaps. In this paper for the nu-meric solution a differential uncertainty analysis accounting for uncertainties in scattering-parameters and sample length L is accomplished. In accordance with Baker-Jarvis et al. (1990), the total uncertainty is defined as
1r0 =
s ∂0
r ∂|S21|
1|S21|
2
+
∂0 r ∂221
1221
2
+
∂0 r ∂L1L
2
(5) where1|S21|is the uncertainty in magnitude ofS21,1221 is the uncertainty in phase ofS21and1Lis the uncertainty in sample lengthL. The total uncertainty for the loss factor is defined respectively. For low permittivity samples with medium or low loss, uncertainties below1r0/r0=1% can be achieved for lengthsL longer than half the wavelength in the material. For this class of materials it can be expected by trend that the larger the sample lengthLis, the lower the total uncertainty hence the higher the measurement reliability will be (Baker-Jarvis et al., 1990).
0 2 4 6 8 10 12
1,5 2,0 2,5 3,0
Admittance Cell
Coaxial Probe
Rectangular Waveguide, L = 10 mm
Reference Value
r
'
f / GHz
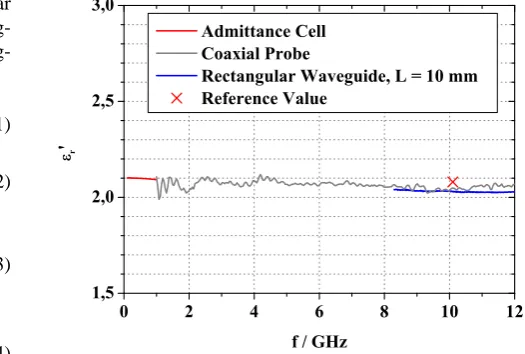
Fig. 3. Real part of the relative permittivity0rof Teflon.
4 Measurements and comparison
Except for the measurements utilizing the admittance cell, all measurements were carried out on the basis of a vector network analyzer (VNA). Before measuring, the admittance, coaxial probe and the rectangular waveguide setup were cal-ibrated.
For the CPW measurements five lines with lengths be-tween 2 mm and 55 mm were structered on a sheet of Pocan DP T7140 LDS with a thickness h=2 mm by the use of the MID LDS technology. The CPW dimensions were cho-sen to w≈s≈300 um, which hold the required condition 2(w+2s)<hfor the assumption of an infinite thick substrate. The lines were contacted via probes and a separate DC mea-surement for the determination of the conductivityσwas per-formed.
For the analysis of the measurement results achieved with the rectangular waveguide setup, the appearance of higher order modes, wall losses and air gaps between sample and waveguide walls were neglected. The uncertainties were calculated according to Eq. (5) for the given scattering-parameters uncertainties of the VNA and an estimated un-certainty in specimen length of1L=50µm.
Furthermore, the admittance cell and coaxial probe meth-ods were only used for the determination of the real part of the permittivityr0, because of their low accuracy in loss mea-surements for an expected medium loss.
8 9 10 11 12 0,0
0,5 1,0 1,5 2,0 2,5 3,0
r
'
f / GHz
Fig. 4. Real part of the relative permeabilityµ0r as determined by the rectangular waveguide method using Nicolson-Ross solution.
0 2 4 6 8 10 12
3,0 3,5 4,0 4,5 5,0
Admittance Cell
Coaxial Probe
Coplanar Waveguide, S/m
Rectangular Waveguide
r
'
f / GHz
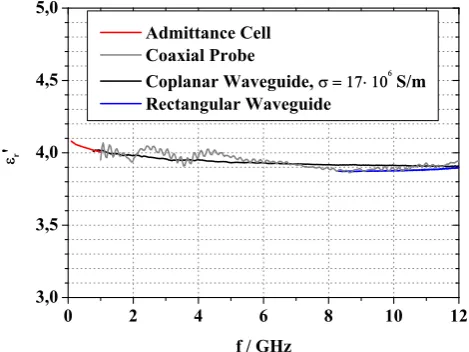
Fig. 5. Measured real part of the relative permittivity0r of Pocan DP T7140 LDS.
curve achieved with the coaxial probe shows in comparison to the other curves significant ripples in this frequency region due to low accuracy at low frequencies. However, all mea-surement results lie in the typical range for teflon 2≤r0≤2.1 and differ less than 5% from the reference value implying a reasonable performance of each method.
Based on this, the MID material Pocan DP T7140 LDS, which was assumed to be isotropic and homogeneous, was measured with all four methods. Since this thermoplastic includes an organic metal complex for LDS processing, it was first checked if the added complex caused a signifi-cant permeability. The result calculated with the Nicolson-Ross solution for a sample with a maximal available length of L=10 mm is displayed in Fig. 4. Except for lower fre-quencies nearf=8.5 GHz, whereλ/2-resonance occurs and the Nicolson-Ross solution fails, the conditionµr≈1 holds.
0 2 4 6 8 10 12
0,00 0,01 0,02 0,03 0,04
Coplanar Waveguide, S/m
Rectangular Waveguide
t
a
n
f / GHz
Fig. 6. Dielectric loss tangent tanδof Pocan DP T7140 LDS mea-sured with both waveguide methods.
Consequently, the further analysis could focus on the deter-mination of the complex permittivity only. The r0 results determined with all four methods are presented in Fig. 5. In the case of the rectangular waveguide method the result was calculated with the numeric solution of Eq. (2) as described in the previous section. The yielded uncertainties for the ad-mittance cell, coaxial probe and rectangular waveguide are 1r0/r0=13%,10r/r0=5% forf≥7 GHz and1r0/r0=1%, respectively. In particular, the results achieved with the ad-mittance cell, CPW and rectangular waveguide method show a considerable mutual consistency indicating a permittiv-ity r0, which continuously falls from approximately 4 at f=1 GHz to approximately 3.9 atf=12 GHz. By contrast the coaxial probe measurement curve shows the strongest variations for frequencies below f=7 GHz. This could be a result of low accuracy as well as imperfect contact between the probe and the hard sample of Pocan DP T7140 LDS.
5 Conclusions
In this paper four measurement methods for the electromag-netic characterization of MID materials have been presented and compared with each other. Each method has been inves-tigated in terms of measurement setup, functionality, band-width, uncertainties, sample requirements and finally mea-surement performance.
The admittance cell enables measurement ofr0with high-est uncertainty. Since it requires only little sample and setup preparation, it is a suitable method for a first, less time con-suming permittivity characterization. The coaxial probe is also a simple technique, but with a capability of higher mea-surement bandwidth. It makes little demands on the sample, but larger on the user having to regard to appropriate contact-ing and calibration, which were the reasons for noticeable ripples in the measurement curves. It is also a convenient method for a first broadband valuation ofr0. The CPW mea-surements also exhibit an adequate possibility of broadband permittivity characterization, but they invoke high expenses in sample preparation and measurement complexity. Espe-cially for MID LDS structured CPWs a surface roughness probably has to be taken into account for accurate loss deter-mination. Finally, the rectangular waveguide method repre-sents the most powerful of the four discussed methods con-cerning measurement capability. With the potential of de-termination of both the complex permittivity and the com-plex permeability it is well suited for a basic classification of a material with unknown electromagnetic properties. Fur-thermore for low permittivity materials with medium or low losses it is well suited for the determination of r0, but not necessarily for loss characterization. For accurate measuments long samples with respect to the wavelength are re-quired, which are not always available.
Next to the comparison of the measurement methods, the MID material Pocan DP T7140 LDS was characterized within a frequency range off=0.1 GHz to f=12 GHz for the first time. Measurement results indicate a permeability µr≈1, a dielectric constant falling fromr0≈4 to
0
r≈3.9 and a dielectric loss factor tanδ in the dimension of 10−2. Fi-nally, by considering the facts that different samples of this material were measured with four methods, each having a different electromagnetic field configuration, and that the re-sults inr0 show a mutual consistence, the assumption of a homogeneous and isotropic material could be confirmed.
Acknowledgements. The authors wish to thank LPKF Laser &
Electronics AG, Garbsen for structuring the CPW substrate. We also thank Rosenberger Hochfrequenztechnik GmbH & Co. KG for sponsoring the GSG Z-probes.
References
Arz, U. and Leinhos, J.: Broadband Permittivity Extraction from On-Wafer Scattering-Parameter Measurements, 12th IEEE Workshop on Signal Propagation on Interconnects, Avignon, France, 1–4, 2008.
Baker-Jarvis, J., Vanzura, E. J., and Kissick, W. A.: Improved Technique for Determining Complex Permittivity with the Trans-mission/Reflection Method, IEEE T. Microw. Theory, 38, 1096– 1103, 1990.
Clarke, B., Gregory, A., Cannell, D., et al.: A Guide to the char-acterisation of dielectric materials at RF and microwave frequen-cies, National Physical Laboratory, Institute of Measurement and Control, London, 2003.
Heinrich, W.: Quasi-TEM Description of MMIC Coplanar Lines Including Conductor-Loss Effects, IEEE T. Microw. Theory, 41, 45–52, 1993.
Krupka, J., Derzakowski K., Riddle B., and Baker-Jarvis, J.: A di-electric resonator for measurements of complex permittivity of low loss dielectric materials as a function of temperature, Meas. Sci. Technol., 9, 1751–1756, 1998.
Marks, R. B.: A Multiline Method of Network Analyzer Calibra-tion, IEEE T. Microw. Theory, 39, 1205–1215, 1991.
Nicolson, A. M. and Ross, G. F.: Measurement of the Intrinsic Properties of Materials by Time-Domain Techniques, IEEE T. Instrum. Meas., 19, 377–382, 1970.