Evaluation of Damage Distribution in Elements of Dual Frames
Gh. Abdollahzadeh a *; S. Niknafsb
a Faculty of Civil Engineering, Babol University of Technology, Babol, Iran
bDepartment of Civil Engineering, Amol University, Amol, Iran
P A P E R I N F O
Paper history:
Received 28 December 2011 Received in revised form 23 May 2012 Accepted 30 August 2012
Keywords: Seismic Damage Damage Distribution Hysteretic Energy Nonlinear Dynamic Analysis Dual Steel Buildings
A B S T R A C T
During severe earthquakes, many structures yield and experience large inelastic deformations. Design procedure in current seismic design codes, is based on elastic behavior of structures and considers inelastic deformations implicitly. This fact results in inadequacy of current design practice as researches show. Taking into account inelastic behavior of structural elements may better predict seismic responses.
In the present study, three steel structures with dual system consisting of intermediate moment-resisting and concentric-braced frames that are widely used in medium and high-rise buildings, have been designed based on allowable stress design method. Then, inelastic seismic responses have been determined under three earthquake records by the PERFORM 3D software and hysteretic energy and damage state of structural elements have been evaluated in detail. Finally, by column strengthening, it has been tried to reduce structural damages. The results indicate that this approach is an efficient technique to make the damage distribution uniform among structural members..
doi:10.5829/idosi.ije.2012.25.04b.04
1.INTRODUCTION1
Damages of moment-resisting frames during past earthquakes show their vulnerability because of excessive displacement under seismic loads specially in
high-rise structures. On the other hand,
concentric-braced frames are stiff but brittle, and this leads to collapse of these frames under lateral loads. Dual steel frames with moment-resisting and concentric-braced frames combine two aforementioned structural systems to improve seismic performances. These dual systems can be used in design and retrofit of mid- and high-rise structures.
Current design practice of dual steel frames is the strength criterion. The criterion is based on elastic behavior of structures and considers the inelastic deformations indirectly. Meanwhile, during severe earthquakes, structures yield and experience inelastic deformations. Inadequacy of this design method is proven nowadays by researches and observed structural damages in past earthquakes. To be more realistic in assessment of seismic performance of structures, the
* Corresponding Author Email: abdollahzadeh@ nit.ac.ir (Gh. Abdollahzadeh)
inelastic characteristic of elements should be taken into account in the analysis procedure.
Various static and dynamic analysis procedures have different levels of accuracy in characterizing structural model properties and applied loads. Being still in use, equivalent static method is the simplest practical one adapted by seismic design codes. In spite of simplicity, this procedure is limited to regular and linear structures. Response spectrum analysis and static pushover procedure are applicable to a significantly broader range of structures. Meanwhile, nonlinear time-history analysis and dynamic pushover procedure are expected to predict seismic demands more realistically. Although such analyses are hindered by complexity and high computational effort [1], they are capable of considering almost any type of nonlinearity in material and geometry.
The present study focuses on evaluation of dual steel frames consisting of intermediate moment-resisting and concentric-braced frames designed according to the strength-based provisions. In this way, three 3-, 5- and 8-story 3D models have been designed based on allowable stress design (ASD) method of UBC-97 [2]. The models have been analyzed under three pairs of strong ground motion records by inelastic time-history
International Journal of Engineering
analysis in Perform 3D software, and Park-Ang damage index has been used as damage measure in evaluating performance of structural elements. Damage distribution among all members of buildings has been determined. Results show that damage distribution is not uniform in height of the structure and among members of each story. To overcome this non-uniformity, column strengthening has been selected as the retrofit method. Nonlinear time-history analysis of the strengthened structures shows that this approach is an efficient technique for improving seismic performance of dual steel systems.
2. SEISMIC DAMAGE INDICES
Finding clear quantitative measures for representation of structural damages is an important issue in damage evaluation. Generally, the structural damage is defined in terms of either economics or safety/strength considerations. Economic damage indices are usually defined as the ratio of repair to replacement cost for the structure or structural element while safety/strength damage indices, used in the present research, are normally related to deterioration of structural resistance. A large number of seismic damage models have been proposed in the literature, ranging from simple approaches using ductility ratio or inter-story drift to complicated definitions taking into account the effects of both deformation and energy [3-6]. The damage indices use many different local and global parameters to reflect the best estimate of the damage status of the structure. For instance, “Park and Ang” [7] and “Bozorgnia and Bertero” [8] consider deformation and energy dissipation of the structure and “Krawinkler and Zohrei” [9] uses the low-cycle fatigue theory.
TABLE 1. The relation between damage index and damage state [12]
Degree of
damage Physical Appearance
Damage Index
State of Building
Slight Sporadic occurrence of
cracking < 0.1 No Damage
Minor Minor cracks; partial crushing of concrete in columns
0.1-0.25 Minor Damage
Moderate Extensive large cracks; spalling of concrete in weaker elements
0.25-0.4 Repairable
Severe Extensive crashing of concrete; disclosure of buckled reinforcement
0.4-1.0 Beyond Repair
Collapse Partial or total collapse
of building >1.0 Loss of Building
In fact, the damage of structures is a combined effect of the response magnitude and the number of load cycles. For steel structures, these two effects can be easily modeled by accumulation rules such as that of Miner [10]. The case of reinforced concrete structures is complicated by the concrete-reinforcement interaction. For these structures, the level of the load, the number of cycles to failure and their relationship need to be simulated by appropriate acceleration factors [11].
Among the many damage measures available, the Park - Ang damage index appears to be the most promising due to its simplicity and extensive calibration against experimentally-observed damages in reinforced concrete structures. Although it is less reliable in the case of steel structures, its confidence can be improved by selecting suitable values of the model parameters [12, 13]. Park- Ang damage index, DPA,I , is defined as a linear combination of the ductility and energy dissipation indices:
DPA,I = max
u r u
U
dE
U Q U
b
+
å
(1)where:
max
U = The maximum deformation response under ground motion
u
U = The ultimate deformation under monotonic loading
dE
å
= Dissipated hysteretic energyr
Q = Yield strength
b = A nonnegative constant
values of b about 0.15, derived by fitting test results, are used in the literature for reinforced concrete structures [14, 15], while in the case of steel structures a value of b =0.025, used in present study, can be adopted [16].
3. STRUCTURAL MODELING PROCEDURE
The PERFORM 3D (VER 4.0.1) software [17] has been used for numerical modeling and analysis of the structures. In a detailed finite element model, each beam or column is divided into a number of elements along its length as shown in Figure 1 schematically.
Figure 2. Finite Element Model with Hinges [17]
Figure 3. P-M-M Yield Surface for Steel Elements [17]
Many different finite element models with low or high order might be used in modeling process. Generally, these models are based on either moment-curvature or fiber stress-strain relationships. PERFORM 3D software provides two options, namely curvature hinges and fiber segments. Figure 2 shows a finite element model using curvature hinges.
For an elastic structure, the goal of finite element analysis is to get a close approximation of the exact responses. In the case of a beam element, this means determining accurate values of bending moments, shear forces and displacements. Generally, as the element mesh gets finer, the result gets more accurate. For an inelastic structure, an additional goal is to determine sufficiently-accurate inelastic deformations for calculating capacity ratios. The demand-capacity measure might be the curvature or the fiber strain which is closely related to the curvature. The problem is that as the mesh is made finer, the maximum calculated curvature or strain usually gets progressively larger. This arises from the fact that beam theory for inelastic behavior predicts very large localized curvatures at the points of maximum bending moment, usually at the beam ends. Indeed, for an elastic-perfectly-plastic moment-curvature relationship, the maximum curvature after yield is theoretically infinite. Trilinear behavior has been considered for all
elements modeled in PERFORM 3D. Interaction of axial forces and bending moments has been considered in the trilinear model for column elements, making the
model substantially more complex than
elastic-perfectly-plastic (EPP) model. In the EPP behavior, there is only one yield surface and the surface does not move, but in the trilinear behavior, there are two surfaces and the inner one move around. Figure 3 shows the yield surface that PERFORM uses for axial force and moment interaction (P-M-M) for steel elements [17].
Nonlinear components can have complex properties, and the forms for input of component properties may appear to be complex. In this paper trilinear behavior, brittle strength loss in force-deformation relationship for inelastic components has been considered. Each material and each basic structural component has one or more actions or forces and corresponding deformations. The relationship between the two is the F-D relationship. In a structural component, brittle strength loss can be caused by a number of effects, including tensile fracture, concrete crushing, concrete shear failure and buckling. When a component loses strength, the lost strength is redistributed to adjacent components [17].
4. NONLINEAR DYNAMIC ANALYSIS OF
STRUCTURES
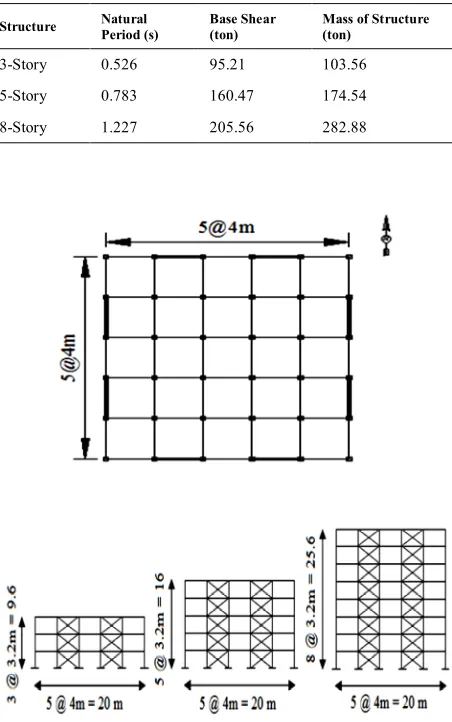
The studied steel structures with dual system of intermediate moment-resisting and concentric-braced frames have been designed according to the requirements of the ASD method of UBC-97. All of the structures are symmetrical. The beams and columns have general I-shape sections, and the box sections are used for the bracings.
degradation, strength deterioration and non-symmetric responses, is specified. Degrading parameters have been chosen from experimental results of cyclic force– deformation characteristics of typical components of the studied structures [17].
Three pairs of strong ground motion records for site class C have been used as input for nonlinear time-history analysis. Characteristics of these records are given in Table 3. For each pair of records, the square root of the sum of the squares (SRSS) of the 5%-damped response spectrum of the normalized horizontal components has been constructed. The records have been scaled such that the average SRSS spectrum does not fall below 1.4 times the design spectrum in period range 0.2T to 1.5T, where T is the fundamental period of the structure [2]. The response spectra of the scaled acceleration records of Loma Prieta, Northridge and San Fernando earthquakes and the design spectrum of UBC-97 are shown in Figure 5.
TABLE 2. Basic design properties of the studied structures
Figure 4. Configuration of studied models
Figure 5. Response Spectra of the Scaled Acceleration Records and the UBC Design Spectrum, (a) Relative Displacement, (b) Acceleration.
TABLE 3.Strong ground motion parameters
Earthquake: Northridge Loma Prieta
Year: 1994 1989
Station: Covia-S Apeel 3E
Grand Ave. Hayward
Component: GRA074 A3E000
GRA344 A3E090
PGA (g): 0.066 0.078
0.062 0.084
Magnitude (Ms): 6.7 6.9
Duration (sec): 35 40
5.EVALUATION OF NONLINEAR DYNAMIC
ANALYSIS RESULTS IN PLAN
Usually perpetual structural damage is seen in the end of earthquake. Therefore, distribution of damage in this time is expressive of the permanent damage of the building. The structures have been subjected to two scaled horizontal components of acceleration records, simultaneously. Damage values of structural elements are averaged under three earthquakes. Average values are shown in Figure 6 for 8-story building.
Structure Natural
Period (s) Base Shear (ton) Mass of Structure (ton)
3-Story 0.526 95.21 103.56
5-Story 0.783 160.47 174.54
DIBR= 0.176DIB= 0.033DIBR= 0.173
Damage index of story 1
DIC= 0.038 DIC= 0.055
DIC= 0.071 DIC= 0.074
DIC= 0.106
DIC= 0.087
DIC= 0.039 DIBR= 0.079 DIBR= 0.079
D IB = 0. 038 D IB = 0. 037 D IB = 0. 035 DIC= 0.067 D IB = 0. 042 D IBR = 0. 453 D IB = 0. 04 D IB = 0. 118 D IBR = 0. 453 D IB = 0. 041 D IB = 0. 045 D IBR = 0. 276 D IB = 0. 039 D IBR = 0. 276 D IB = 0. 035 D IB = 0. 036 D IB = 0. 035 D IB = 0. 035 DIC= 0.078 D IB = 0. 035 DIC= 0.037 D IB = 0. 034 DIC= 0.041
DIBR= 0.394DIB= 0.082DIBR= 0.189
Damage index of story 2
DIBR= 0.095 DIBR= 0.095
D IBR = 0. 276 D IB = 0. 117 D IBR = 0. 58 D IB = 0. 101 D IBR = 0. 164 D IBR = 0. 206 D IB = 0. 034 D IB = 0. 035 DIB= 0.035 DIB= 0.035
Damage index of story 3
DIC= 0.072
DIC= 0.051
DIBR= 0.079 DIBR= 0.079
D IBR = 0. 475 D IB = 0. 146 D IBR = 0. 465 D IBR = 0. 117 D IB = 0. 07 D IBR = 0. 117 D IB = 0. 037
DIC= 0.065 DIC= 0.205
D
IB
=
0.
036
DIB= 0.041 DIBR= 0.294 DIB= 0.101DIBR= 0.275 DIB= 0.035 DIB= 0.033
Damage index of story 4
DIC= 0.108 DIC= 0.596
DIC= 0.695 DIC= 0.438
DIC= 0.137
DIBR= 0.073 DIBR= 0.073
D IB = 0. 04 D IB = 0. 036 DIC= 0.093 D IB = 0. 076 D IBR = 0. 228 D IB = 0. 236 D IBR = 0. 405 D IB = 0. 084 D IBR = 0. 132 D IB = 0. 091 D IBR = 0. 133 D IB = 0. 039 D IB = 0. 041 DIC= 0.318 D IB = 0. 034 DIC= 0.284 D IB = 0. 041 DIC= 0.178
DIB= 0.044DIBR= 0.282DIB= 0.132DIBR= 0.129 DIB= 0.035
DIB= 0.035 DIB= 0.036
DIB= 0.038 DIC= 0.116 D IB = 0. 037
D am age index of story 5
DIC= 0.219 DIC= 0.655
DIC= 0.24 DIC= 0.25 DIBR= 0.04 DIBR= 0.043
D IBR = 0. 543 D IB = 0. 252 D IBR = 0. 561 D IB = 0. 174 D IBR = 0. 316 D IB = 0. 117 D IBR = 0. 321 D IB = 0. 095 D IB = 0. 035
D IC= 0.207 DIC= 0.37 D IC= 0.423
D
IB
=
0.
129
DIB= 0.087 DIB= 0.085
DIB= 0.037 DIB= 0.05
DIBR= 0.219D IB= 0.141DIBR= 0.245 DIB= 0.035 DIC= 0.69 D IB = 0. 035 D IB = 0. 034 D IB = 0. 034
DIC= 0.26 D IC= 0.199 DIC= 0.188 DIC= 0.095 D IC= 0.162
D IB = 0. 058 D IB = 0. 048 D IB = 0. 52 D IB = 0. 055
D IC= 0.17 DIC= 0.237 DIC= 0.243
DIC= 0.098 D IC= 0.237 DIC= 0.233 DIC= 0.1
DIC= 0.227 D IC= 0.14 DIC= 0.076
D IC= 0.717 DIC= 0.178 DIC= 0.247 DIC= 0.24 DIC= 0.167
DIC= 0.065 DIC= 0.119 D IC = 0. 408 D IC = 0. 394 D IC = 0. 49 D IC = 0. 343 DIC= 0.68
Damage index of story 6
DIC= 0.291 DIC= 0.598
DIC= 0.295 DIC= 0.153 DIBR= 0.175 DIBR= 0.136
D IBR = 0. 431 D IB = 0. 223 D IBR = 0. 586 D IB = 0. 173 D IBR = 0. 272 D IB = 0. 116 D IBR = 0. 446 D IB = 0. 087 D IB = 0. 034
DIC= 0.342 DIC= 0.387 DIC= 0.411
D
IB
=
0.
123
DIB= 0.083 DIB= 0.1
DIB= 0.053 DIB= 0.109
DIBR= 0.387DIB= 0.154DIBR= 0.243 DIB= 0.04
DIC= 0.563
DIC= 0.253 DIC= 0.315 DIC= 0.237 DIC= 0.135 DIC= 0.153
D IB = 0. 049 D IB = 0. 089 D IB = 0. 093 D IB = 0. 035
DIC= 0.306 DIC= 0.38 DIC= 0.29
DIC= 0.308 DIC= 0.266 DIC= 0.142 DIC= 0.194
DIC= 0.201 DIC= 0.192 DIC= 0.156
DIC= 0.577 DIC= 0.304 DIC= 0.48 DIC= 0.483 DIC= 0.313
Damage index of story 7
DIC= 0.247 DIC= 0.443
DIC= 0.05 DIC= 0.042 DIBR= 0.393 DIBR= 0.403
D IBR = 0. 717 D IB = 0. 186 D IBR = 0. 717 D IB = 0. 14 D IBR = 0. 463 D IB = 0. 105 D IBR = 0. 419 D IB = 0. 077
DIC= 0.216 DIC= 0.247 DIC= 0.119
D
IB
=
0.
037
DIB= 0.093 DIB= 0.098
DIB= 0.045 DIB= 0.07
DIBR= 0.525DIB= 0.125DIBR= 0.506 DIB= 0.073
DIC= 0.593
DIC= 0.176 DIC= 0.08 DIC= 0.095 DIC= 0.14
D IB = 0. 119 D IB = 0. 108 D IB = 0. 115
DIC= 0.162 DIC= 0.19 DIC= 0.12
DIC= 0.22 DIC= 0.087 DIC= 0.035 DIC= 0.107
DIC= 0.137 DIC= 0.051 DIC= 0.035
DIC= 0.428 DIC= 0.338 DIC= 0.155 DIC= 0.308 DIC= 0.109
DIC= 0.036 D IC = 0. 065 D IC = 0. 234 D IC = 0. 119 D IC = 0. 18 DIC= 0.518 DIB= 0.036 DIB= 0.035 DIC= 0.097 DIB= 0.043
Damage index of story 8
DIC= 0.052 DIC= 0.124
DIBR= 0.707 DIBR= 0.471
D IBR = 0. 663 D IB = 0. 144 D IBR = 0. 727 D IB = 0. 108 D IBR = 0. 628 D IB = 0. 086 D IBR = 0. 717 D IB = 0. 034 DIC= 0.087
DIB= 0.076 DIB= 0.077
DIB= 0.045
DIBR= 0.717DIB= 0.122DIBR= 0.594 DIB= 0.036
DIC= 0.226
DIC= 0.249 DIC= 0.039 DIC= 0.04 DIC= 0.046
DIC= 0.033
DIC= 0.117 DIC= 0.177 DIC= 0.072
D IC = 0. 07 D IC = 0. 094 D IC = 0. 075 D IC = 0. 04 DIC= 0.097 DIB= 0.038 DIB= 0.036 DIC= 0.157 DIB= 0.038 DIB= 0.035 DIC= 0.036
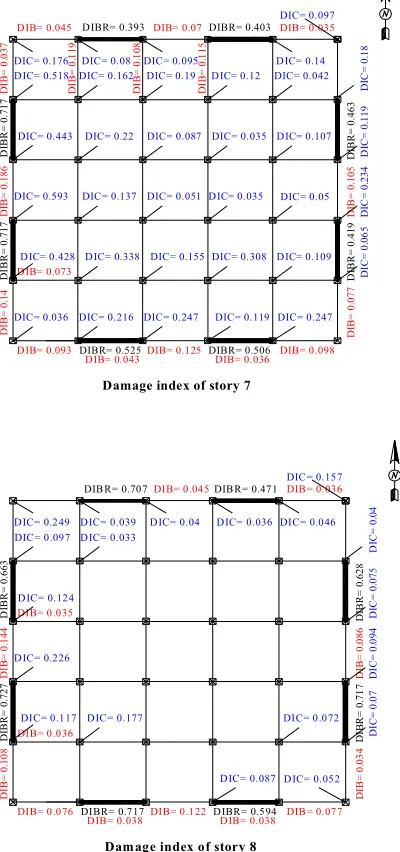
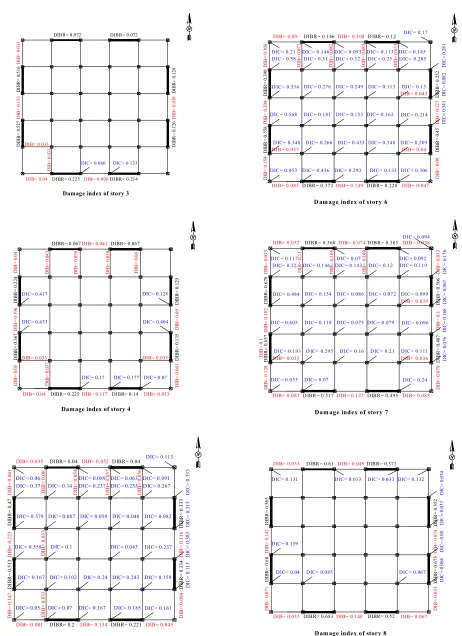
Figure 6. Damage indices for members of 8-story building
In these figures, damage indices are shown only for the damaged members, i.e. the members that have experienced inelastic deformation. Also, the braced spans are highlighted in the figures. Because of the large number of analyses with large stiffness matrixes, e.g., 388 nodes and 1024 elements for the 8-story building, evaluating the damage distribution in all parts of the buildings is very time-consuming and difficult. In the following figures:
DIBR: Damage index of brace DIC: Damage index of column DIB: Damage index of beam
As shown in Figures 6, maximum damage is seen in the external braced frames. In these frames, columns
connected to braces have maximum damage due to high absorption of hysteretic energy and high displacement. Therefore, to improve seismic performance of the structures, the sections of these columns have been strengthened about 10 - 13%.
Absorption of hysteretic energy in members of higher stories is more than that in members of lower stories, and consequently, higher stories have more damage. So, coulmn-strenghtening has been done only in higher stories. Speaking precisely, in 8-story building, columns connected to braces have been strengthened from story 3 to the upper stories. This procedure has been done for 3rd, 4th and 5th stories in 5-story building and for all stories in 3-story building. The results of analysis after the column-strengthening can be seen in Figure 7 for 8-story building.
D IB R= 0.148 D IB R = 0.142
D am age ind ex of story 1
D IC = 0.04 D IC= 0.059
D IC = 0.04 D IC = 0.095
D IC= 0.069
D IC = 0.109
D IC= 0.039 D IB R = 0.074 D IB R = 0.074
D IB = 0. 036 D IB = 0. 034 D IB = 0. 033
D IC = 0.061
D IB = 0. 038 D IBR = 0.379 D IB = 0. 036 D IB = 0. 079 D IBR = 0.398 D IB = 0. 037 D IB = 0. 041 D IBR = 0.23 D IB = 0. 035 D IBR = 0.2 29 D IB = 0. 033 D IB = 0. 033
D IC = 0.037 D IC= 0.033 D IC= 0.04
DIBR= 0.307DIB= 0.077 DIBR= 0.175
D am age index of story 2
DIBR= 0.086 DIBR= 0.085
D IBR = 0. 249 D IB = 0. 112 D IBR = 0. 522 D IB = 0. 1 D IBR = 0. 129 D IBR = 0. 134 D IB = 0. 04
Damage index of story 3
DIBR= 0.072 DIBR= 0.072
D IBR = 0.516 D IB = 0. 153 D IBR = 0.527 D IBR = 0.128 D IB = 0. 038 D IBR = 0.1 26 D IB = 0. 033
DIC= 0.066 DIC= 0.133
D
IB
=
0.
033
DIB= 0.04 DIBR= 0.225 DIB= 0.096DIBR= 0.214 DIB= 0.033
Damage index of story 4
DIC= 0.07 DIC= 0.417
DIC= 0.433 DIC= 0.404
DIBR= 0.067 DIBR= 0.067
D IB = 0. 038 D IB = 0. 04 D IB = 0. 043 D IBR = 0. 224 D IB = 0. 196 D IBR = 0. 367 D IB = 0. 05 D IBR = 0. 129 D IB = 0. 09 D IBR = 0. 135 D IB = 0. 041 D IB = 0. 037
DIC= 0.17 DIC= 0.177
D IB = 0. 04 DIC= 0.128
DIB= 0.04 DIBR= 0.225DIB= 0.117 DIBR= 0.14 DIB= 0.033
DIB= 0.033 DIB= 0.033
DIB= 0.041 D IB = 0. 038
Damage index of story 5
DIC= 0.161 DIC= 0.579
DIC= 0.237 DIC= 0.267 DIBR= 0.04 DIBR= 0.04
D IBR = 0. 47 D IB = 0. 223 D IBR = 0. 513 D IB = 0. 147 D IBR = 0. 333 D IB = 0. 116 D IBR = 0. 334 D IB = 0. 094 D IB = 0. 033
DIC= 0.07 DIC= 0.167 DIC= 0.185
D
IB
=
0.
041
DIB= 0.081 DIB= 0.045
DIB= 0.035 DIB= 0.052
DIBR= 0.2 DIB= 0.134DIBR= 0.221 DIC= 0.558 D IB = 0. 033
DIC= 0.06 DIC= 0.089 DIC= 0.063 DIC= 0.091
D IB = 0. 06 D IB = 0. 054 D IB = 0. 057 D IB = 0. 056
DIC= 0.14 DIC= 0.237 DIC= 0.233
DIC= 0.087 DIC= 0.059 DIC= 0.048 DIC= 0.082
DIC= 0.1 DIC= 0.043
DIC= 0.167 DIC= 0.102 DIC= 0.24 DIC= 0.243 DIC= 0.159
DIC= 0.05 DIC= 0.113 D IC = 0. 113 D IC = 0. 383 D IC = 0. 315 D IC = 0. 333 DIC= 0.37
D am age index of story 6
DIC= 0.306 D IC= 0.534
DIC= 0.214 DIC= 0.205 DIBR= 0.146 D IBR= 0.12
D IBR = 0. 398 D IB = 0. 204 D IBR = 0. 558 D IB = 0. 154 D IBR = 0. 252 D IB = 0. 127 D IBR = 0. 45 D IB = 0. 09
DIC= 0.436 DIC= 0.293 DIC= 0.133
D
IB
=
0.
108
DIB= 0.085 DIB= 0.047
DIB= 0.05 DIB= 0.108
D IBR= 0.372DIB= 0.149 DIBR= 0.228 DIB= 0.037
DIC= 0.568
DIC= 0.21 DIC= 0.146 DIC= 0.093 DIC= 0.113 DIC= 0.145
D IB = 0. 072 D IB = 0. 082 D IB = 0. 083 D IB = 0. 033
DIC= 0.31 DIC= 0.32 DIC= 0.25
DIC= 0.276 DIC= 0.249 DIC= 0.113 DIC= 0.13
DIC= 0.181 DIC= 0.153 DIC= 0.162
D IC= 0.348 DIC= 0.266 DIC= 0.433 DIC= 0.348 DIC= 0.205
DIC= 0.053 DIC= 0.17 D IC = 0. 341 D IC = 0. 082 D IC = 0. 281 DIC= 0.58 DIB= 0.043 DIB= 0.04
Dam age index of story 7
DIC= 0.24 DIC= 0.484
DIC= 0.096 DIC= 0.119 DIBR= 0.368 DIBR= 0.385
D IBR = 0. 678 D IB = 0. 182 D IBR = 0. 657 D IB = 0. 128 D IBR = 0. 506 D IB = 0. 1 D IBR = 0. 487 D IB = 0. 079 DIC= 0.07 D IB = 0. 035
DIB= 0.083 DIB= 0.085
DIB= 0.052 DIB= 0.074
D IBR= 0.517DIB= 0.125D IBR= 0.495 DIB= 0.033
DIC= 0.603
DIC= 0.117 DIC= 0.07 D IC= 0.092
D IB = 0. 11 D IB = 0. 105 D IB = 0. 109
DIC= 0.146 DIC= 0.143 DIC= 0.12
DIC= 0.154 DIC= 0.086 DIC= 0.072 DIC= 0.099
DIC= 0.118 DIC= 0.075 DIC= 0.079
DIC= 0.193 D IC= 0.295 D IC= 0.16 DIC= 0.21 DIC= 0.111
DIC= 0.033 D IC = 0. 076 D IC = 0. 168 D IC = 0. 067 D IC = 0. 176 DIC= 0.52 DIB= 0.038 DIC= 0.094 DIB= 0.036 DIB= 0.039 D IB = 0. 033 D IB = 0. 1
Dam age index of story 8
DIBR= 0.61 DIBR= 0.371
D IBR = 0. 565 D IB = 0. 142 D IBR = 0. 68 D IB = 0. 071 D IBR = 0. 552 D IB = 0. 074 D IBR = 0. 673 D IB = 0. 033
DIB= 0.033 DIB= 0.067
DIB= 0.049
DIBR= 0.683DIB= 0.148 DIBR= 0.52 DIC= 0.159
DIC= 0.131 DIC= 0.033 DIC= 0.132
DIC= 0.04 DIC= 0.085 DIC= 0.067
D IC = 0. 068 D IC = 0. 08 D IC = 0. 033 D IC = 0. 034 DIC= 0.033 DIB= 0.033
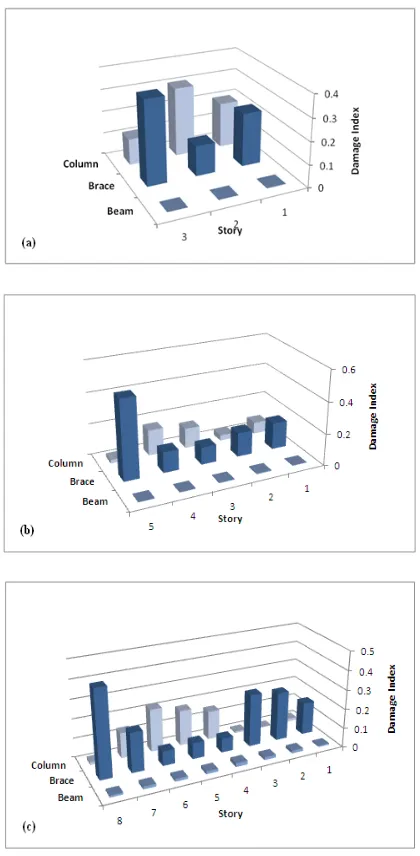
6.DISTRIBUTION OF DAMAGE IN PARTS OF EACH STORY
For evaluation of seismic behavior of structures, the contribution of the beams, columns and braces of 3-, 5- and 8-story buildings in the level of damage have been determined and are shown in Figures 8 and 9. The Level of damage in the elements of the buildings has been computed in the end of earthquake record because in this time, the damages will be stable and maximal. These damage values are averaged under Loma Prieta, Northridge and San Fernando earthquakes. The figures show that in all stories of the studied buildings, damage values of beams are less than those of other elements and that in the lower and higher stories, the braces have maximum damages. In the strengthened buildings, damage values get closer together in the columns and braces, but the values in the columns are a little more than those in the braces. The damage distributions show that structural design according to the requirements of the current seismic design codes has not good performance in structural members and does not result in uniform distribution of damage among members of buildings. Therefore, several authors have discussed the
need for an improvement of the current
earthquake-resistant-design methods in order to consider the structural damage with inelastic behavior concept. In this way, the column strengthening has been proposed in this study to have a uniform damage distribution among the members of the structure.
Figure 8. Comparison of Damage Distribution among the Members of (a): 3-Story Building, (b): 5-Story Building and (c): 8-Story Building before Strengthening.
7.CONCLUSIONS
In this study, the distribution of damage among structural members of dual steel buildings was evaluated. The damage indices in all members of dual steel buildings with various numbers of stories were evaluated by nonlinear time-history analysis using PERFORM 3D software. The results of the study can be summarized as follows:
1. In spite of the uniform distribution of strength in the height of the structures, the damage values don’t have that uniformity and don’t have specific height-wise regularity.
2. Most of the damaged columns and beams are those connected to the external braced frames. For example, 95% of damaged beams in the 3-story building are seen in the external frames. Therefore, these frames in the dual systems consisting of
intermediate moment-resisting and
concentric-braced frames have low strength and need to be strengthened.
3. Most of the energy imported to the external braced frames is absorbed by the braces and in next rank, by the columns.
4. In plans of the buildings, quite a regular distribution of damage can be seen, so that the damage values around the center of the floors of the stories is less than those in external frames.
5. In all parts of the buildings, beams have less damage values compared to other members, and in up and down stories, braces have more damage values than other members.
In this paper, only the column section strengthening have been used for strengthening of buildings, but other methods such as the brace strengthening and the bay width reduction can be used and compared with the method applied in this paper.
8. REFERENCES
1. Estekanchi, H.E., Arjomandi, K. and Vafai, A., “Estimating structural damage of steel moment frames by Endurance Time method”, Journal of Constructional Steel Research, Vol. 64, (2008), 145–155.
2. Uniform building code, In: International conference of building officials, (1994).
3. Golafshani, A., Bakhshi, A. and Tabeshpour, M.R., “Vulnerability and Damage Analysis of Existing Buildings”.
Asian Journal of Civil Engineering (Building and Housing), Vol. 6, No.s. 1-2, (2005), 85-100.
4. Williams, M.S. and Sexsmith, R.G., “Review of methods of assessing seismic damage in concrete structures”, Technical Report 94-02, Vancouver (Canada): Earthquake Engineering Research Facility, University of British Columbia, (1994). 5. Skjærbæk, P.S., Nielsen, S.R.K., Kirkegaard, P.H. and Çakmak,
A.S., “Experimental study of damage indicators for a 2-bay,
6-storey RC-frame”, Fracture & Dynamics paper no. 87. Denmark: Dept. of Building Technology and Structural Engineering, Aalborg University, (1997).
6. Sorace, S., “Seismic assessment of steel frames”, Journal of Structural Engineering, ASCE, Vol. 124, No. 5, (1998). 7. Park, Y.-J. and Ang, AH.-S., “Seismic damage analysis of RC
buildings”, Journal of Structural Engineering, ASCE, (1985), 740–757.
8. Bozorgnia, Y. and Bertero, V.V., “Evaluation of damage potential of recorded earthquake ground motion”, Seismological Research Letters, Vol. 72, (2001), 233.
9. Krawinkler, H. and Zohrei, M., “Cumulative damage in steel structures subjected to earthquake ground motions”, Computers and Structures, Vol. 16, (1983), 531–541.
10. Miner, M.A., “Cumulative damage in fatigue”, Journal of Applied Mechanics, ASME, Vol. 12, (1945).
11. Chung, Y.S., Meyer, C. and Shinozuka, M., “Seismic damage assessment of reinforced concrete members”, Technical Report NCEER-87-0022, New York: National Centre for Earthquake Engineering Research, Columbia University, (1987).
12. Park, Y.J. and Ang, AH.-S., “Mechanistic seismic damage model for reinforced concrete”, Journal of Structural Engineering, Vol. 111, No. 4, (1985), 722-739.
13. Park, Y.J., Ang, AH.-S. and Wen, Y.K., “Damage-limiting aseismic design of buildings, Earthquake Spectra, Vol. 3, No. 1, (1987), 1-26.
14. Park, Y.J., “Seismic damage analysis and damage-limitingmdesign of R/C structures. P.H.D. thesis. Ubana (IL): Dept. of Civil Engineering, University of Illinois, 1984. 15. Cosenza, E., Manfredi, G. and Ramasco, R., “The use of damage
functional in earthquake resistant design: A comparison among different procedures”, Structural Dynamics and Earthquake Engineering, Vol. 22, (1993), 855-868.
16. Cosenza, E. and Manfredi, G., “Classificazione e comportamento sismico di modelli ciclici degradanti”, In: Proc. of workshop on Danneggiamento ciclico e prove pseudo-dinamiche, (1994), 59-74.
Evaluation of Damage Distribution in Elements of Dual Frames
Gh. Abdollahzadeh a; S. Niknafsb
a Faculty of Civil Engineering, Babol University of Technology, Babol, Iran
bDepartment of Civil Engineering, Amol University, Amol, Iran
P A P E R I N F O
Paper history:
Received 28 December 2011 Received in revised form 23 May 2012 Accepted 30 August 2012
Keywords: Seismic Damage Damage Distribution Hysteretic Energy Nonlinear Dynamic Analysis Dual Steel Buildings
هﺪﯿﮑﭼ
ﯽﻃ هزﺎﺳﺪﯾﺪﺷيﺎﻫﻪﻟﺰﻟز يدﺎﯾزيﺎﻫ
وهﺪﺷﻢﯿﻠﺴﺗ ﻞﮑﺷﺮﯿﯿﻐﺗ
يﺎﻫ ﯽﻄﺧﺮﯿﻏ ﺪﻧاهدﺮﮐﻪﺑﺮﺠﺗارﯽﮔرﺰﺑ
.
ردﯽﺣاﺮﻃﺪﻨﯾآﺮﻓ
ﻦﯿﯾآ ﻪﻣﺎﻧ هزﺮﻟﯽﺣاﺮﻃيﺎﻫ هزﺎﺳﯽﻋﺎﺠﺗرارﺎﺘﻓرﻪﯾﺎﭘﺮﺑﯽﻠﻌﻓيا
ﻞﮑﺷﺮﯿﯿﻐﺗﺮﺛاﻦﺘﺷادرﻮﻈﻨﻣﺎﺑﺎﻫ ﺮﯿﻏيﺎﻫ
ﯽﻋﺎﺠﺗرا ترﻮﺻﻪﺑ
ﺮﯿﻏ ﺖﺳا ﻢﯿﻘﺘﺴﻣ
.
ﺖﺑﺎﺛ ﻦﯿﻘﻘﺤﻣ ﺮﮐ
هد ﻪﻣﺎﻧ ﻦﯿﯾآ ﺖﯾﺎﻔﮐ مﺪﻋ ﺐﺒﺳ عﻮﺿﻮﻣ ﻦﯾا ﻪﮐ ﺪﻧا هزﺮﻟ حﺮﻃ رد دﻮﺟﻮﻣ يﺎﻫ
يا
هزﺎﺳ هزﺎﺳﺎﻀﻋاﮏﯿﺘﺳﻻاﺮﯿﻏرﺎﺘﻓرﻦﺘﻓﺮﮔﺮﻈﻧردوﺖﺳﺎﻫ هزﺮﻟﺦﺳﺎﭘﺖﺳاﻦﮑﻤﻣيا
هزﺎﺳيا دزﺎﺳرﺎﮑﺷآﺮﺘﻬﺑارﺎﻫ
.
ﻦﯾارد
ﻖﯿﻘﺤﺗ يدﻻﻮﻓهزﺎﺳﻪﺳ ﺎﮔود
ﻪﻧ ﻢﻫﺪﻨﺑرﺎﻬﻣﺎﺑﻂﺳﻮﺘﻣيﺮﯾﺬﭘﻞﮑﺷﺎﺑ ﺰﮐﺮﻣ
نﺎﻤﺘﺧﺎﺳردﯽﻌﯿﺳورﻮﻃﻪﺑﻪﮐ، وﻂﺳﻮﺘﻣيﺎﻫ
،ﺪﻧﻮﺷﯽﻣهدﺎﻔﺘﺳاﻪﺒﺗﺮﻣﺪﻨﻠﺑ هﺪﺷبﺎﺨﺘﻧا
شورسﺎﺳاﺮﺑو ﯽﺣاﺮﻃ
هﺪﺷحﺮﻃزﺎﺠﻣﺶﻨﺗ ﺪﻧا
.
ﺲﭙﺳ ، هزﺎﺳﻦﯾا ﺮﺛاﺖﺤﺗﺎﻫ
راﺰﻓا مﺮﻧﺎﺑ وﻪﺘﻓﺮﮔ راﺮﻗﻪﻟﺰﻟز ﻪﺳ
PERFORM 3D (VER 4.0.1)
دﻞﯿﻠﺤﺗ ﺮﯿﻏﯽﮑﯿﻣﺎﻨﯾ ﺪﻧﺪﺷﯽﻄﺧ و
يژﺮﻧا
ﺶﺨﺑ ﻪﻤﻫ ﯽﺑاﺮﺧ وﺲﯾزﺮﺘﺴﯿﻫ ﺪﻧﺪﺷ ﻪﺒﺳﺎﺤﻣ هزﺎﺳ ﻒﻠﺘﺨﻣ يﺎﻫ
.
مﺎﺠﻧا ﺮﺳ ، ،نﻮﺘﺳ ﺖﯾﻮﻘﺗ ﺎﺑ هﺪﺷ شﻼﺗ
ﺖﺳا ﺎﺗ
ﺐﯾﺮﺨﺗ يﺎﻫ هزﺎﺳ ﺪﺑﺎﯾﺶﻫﺎﮐيا
.
ﯽﻣنﺎﺸﻧﺞﯾﺎﺘﻧ ﮏﯾﻊﯾزﻮﺗياﺮﺑﯽﺒﺳﺎﻨﻣﮏﯿﻨﮑﺗشورﻦﯾاﻪﮐﺪﻫد
ترﺎﺴﺧﺖﺧاﻮﻧ ﻦﯿﺑ
ﻫزﺎﺳﺎﻀﻋا ﯽﻣيﺎ ﺪﺷﺎﺑ
.
![TABLE 1.state [12] The relation between damage index and damage](https://thumb-us.123doks.com/thumbv2/123dok_us/237230.2018392/2.595.53.287.561.742/table-state-relation-damage-index-damage.webp)
![Figure 3. P-M-M Yield Surface for Steel Elements [17]](https://thumb-us.123doks.com/thumbv2/123dok_us/237230.2018392/3.595.76.268.113.203/figure-p-m-m-yield-surface-steel-elements.webp)