A b s t r a c t. The objective of the study is the calculation of the maximum absolute and relative measurement errors of the water conductivity coefficient determined by the instantaneous profiles method in the soil water potential range from 9.81 to 981 hPa. The analysis included average values of water conductivity coefficients from measurements on 415 soil samples for water potential values of 9.81, 31, 98.1, 156, 310, 490.5 and about 981 hPa. The measure-ment results were divided into classes according to selected phy-sical properties of soil solid phase. It was found that the absolute measurement error of soil water conductivity coefficient by instan-taneous profiles method originates mainly from reflectometric water content measurements. In the soil water potential range from saturation to field capacity the maximum relative error of soil water conductivity coefficient does not exceed 10% for a majority of the investigated soils. This range of soil water potential values is the most important to plants because water is easily accessible and the majority of hydrological research concentrates in the range.
For the soil water potential close to the wilting point the maximum relative measurement error is about 50% (depending on the soil group). Its value results from low values of the measured water conductivity coefficients. However, in this measurement range water is not accessible for most of the plants and the effect of making a big measurement error does not influence the evaluation of the water flux in the soil profile.
K e y w o r d s: water conductivity, instantaneous profiles method, error analysis
INTRODUCTION
Knowledge of the soil hydrophysical characteristics is essential for the description, interpretation and prediction of the progress of practically all the physical, chemical and biological processes in the soil-plant-atmosphere system (Walczak and S³awiñski, 2001). Modelling of these
proces-ses requires representative data of the soil hydrophysical properties. Generally, the majority of the simulation-prognostic models describing the hydrophysical processes taking place in the soil-plant-atmosphere system (Henric et al., 1996) are more efficient when the accuracy of the data describing the water characteristics of the soil is higher. Due to the large variability of the water conductivity coefficient in the whole range of soil water potential values, the correct determination of its value is essential to acquire sufficient accuracy of the applied models.
There are a few methods found in literature for the de-termination of water conductivity coefficients of capillary-porous media in unsaturated zone. The evaporation method of Wind (1969) is one of them. Bertuzziet al. (1997) pre-sented the influence of the temperature effect, position of tensiometers in the soil column and their calibration as well as the stratification of the soil sample on the accuracy of de-termination of the water conductivity coefficient using this method. The authors emphasized the decisive influence of the temperature change, the accuracy of the calibration cur-ve determination and the non-homogeneity of the sample. Tamariet al. (1993) presented the comparison of water con-ductivity coefficient values in the non-saturated zone acqui-red by Wind method, modified Wind method (Mohrath et al., 1997; Wind, 1969; Wendrothet al., 1993), and the instantaneous profiles method as the reference one.
Studies on the determination of water conductivity coefficients in the unsaturated zone by the instantaneous profiles method began in the 60’s of the former century, and continued in the 70’s (Vachaudet al., 1978; Watson, 1966). This method requires simultaneous measurements of water potential and water content of the soil, therefore it was recognized as time consuming and demanding expensive and specialized measurement equipment, especially for
Error analysis of water conductivity coefficient measurement
by instantaneous profiles method**
C. S³awiñski*, R.T. Walczak, and W. Skierucha
Institute of Agrophysics, Polish Academy of Sciences, Doœwiadczalna 4, P.O. Box 201, 20-290 Lublin 27, Poland Received August 22, 2005; accepted October 20, 2005
© 2006 Institute of Agrophysics, Polish Academy of Sciences
*Corresponding author’s e-mail: [email protected] **The paper is published in the frame of activity of the Centre of Excellence AGROPHYSICS - Contract No. QLAM-2001-00428 sponsored by EU within the 5FP.
w
w
water content measurement (Plaggeet al., 1990). With the development of the measurement techniques of capillary-porous media water content, including the TDR technique (Bertuzziet al., 1997; Dasberg and Dalton, 1985; Dalton et al., 1986; Kutilek and Nielsen, 1994; Walczak et al., 1993), the instantaneous profiles method is now being ap-plied as a standard for the determination of the water conductivity coefficient in unsaturated zone in a number of scientific centers (Bertuzziet al., 1997; Plaggeet al., 1990; S³awiñski, 2003; Sobczuk et al., 1992), including the Institute of Agrophysics, PAS (S³awiñskiet al., 2002).
The objective of the study is the calculation of the maximum absolute and relative measurement errors of the water conductivity coefficient determined by the instan-taneous profiles method in the soil water potential range from 9.81 to 981 hPa.
MATERIAL
Determination of relative and absolute values of maxi-mum errors of the water conductivity coefficient for the analysed soil water potentials was done on the basis of data bases collected in the Institute of Agrophysics PAS, Lublin, Poland (Walczaket al., 2002; S³awiñski, 2003).
The analysis included average values of water conductivity coefficients from the measurements on 415 soil samples for water potential values of 9.81, 31, 98.1, 156, 310, 490.5 and about 981 hPa. The measurement results were divided into classes according to soil texture.The basic feature that differentiates the physical characteristics of the investigated soils is the mechanical composition. The divi-sion into granulometric groups is fundamental for selecting soil types, therefore the analyzed data base is divided into four groups (Table 1). The groups included sandy soils (187 samples), loamy soils (15 samples), silty soils (86 samples) and clay soils (27 samples).
METHODS OF MEASUREMENT AND CALCULATION The water conductivity coefficient in the unsaturated zone of the soil was determined by the instantaneous profiles method with the application of a TDR (Time Domain Re-flectometry) meter that enables the simultaneous measure-ment of volumetric water content, salinity, temperature and
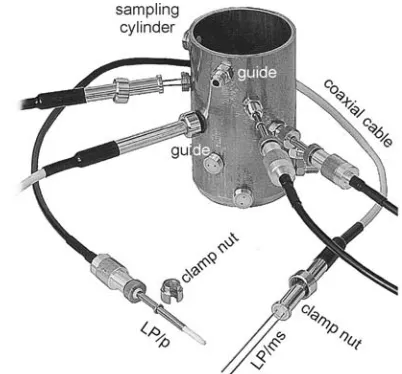
water potential in the column with the soil sample of 125 cm3volumeiein a cylinder 5 cm high, 5.5 cm in diameter (Easy Test, 2004; Malickiet al., 1992; Plaggeet al., 1990; Walczak et al., 1993). The TDR sensors for volumetric water content and microtensiometers for soil water poten-tial measurements were located in the soil samples 1, 2.5 and 4 cm from the bottom of the column. The sampling cylinder, TDR sensors (LP/ms) for volumetric water content and microtensiometers (LP/p) for soil water potential measure-ments (Easy Test, 2004) are presented in Fig. 1. The soil in the column was saturated by capillary rise and after reaching saturation the cylinder was sealed from the top and left for 24 h to achieve thermodynamic equilibrium. After that, the top cover was removed to start the process of drying by eva-poration. During evaporation the installed sensors measured water content and water potential in soil layers where they were positioned and the collected data were stored in computer memory.The soil water content and water poten-tial data are separated in time and space and they are scattered, therefore the following Bezier function was ap-plied for smoothing (Bezier, 1971; Plaggeet al., 1990):
jiN x N
N
N i i x x x i N
( ~) !
( )! !~( ~) ,
~ , , ..., =
- 1- - 0£ £1 =0
1
, (1) where:jiN( ~) is the interpolated value of current data pointx i(time or space),Nis the number of measured data points, ~
x is the weight of the applied Bezier function, under the condition:
jiN i
N
x ( ~)
=
å º
1
1 (2)
for all values of ~x. The application of the Bezier function gives the values of water contentq$( ~,z t~)and water potential
Fig. 1. Sampling cylinder, TDR sensors (LP/ms) for volumetric water content and microtensiometers (LP/p) for soil water potential measurements (Easy Test, 2004).
Granulometric groups
Sand 1-0.1 mm
(%)
Silt 0.1-0.02 mm
(%)
Clay <0.02 mm
(%) Sandy soils
Loamy soils Silty soils Clay soils
40-100 10-79
0-59 0-9
0-40 0-40 41-100
0-49
0-20 21-90 0-50 51-100
$( ~,~)
y z t interpolated in time-space coordinates on the data surfaces with the use of the following equations:
$( ~,~
) ( , ) ( ~) (~)
q z t q zj ti j z j t
i M j N j N i M
= å å
= =0 0
, (3)
$( ~,~) ( , ) ( ~) (~)
y z t y zj ti j z j t
i M j N j N i M
= å å
= =0 0
. (4)
Assuming that the process of water transport in the soil column proceeds in isothermal conditions (the laboratory was provided with an air-conditioning system) and that it is one-dimensional, the water flux through the given cross-section on the soil column,q(z,t), can be described by the Darcy equation (Kutilek and Nielsen, 1994) as follows:
q z t k z t
z ( , )=- ( )æ ( , )
-è
ç ö
ø ÷ y ¶y
¶ 1 , (5)
where y( , )z t is the water potential, z and t are the
coordinates of space and time, respectively, k( )y is the
unsaturated conductivity coefficient.
Alternatively, the water flux,q(z,t), can be calculated from the equation:
q z t z t
t dz
z z
( , )=-ò¶q( , ) 
0
, (6)
whereq( , )z t is the water content.
The water conductivity coefficient, , in the unsaturated zone can be calculated from the Eqs (5) and (6) as follows:
k z t t dz z t z z z ( ) ( , ) ( , ) y ¶q ¶ ¶y ¶ = ò -æ è ç ö ø ÷ 0 1 . (7)
The bottom boundary condition of the conducted experiment is:q z( 0, )t =0, wherez0is the closed ending of
the soil columniethe bottom of the column.
Due to the scatter of results calculated from the Eq. (7) and the requirement for interpolation of the water
conductivity coefficient values,k( )y, for the defined values
of soil water potential,y( , )z t , it is necessary to present the
dependence of the water conductivity coefficient from the soil water potential in the functional form. Thus the final step of determination of the water conductivity coefficient in the unsaturated zone by instantaneous profiles method is smoothing and interpolation of the calculated results. Various functions may be applied for this purpose, ex. poly-nomial. However, in literature there are many mathematical functions especially adopted for this purpose. One of them is the Van Genuchten equation (1980):
{
}
k KS
n n m
n m
( )
( ) [ ( ) ]
[ ( ) ] /
y ay ay
ay = - + + - -1 1 1 1 2
2 , (8)
where:KS– water conductivity coefficient at saturation,y–
soil water potential,a,nandm– parameters of the model.
The curve presented by the Eq. (8) is fitted to the measured points by the least square method.
The sources of random errors of the instantaneous profiles method were analyzed and discussed in many studies (Bertuzzi et al., 1997; Wind, 1969), therefore the following will concentrate on the maximum measurement error. The sources of the maximum measurement error of the method are:
- the water content measurement,
- the soil water potential measurement errors.
The accuracy and the sources of soil water content measurement errors were discussed by Skierucha (2000). He found that the error of TDR soil water content determi-nation originates mainly from the calibration of the method. Inclusion of soil solid phase influence on the calibration formula, in the form of corrections involving soil bulk density or porosity, decreases the absolute error of TDR water content measurement by the factor of two. The TDR hardware and software sources of reflectometric soil water content measurement errors are visible mainly for dry soils.
If the water conductivity coefficient is the function of
soil water content,q, and water potential,y:
k=k( , )q y, (9)
the expansion of the function k(q,y) into Taylor series
around the point (q+Dq y, +Dy), with the assumption that
then-partial derivatives exist and they are continuous, gives the following:
k( ) k( ) k k
!
q q, y+ y q, y 
¶q q ¶ ¶y y
+ = + æ +
è
çç öø÷÷+
D D 1 D D
1
1
2 2
2 2
2 2 2
2 2 ! ( ) ( ) .. ¶ ¶q q 
¶q¶y q y 
¶y y
k k k
D + D D + D
æ è ç ç ö ø ÷ ÷+ . (10) Skipping the elements containing Dq andDy in the
power of two and higher and replacingDqandDywith the
absolute values of the maximal error, results in the following equation presenting the absolute error of the method:
Dkmax=¶kD max+ k D max ¶q q
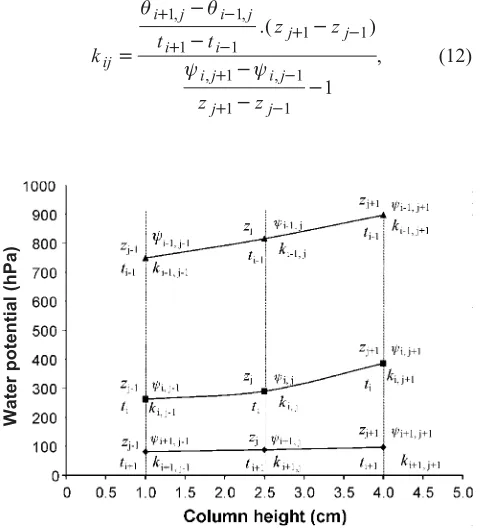
The profiles in Figs 2 and 3 present soil water potential and water content in individual layers of the soil column for the chosen time. The indexesiandjrepresent time and layer, respectively. Each data point in these figures represents water content or water potential at the given time and height referenced to the column bottom. Also, it is characterized by
the individual water conductivity coefficient,ki,j. According
to the Eq. (7) the value of water conductivity coefficient in the node (i,j) can be calculated from:
k t t
z z
ij
i j i j
i i j j
i j i j
=
--
-+
-+ - +
-+
-q q
y y
1 1
1 1 1 1
1
, ,
, ,
.( )
1
1 1
1 zj+ -zj-
-, (12)
or after the replacements:
Dqj q q
i i
i j i j
+
-+
-=
-1 1
1 1
,
, , , (13)
Dyi y y
j j
i j i j
+
-+
-=
-1 1
1 1
,
, , , (14)
Dt=ti+1-ti-1, (15)
Dz=zj+1-zj-1, (16)
the following comes from Eq. (12):
k z
z t
i j
j i j
i j j ,
, ,
( )
( )
=
+
+
-D D
D D D
q y
1 1 2
1 1 . (17)
The calculation of respective differentials according to the Eq. (11) gives the equation defining the maximal absolute error of the method for determination of the water conductivity coefficient in the following form:
D D
D D D D
k z
z t
i j j
max , max
( )
( )
=
- +
+ -2 1 1
y q
+
-D D
D D D D
q
y y
j
i+1,i-1( )
( , ) max
z
z t
i j j
2
1 1 2 . (18)
The compatibility of units requires expressing soil water content and water potential in Eq. (18) in cm3cm-3and
in cm of H2O, respectively.
ASSUMED INPUT DATA
The differential method applied for the evaluation of the maximum relative and absolute measurement error of the water conductivity coefficient by instantaneous profiles method needs some general assumptions. The value of the maximal absolute error,Dkmax, in Eq. (18) was calculated for:
–Dqmax= 0.04 cm3cm-3– maximum measurement error of soil water content resulting from the accuracy of the applied measurement device (Easy Test, 2004). The producer states ±2% of absolute measurement error,
–Dymax= 16.14 cm H2O, which corresponds to about 16
hPa – maximal absolute error of water potential measure-ment of the applied measuremeasure-ment device (Easy Test, 2004); the producer states ±8 hPa of absolute measurement error, –Dz= 0.2 cm – numerical space interval resulting from the division of the measured volume into 20 elementary layers accounted for in the calculations,
Fig. 2.Water potential profiles in particular compartments of soil sample in chosen times.
Water
potential
(hPa)
Fig. 3.Water content profiles in particular compartments of soil sample in chosen times.
Water
content
–Dt= 0.05 days (24 h) – numerical time interval resulting from the division of the measurement time (average was 24 h) into 20 elementary time intervals accounted for in the calculations.
– Dqij+ -1,i 1 = 0.005 cm3cm-3 – average water content difference in successive measurement steps accounted for in the calculations.
–Dyij+ -1,j 1cm H2O – average water potential difference
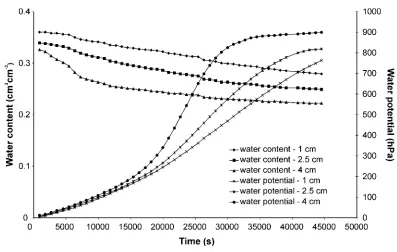
(Dwp) in successive measurement steps accounted for in the calculations is presented in Table 2. The assumed values come from the observations of the water content and water potential dynamics during the experiment (Fig. 4).
RESULTS
The example profiles of water content and water po-tential, derived from experimental data, in individual layers of the soil column are presented in Fig. 4. The collection of the data representing the retention characteristic at each layer of the soil sample took about twelve days.
The maximal absolute measurement errors,Dkmax, of
the water conductivity coefficient,k(y), for the analysed soil
water potentials were determined on the basis of Eq. (18) and the presented assumptions necessary for the
calcula-tions. Numerical values of this error are presented inTable 2
and graphically inFig. 5.
The calculated absolute error,Dk, depends on the soil
water potential and – indirectly – on the water content. It is the biggest for saturated soils with water potential values close to 9.81 hPa and it decreases almost linearly from about
0.1 to about 0.001 (cm day-1) for dry soils with water
poten-tial of 981 hPa. The basic elements included in the absolute error originate from the measurement errors of water content and water potential which are presented in the Eq. (18). The contribution of these elements to the absolute error varies with the value of water potential. For saturated and wet soils with water potential close to 9.81 hPa their impact is almost equal and the importance of the error generated by the water content measurement gradually increases with water poten-tial reaching 99% contribution in the total absolute error for water potential of 981 hPa. The contribution of water con-tent and water pocon-tential measurement errors to the
maxi-mum absolute error, Dkmax, of the determination of the
water conductivity coefficient is presented also in Fig. 5. Water potential
(hPa)
Dwp (cm H2O)
Dkmax (%) 9.8
31.0 98.1 156.0 310.2 490.5 981.0
1 3 5 10 15 25 25
0.0904 0.0135 0.0074 0.0034 0.0022 0.0013 0.0013
T a b l e 2.Average water potential difference (Dwp) in successive measurement accounted for in the calculations and maximal absolute error (Dkmax) of the determination of soil water conductivity coefficient by instantaneous profiles method for different soil water potentials
Generally, for water potenial values bigger than 98.1 the
value of Dkmax depends only on water content
measu-rement error.
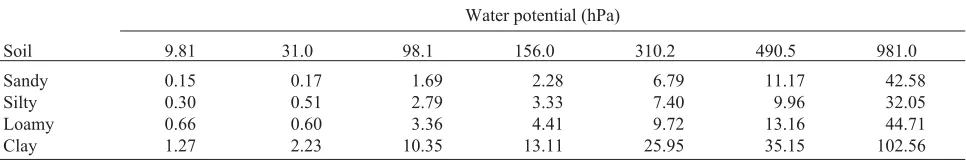
The average values of the relative maximum measure-ment error of the water content conductivity coefficient,k, can be calculated on the basis of the maximum absolute measurement errors (Fig. 5 and Table 2) and average values ofk. The results are presented inTable 3 andFig. 6. The change of water conductivity coefficient with the water potential is about five orders of magnitude.
CONCLUSIONS
1. The absolute measurement error of soil water conductivity coefficient by instantaneous profiles method originates mainly from reflectometric water content measu-rements. It can be lowered by individual TDR calibration of investigated soils and by inclusion in the calibration of the influence of the soil solid phase by its bulk density or porosity correction.
2. In the soil water potential range from saturation to field capacity (water potential 156 hPa) the maximum relative error of soil water conductivity coefficient does not exceed 10% with the exception of clay soils. This range of soil water potential values is important to plants because water is easily accessible and the majority of hydrological research concentrates in the range.
3. For the soil water potential close to the wilting point the maximum relative measurement error is about 50% (depending on the soil group). Its value results from low values of the measured water conductivity coefficients. However, in this measurement range water is not accessible for most of the plants and the effect of making a big measurement error does not influence the evaluation of the water flux in the soil profile.
Fig. 5.Maximum absolute error of the determination of soil water conductivity coefficient by instantaneous profiles method and the contribution of water content and water potential measurement errors to this error.
Fig. 6. Values of average relative maximum error of water conductivity coefficient of the investigated soils.
Water potential (hPa)
Soil 9.81 31.0 98.1 156.0 310.2 490.5 981.0
Sandy Silty Loamy Clay
0.15 0.30 0.66 1.27
0.17 0.51 0.60 2.23
1.69 2.79 3.36 10.35
2.28 3.33 4.41 13.11
6.79 7.40 9.72 25.95
11.17 9.96 13.16 35.15
42.58 32.05 44.71 102.56
REFERENCES
Bertuzzi P., Mohrath D., Bruckler L., Gaudu J., and Bourlet M., 1997.Wind’s evaporation method. Experimental equipment and error analysis. Proc. Int. Workshop ‘Characterization and Measurement of the Hydraulic Properties of Unsaturated Media’. Riverside, California, October 22-24, Part 1, 323-328.
Bezier P.E., 1971. Example of existing system in the motor industry: the unisurf system. Proc. Roy. Soc., London, A321, 207-218.
Dalton F.N. and Van Genuchten M.Th., 1986.The time-domain reflectometry method for measuring soil water content and salinity. Geoderma, 38, 237-243.
Dasberg S. and Dalton F.N., 1985.Time domain reflectometry measurements of soil water content and electrical con-ductivity. Soil Sci. Soc. Am. J., 49, 293.
Easy Test,2004.Soil water status monitoring devices. Institute of Agrophysics PAS, Lublin, Poland.
Henric J.F., Legros J.P., S³awiñski C., and Walczak R.T., 1996.
Yield prediction for winter wheat in Eastern Poland (Grabów) using the ACCESS-II model. Int. Agrophysics, 10, 239-247,
Kutilek M. and Nielsen D.R., 1994. Soil Hydrology. Catena Verlag, Cremlinger-Destedt.
Malicki M.A., Plagge R., Renger M., and Walczak R.T., 1992.
Application of time-domain reflectometry (TDR) soil water content miniprobe for the determination of unsaturated soil water characteristics from undisturbed soil cores. Irrigation Sci., 13, 65-72.
Malicki M.A. and Skierucha W., 1989.A manually controlled TDR soil moisture meter operating with 300 ps. rise needle pulse. Irrigation Sci., 10, 153-163.
Mohrath D., Brucler L., Bertuzzi P., Gaudu J.C., and Bourlet M., 1997. Error analysis of an evaporation method for determining hydrodynamic properties in unsaturated soil. Soil Sci. Soc. Am. J., 6, 725-735.
Plagge R., Renger M., and Roth C.H., 1990.A new laboratory equipment to quickly determine the unsaturated hydraulic conductivity of undisturbed soil cores within a wide range of textures. Z. Pflanz. Bodenkunde, 133, 39-45.
Skierucha W., 2000.The accuracy of soil moisture measurement by TDR technique. Int. Agrophysics, 14, 417-426.
S³awiñski C., 2003.Influence of soil solid phase parameters on values of hydraulic conductivity coefficient (in Polish). Acta Agrophysica, 90, 1-75.
S³awiñski C., Sobczuk H., Stoffregen H., Walczak R., and Wessolek G., 2002.Effect of data resolution on soil hy-draulic conductivity prediction. J. Plant Nutr. Soil Sci., 165, 45-49.
Sobczuk H.A., Plagge R., Walczak R.T., and Roth Ch.H., 1992.
Laboratory equipment and calculation procedure to rapidly determine hysteresis of some soil hydrophysical properties under nonstady flow conditions. Z. Pflanz. Bodenkunde, 155, 157-163.
Tamari S., Brucler L., Halbertsma J.M., and Chadoeuf J., 1993. A simple method for determining soil hydraulic properties in laboratory. Soil Sci. Soc. Am. J., 57, 642-651.
Vachaud G., Dencette C., Sonko S., and Thony J.L., 1978.
Methodes de caracterisation hydrodynamique in situ d’un sol non sature. Ann. Agron., 29, 1-36.
Van Genuchten M.Th., 1980. A closed form equation for predicting the hydraulic conductivity of unsaturated soils. Soil Sci. Soc. Am. J., 44, 892-898.
Walczak R.T., Ostrowski J., Witkowska-Walczak B., and S³awiñski C., 2002.Hydrophysical characteristics of mineral arable Polish soils (in Polish). Acta Agrophysica, 79, 5-64.
Walczak R.T. and S³awiñski C., 2001.Thermodynamics of soil processes (in Polish). Acta Agrophysica, 48, 133-139.
Walczak R.T., S³awiñski C., Malicki M.A., and Sobczuk H., 1993. Measurement of water characteristics in soil using TDR technique. Water characteristics of loess soil under different treatment. Int. Agrophysics, 7, 175-182.
Watson K.K., 1966.An instantaneous profile method for determi-ning the hydraulic conductivity of unsaturated porous mate-rials. Water Resour. Res., 2, 709-715.
Wendroth O., Ehlers W., Hopmans J., Kage H., Halbertsma J., and Wosten J.H.M., 1993.Reevaluation of the evaporation method for determining hydraulic functions in unsaturated soils. Soil Sci. Soc. Am. J., 57, 1436-1443.