VOLUME NO. 3 (2013), ISSUE NO. 10 (OCTOBER) ISSN 2231-5756
A Monthly Double-Blind Peer Reviewed (Refereed/Juried) Open Access International e-Journal - Included in the International Serial Directories
Indexed & Listed at:
Ulrich's Periodicals Directory ©, ProQuest, U.S.A., EBSCO Publishing, U.S.A., Cabell’s Directories of Publishing Opportunities, U.S.A., Open J-Gage, India [link of the same is duly available at Inflibnet of University Grants Commission (U.G.C.)],
Index Copernicus Publishers Panel, Polandwith IC Value of 5.09 &number of libraries all around the world.
VOLUME NO. 3 (2013), ISSUE NO. 10 (OCTOBER) ISSN 2231-5756
INTERNATIONAL JOURNAL OF RESEARCH IN COMMERCE, IT & MANAGEMENT
A Monthly Double-Blind Peer Reviewed (Refereed/Juried) Open Access International e-Journal - Included in the International Serial Directories
ii
CONTENTS
CONTENTS
CONTENTS
CONTENTS
Sr.
No.
TITLE & NAME OF THE AUTHOR (S)
Page No.
1. MACHINE USAGE BASED ON PRODUCT MIX IN MANUFACTURING CLASSIFICATIONS DR. SURESH TULSHIRAM SALUNKE & SHWETA SURESH TULSHIRAM SALUNKE
1 2. A STUDY ON THE CHALLENGES FACED BY TIRUPUR GARMENT EXPORTERS
DR. S. SARAVANAN & S. MOHANRAJ
5 3. HEALTHCARE AND MEDICAL TOURISM: RETROSPECT AND PROSPECT
R. VEERAPPAN, J. SASIGANTH, FR. ANGELO JOSEPH & A. JOE ROBINSON
8 4. TRADE BETWEEN INDIA AND ASEAN COUNTRIES FOR AGRICULTURAL AND MINERAL PRODUCTS: EXPLORING COMPATIBILITY THROUGH
REVEALED COMPARATIVE ADVANTAGE DR. B. P. SARATH CHANDRAN
11
5. RELEVANCE OF ISLAMIC BANKING TO INDIAN ECONOMY S. NAYAMATH BASHA & DR. BADIUDDIN AHMED
17 6. AXIOMATIZATION OF THE PREFERENCE CORE IN MULTICRITERIA COOPERATIVE GAMES
A. SUGUMARAN & P. VISHNU PRAKASH
21 7. CORPORATE GOVERNANCE & INFORMATION SECURITY: AN ANALYTICAL STUDY
DR. BADIUDDIN AHMED, SYED HAMID MOHIUDDIN QUADRI & IRFANUDDIN
25 8. RUPEE FALLING: DOLLAR IS ON HORSE RIDE
M. RAMU, M. S. K. VARMA & S.SUDHEER
28 9. AN ANALYSIS OF INDIAN AUTOMOBILE INDUSTRY: SLOWDOWN AS AN OPPORTUNITY FOR NEW DEVELOPMENT
DR. ANKUR KUMAR RASTOGI & NITIN GOPAL GUPTA
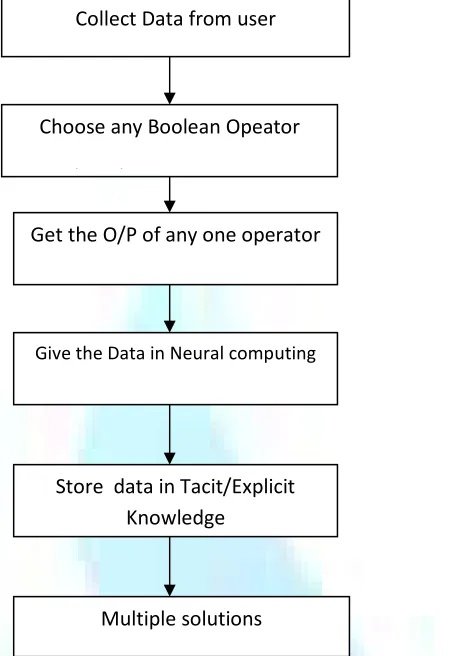
36 10. A PROPOSED THEORY OF NEURAL NETWORKS IN KNOWLEDGE MANAGEMENT FOR AN EXPERT SYSTEM
V. SUMALATHA
41 11. THE INFORMATION MANAGEMENT PRACTICES OF BHIRDAR UNIVERSITY
DR. MATEBE TAFERE
45 12. VEBLENIAN SOCIO-PSYCHOLOGICAL MODEL: AN ETHNOGRAPHIC STUDY
DR. K. ABRAHAM & DR. M. RAJASEKHAR
51 13. INNOVATIVE TEACHING AND LEARNING TO ENHANCE CRITICAL THINKING AND REFLECTIVE PRACTICE, FOR QUALITY AND RELEVANCE OF
HEALTH EDUCATION DR. BIRHANU MOGES ALEMU
56
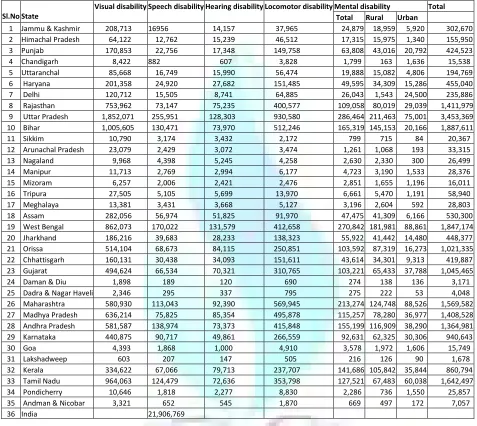
14. A STATISTICAL ANALYSIS OF PHYSICALLY DISABLED POPULATION: DEVELOPMENT IN REHABILITATION SCHEMES DR. CHINNA ASHAPPA
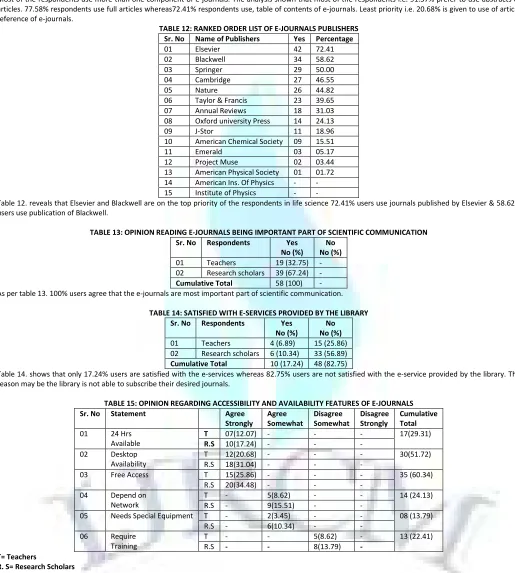
68 15. USE OF E-JOURNALS IN THE DISCIPLINES OF LIFE SCIENCE IN K.U.K: AN ANALYTICAL STUDY
ANIL KUMAR
72 16. ISLAMIC MICROFINANCE-FINANCING THE POOREST OF THE POOR
DILAWAR AHMAD BHAT
79 17. USE OF CLOUD COMPUTING IN MANUFACTURING COMPANIES
SHEETAL MAHENDHER & SUBASHREE
83 18. CLIMATE CHANGE AND VECTOR BORNE DISEASES: THE ROLE OF GIS & REMOTE SENSING
DIVYA GEORGE & DR. R. RAJKUMAR
88 19. FEASIBILITY STUDY FOR IMPLEMENTATION OF AN ACTIVITY- BASED COSTING SYSTEM (ABCS) IN ALLOY STEEL INDUSTRIES (ASI)
MAJID NILI AHMADABADI & ALI SOLEIMANI
96 20. AN IMPACT OF SERVICE QUALITY ON LOYAL CUSTOMER AND ITS SATISFACTION: A STUDY OF PRIVATE BANKS IN KANPUR CITY (INDIA)
RAVINDRA KUMAR KUSHWAHA, GURPREET SINGH, NEERAJ JOSHI & NEHA PUSHPAK
101 21. A STUDY ON EMPLOYEE PERFORMANCE APPRAISAL IN CEMENT INDUSTRY IN TAMILNADU
DR. M. RAGURAMAN, R. VEERAPPAN, S. ALBERT, M. SUGANYA & S. HEMAVATHY
107 22. DETERMINANTS OF MOBILE BANKING TECHNOLOGY ADOPTION OF COMMERCIAL BANKS IN ETHIOPIA
ZEMENU AYNADIS, TESFAYE ABATE & ABEBE TILAHUN
110 23. EVALUATION OF LIC’S EFFICIENCY IN GENERATING CAPITAL FUNDS UNDER ULIP’S SCHEMES
MANJUSHREE S
117 24. EVALUATION OF COST MANAGEMENT TOOLS: A STUDY ON MULTINATIONAL PHARMACEUTICAL COMPANIES OF BANGLADESH
TAHMINA AHMED
120 25. AN EVALUATION OF NEW ZEALAND’S EXPORT COMPETITIVENESS USING SHIFT-SHARE ANALYSIS
DR. SATYA GONUGUNTLA
126 26. INCREASING INTERNATIONAL COLLABORATIONS IN SCIENCE AND TECHNOLOGY AROUND THE WORLD, AND ITS PATTERNS IN INDIA
WITH SPECIAL REFERENCE TO INDO-GERMAN COLLABORATION MUNEEB HUSSAIN GATTOO & MUJEEB HUSSAIN GATTOO
131
27. A STUDY ON THE ETHICAL INVESTMENT DECISION MAKING IN INDIAN RELIGIOUS ORGANISATIONS BINCY BABURAJ KALUVILLA
135 28. GREEN MARKETING MIX: A STRATEGY FOR SUSTAINABLE DEVELOPMENT
L. NANDA GOPAL
138 29. CONSIDERING RELATIONSHIP BETWEEN CASH WITH CAPITAL COST AND FINANCIAL FLEXIBILITY
AHMAD GHASEMI & DR. ROYA DARABI
140 30. UNDERSTANDING THE GREEKS AND THEIR USE TO MEASURE RISK
SANJANA JUNEJA
146
VOLUME NO. 3 (2013), ISSUE NO. 10 (OCTOBER) ISSN 2231-5756
INTERNATIONAL JOURNAL OF RESEARCH IN COMMERCE, IT & MANAGEMENT
A Monthly Double-Blind Peer Reviewed (Refereed/Juried) Open Access International e-Journal - Included in the International Serial Directories
iii
CHIEF PATRON
CHIEF PATRON
CHIEF PATRON
CHIEF PATRON
PROF. K. K. AGGARWAL
Chairman, Malaviya National Institute of Technology, Jaipur
(An institute of National Importance & fully funded by Ministry of Human Resource Development, Government of India)
Chancellor, K. R. Mangalam University, Gurgaon
Chancellor, Lingaya’s University, Faridabad
Founder Vice-Chancellor (1998-2008), Guru Gobind Singh Indraprastha University, Delhi
Ex. Pro Vice-Chancellor, Guru Jambheshwar University, Hisar
FOUNDER
FOUNDER
FOUNDER
FOUNDER PATRON
PATRON
PATRON
PATRON
LATE SH. RAM BHAJAN AGGARWAL
Former State Minister for Home & Tourism, Government of Haryana
Former Vice-President, Dadri Education Society, Charkhi Dadri
Former President, Chinar Syntex Ltd. (Textile Mills), Bhiwani
CO
CO
CO
CO----ORDINATOR
ORDINATOR
ORDINATOR
ORDINATOR
AMITA
Faculty, Government M. S., Mohali
ADVISORS
ADVISORS
ADVISORS
ADVISORS
DR. PRIYA RANJAN TRIVEDI
Chancellor, The Global Open University, Nagaland
PROF. M. S. SENAM RAJU
Director A. C. D., School of Management Studies, I.G.N.O.U., New Delhi
PROF. M. N. SHARMA
Chairman, M.B.A., Haryana College of Technology & Management, Kaithal
PROF. S. L. MAHANDRU
Principal (Retd.), Maharaja Agrasen College, Jagadhri
EDITOR
EDITOR
EDITOR
EDITOR
PROF. R. K. SHARMA
Professor, Bharti Vidyapeeth University Institute of Management & Research, New Delhi
CO
CO
CO
CO----EDITOR
EDITOR
EDITOR
EDITOR
DR. BHAVET
Faculty, Shree Ram Institute of Business & Management, Urjani
EDITORIAL ADVISORY BOARD
EDITORIAL ADVISORY BOARD
EDITORIAL ADVISORY BOARD
EDITORIAL ADVISORY BOARD
DR. RAJESH MODI
Faculty, Yanbu Industrial College, Kingdom of Saudi Arabia
PROF. SANJIV MITTAL
University School of Management Studies, Guru Gobind Singh I. P. University, Delhi
PROF. ANIL K. SAINI
VOLUME NO. 3 (2013), ISSUE NO. 10 (OCTOBER) ISSN 2231-5756
INTERNATIONAL JOURNAL OF RESEARCH IN COMMERCE, IT & MANAGEMENT
A Monthly Double-Blind Peer Reviewed (Refereed/Juried) Open Access International e-Journal - Included in the International Serial Directories
iv
DR. SAMBHAVNA
Faculty, I.I.T.M., Delhi
DR. MOHENDER KUMAR GUPTA
Associate Professor, P. J. L. N. Government College, Faridabad
DR. SHIVAKUMAR DEENE
Asst. Professor, Dept. of Commerce, School of Business Studies, Central University of Karnataka, Gulbarga
ASSOCIATE EDITORS
ASSOCIATE EDITORS
ASSOCIATE EDITORS
ASSOCIATE EDITORS
PROF. NAWAB ALI KHAN
Department of Commerce, Aligarh Muslim University, Aligarh, U.P.
PROF. ABHAY BANSAL
Head, Department of Information Technology, Amity School of Engineering & Technology, Amity
University, Noida
PROF. A. SURYANARAYANA
Department of Business Management, Osmania University, Hyderabad
DR. SAMBHAV GARG
Faculty, Shree Ram Institute of Business & Management, Urjani
PROF. V. SELVAM
SSL, VIT University, Vellore
DR. PARDEEP AHLAWAT
Associate Professor, Institute of Management Studies & Research, Maharshi Dayanand University, Rohtak
DR. S. TABASSUM SULTANA
Associate Professor, Department of Business Management, Matrusri Institute of P.G. Studies, Hyderabad
SURJEET SINGH
Asst. Professor, Department of Computer Science, G. M. N. (P.G.) College, Ambala Cantt.
TECHNICAL ADVISOR
TECHNICAL ADVISOR
TECHNICAL ADVISOR
TECHNICAL ADVISOR
AMITA
Faculty, Government M. S., Mohali
FINANCIAL ADVISORS
FINANCIAL ADVISORS
FINANCIAL ADVISORS
FINANCIAL ADVISORS
DICKIN GOYAL
Advocate & Tax Adviser, Panchkula
NEENA
Investment Consultant, Chambaghat, Solan, Himachal Pradesh
LEGAL ADVISORS
LEGAL ADVISORS
LEGAL ADVISORS
LEGAL ADVISORS
JITENDER S. CHAHAL
Advocate, Punjab & Haryana High Court, Chandigarh U.T.
CHANDER BHUSHAN SHARMA
Advocate & Consultant, District Courts, Yamunanagar at Jagadhri
SUPERINTENDENT
SUPERINTENDENT
SUPERINTENDENT
SUPERINTENDENT
VOLUME NO. 3 (2013), ISSUE NO. 10 (OCTOBER) ISSN 2231-5756
INTERNATIONAL JOURNAL OF RESEARCH IN COMMERCE, IT & MANAGEMENT
A Monthly Double-Blind Peer Reviewed (Refereed/Juried) Open Access International e-Journal - Included in the International Serial Directories
v
CALL FOR MANUSCRIPTS
CALL FOR MANUSCRIPTS
CALL FOR MANUSCRIPTS
CALL FOR MANUSCRIPTS
We invite unpublished novel, original, empirical and high quality research work pertaining to recent developments & practices in the areas of Computer Science & Applications; Commerce; Business; Finance; Marketing; Human Resource Management; General Management; Banking; Economics; Tourism Administration & Management; Education; Law; Library & Information Science; Defence & Strategic Studies; Electronic Science; Corporate Governance; Industrial Relations; and emerging paradigms in allied subjects like Accounting; Accounting Information Systems; Accounting Theory & Practice; Auditing; Behavioral Accounting; Behavioral Economics; Corporate Finance; Cost Accounting; Econometrics; Economic Development; Economic History; Financial Institutions & Markets; Financial Services; Fiscal Policy; Government & Non Profit Accounting; Industrial Organization; International Economics & Trade; International Finance; Macro Economics; Micro Economics; Rural Economics; Co-operation; Demography: Development Planning; Development Studies; Applied Economics; Development Economics; Business Economics; Monetary Policy; Public Policy Economics; Real Estate; Regional Economics; Political Science; Continuing Education; Labour Welfare; Philosophy; Psychology; Sociology; Tax Accounting; Advertising & Promotion Management; Management Information Systems (MIS); Business Law; Public Responsibility & Ethics; Communication; Direct Marketing; E-Commerce; Global Business; Health Care Administration; Labour Relations & Human Resource Management; Marketing Research; Marketing Theory & Applications; Non-Profit Organizations; Office Administration/Management; Operations Research/Statistics; Organizational Behavior & Theory; Organizational Development; Production/Operations; International Relations; Human Rights & Duties; Public Administration; Population Studies; Purchasing/Materials Management; Retailing; Sales/Selling; Services; Small Business Entrepreneurship; Strategic Management Policy; Technology/Innovation; Tourism & Hospitality; Transportation Distribution; Algorithms; Artificial Intelligence; Compilers & Translation; Computer Aided Design (CAD); Computer Aided Manufacturing; Computer Graphics; Computer Organization & Architecture; Database Structures & Systems; Discrete Structures; Internet; Management Information Systems; Modeling & Simulation; Neural Systems/Neural Networks; Numerical Analysis/Scientific Computing; Object Oriented Programming; Operating Systems; Programming Languages; Robotics; Symbolic & Formal Logic; Web Design and emerging paradigms in allied subjects.
Anybody can submit the soft copy of unpublished novel; original; empirical and high quality research work/manuscriptanytime in M.S. Word format after preparing the same as per our GUIDELINES FOR SUBMISSION; at our email address i.e. [email protected] or online by clicking the link online submission as given on our website (FOR ONLINE SUBMISSION, CLICK HERE).
GUIDELINES FOR SUBMISSION OF MANUSCRIPT
GUIDELINES FOR SUBMISSION OF MANUSCRIPT
GUIDELINES FOR SUBMISSION OF MANUSCRIPT
GUIDELINES FOR SUBMISSION OF MANUSCRIPT
1. COVERING LETTER FOR SUBMISSION:
DATED: _____________
THE EDITOR IJRCM
Subject: SUBMISSION OF MANUSCRIPT IN THE AREA OF.
(e.g. Finance/Marketing/HRM/General Management/Economics/Psychology/Law/Computer/IT/Engineering/Mathematics/other, please specify)
DEAR SIR/MADAM
Please find my submission of manuscript entitled ‘___________________________________________’ for possible publication in your journals.
I hereby affirm that the contents of this manuscript are original. Furthermore, it has neither been published elsewhere in any language fully or partly, nor is it under review for publication elsewhere.
I affirm that all the author (s) have seen and agreed to the submitted version of the manuscript and their inclusion of name (s) as co-author (s).
Also, if my/our manuscript is accepted, I/We agree to comply with the formalities as given on the website of the journal & you are free to publish our contribution in any of your journals.
NAME OF CORRESPONDING AUTHOR: Designation:
Affiliation with full address, contact numbers & Pin Code: Residential address with Pin Code:
Mobile Number (s): Landline Number (s): E-mail Address: Alternate E-mail Address:
NOTES:
a) The whole manuscript is required to be in ONE MS WORD FILE only (pdf. version is liable to be rejected without any consideration), which will start from the covering letter, inside the manuscript.
b) The sender is required to mentionthe following in the SUBJECT COLUMN of the mail:
New Manuscript for Review in the area of (Finance/Marketing/HRM/General Management/Economics/Psychology/Law/Computer/IT/ Engineering/Mathematics/other, please specify)
c) There is no need to give any text in the body of mail, except the cases where the author wishes to give any specific message w.r.t. to the manuscript. d) The total size of the file containing the manuscript is required to be below 500 KB.
e) Abstract alone will not be considered for review, and the author is required to submit the complete manuscript in the first instance.
f) The journal gives acknowledgement w.r.t. the receipt of every email and in case of non-receipt of acknowledgment from the journal, w.r.t. the submission of manuscript, within two days of submission, the corresponding author is required to demand for the same by sending separate mail to the journal.
2. MANUSCRIPT TITLE: The title of the paper should be in a 12 point Calibri Font. It should be bold typed, centered and fully capitalised.
3. AUTHOR NAME (S) & AFFILIATIONS: The author (s) full name, designation, affiliation (s), address, mobile/landline numbers, and email/alternate email address should be in italic & 11-point Calibri Font. It must be centered underneath the title.
VOLUME NO. 3 (2013), ISSUE NO. 10 (OCTOBER) ISSN 2231-5756
INTERNATIONAL JOURNAL OF RESEARCH IN COMMERCE, IT & MANAGEMENT
A Monthly Double-Blind Peer Reviewed (Refereed/Juried) Open Access International e-Journal - Included in the International Serial Directories
vi
5. KEYWORDS: Abstract must be followed by a list of keywords, subject to the maximum of five. These should be arranged in alphabetic order separated by commas and full stops at the end.
6. MANUSCRIPT: Manuscript must be in BRITISH ENGLISH prepared on a standard A4 size PORTRAIT SETTING PAPER. It must be prepared on a single space and single column with 1” margin set for top, bottom, left and right. It should be typed in 8 point Calibri Font with page numbers at the bottom and centre of every page. It should be free from grammatical, spelling and punctuation errors and must be thoroughly edited.
7. HEADINGS: All the headings should be in a 10 point Calibri Font. These must be bold-faced, aligned left and fully capitalised. Leave a blank line before each heading.
8. SUB-HEADINGS: All the sub-headings should be in a 8 point Calibri Font. These must be bold-faced, aligned left and fully capitalised. 9. MAIN TEXT: The main text should follow the following sequence:
INTRODUCTION
REVIEW OF LITERATURE
NEED/IMPORTANCE OF THE STUDY
STATEMENT OF THE PROBLEM
OBJECTIVES
HYPOTHESES
RESEARCH METHODOLOGY
RESULTS & DISCUSSION
FINDINGS
RECOMMENDATIONS/SUGGESTIONS
CONCLUSIONS
SCOPE FOR FURTHER RESEARCH
ACKNOWLEDGMENTS
REFERENCES
APPENDIX/ANNEXURE
It should be in a 8 point Calibri Font, single spaced and justified. The manuscript should preferably not exceed 5000 WORDS.
10. FIGURES &TABLES: These should be simple, crystal clear, centered, separately numbered & self explained, and titles must be above the table/figure. Sources of data should be mentioned below the table/figure. It should be ensured that the tables/figures are referred to from the main text.
11. EQUATIONS:These should be consecutively numbered in parentheses, horizontally centered with equation number placed at the right.
12. REFERENCES: The list of all references should be alphabetically arranged. The author (s) should mention only the actually utilised references in the preparation of manuscript and they are supposed to follow Harvard Style of Referencing. The author (s) are supposed to follow the references as per the following:
•
All works cited in the text (including sources for tables and figures) should be listed alphabetically.•
Use (ed.) for one editor, and (ed.s) for multiple editors.•
When listing two or more works by one author, use --- (20xx), such as after Kohl (1997), use --- (2001), etc, in chronologically ascending order.•
Indicate (opening and closing) page numbers for articles in journals and for chapters in books.•
The title of books and journals should be in italics. Double quotation marks are used for titles of journal articles, book chapters, dissertations, reports, working papers, unpublished material, etc.•
For titles in a language other than English, provide an English translation in parentheses.•
The location of endnotes within the text should be indicated by superscript numbers.PLEASE USE THE FOLLOWING FOR STYLE AND PUNCTUATION IN REFERENCES: BOOKS
•
Bowersox, Donald J., Closs, David J., (1996), "Logistical Management." Tata McGraw, Hill, New Delhi.•
Hunker, H.L. and A.J. Wright (1963), "Factors of Industrial Location in Ohio" Ohio State University, Nigeria.CONTRIBUTIONS TO BOOKS
•
Sharma T., Kwatra, G. (2008) Effectiveness of Social Advertising: A Study of Selected Campaigns, Corporate Social Responsibility, Edited by David Crowther & Nicholas Capaldi, Ashgate Research Companion to Corporate Social Responsibility, Chapter 15, pp 287-303.JOURNAL AND OTHER ARTICLES
•
Schemenner, R.W., Huber, J.C. and Cook, R.L. (1987), "Geographic Differences and the Location of New Manufacturing Facilities," Journal of Urban Economics, Vol. 21, No. 1, pp. 83-104.CONFERENCE PAPERS
•
Garg, Sambhav (2011): "Business Ethics" Paper presented at the Annual International Conference for the All India Management Association, New Delhi, India, 19–22 June.UNPUBLISHED DISSERTATIONS AND THESES
•
Kumar S. (2011): "Customer Value: A Comparative Study of Rural and Urban Customers," Thesis, Kurukshetra University, Kurukshetra.ONLINE RESOURCES
•
Always indicate the date that the source was accessed, as online resources are frequently updated or removed.WEBSITES
VOLUME NO. 3 (2013), ISSUE NO. 10 (OCTOBER) ISSN 2231-5756
INTERNATIONAL JOURNAL OF RESEARCH IN COMMERCE, IT & MANAGEMENT
A Monthly Double-Blind Peer Reviewed (Refereed/Juried) Open Access International e-Journal - Included in the International Serial Directories
1
MACHINE USAGE BASED ON PRODUCT MIX IN MANUFACTURING CLASSIFICATIONS
DR. SURESH TULSHIRAM SALUNKE
VICE PRESIDENT
ENGINEERING & BUSINESS DEVELOPMENT
UNIVERSITY OF MUMBAI
MUMBAI
SHWETA SURESH TULSHIRAM SALUNKE
M. TECH. (EM) STUDENT
MANIPAL INSTITUTE OF TECHNOLOGY
MANIPAL UNIVERSITY
UDPI
ABSTRACT
This research elucidates an algorithm for the calculation of optimal product mix and machine utilization for a manufacturing process employing trainee engineers. A study of the important parameters influencing the system performance has also been conducted.
KEYWORDS
Product Mix, Capacity, Time reduction.
INTRODUCTION
he product and process for mass production are characterized by high non-productive time, unavoidable delays and occasional inspections as stated by Hitomi(n.d). Application of group technology consist [trainee engineers] along with process experts environment has been known to offer the advantages of mass production and result into cost reduction. In order to derive maximum benefit of group manufacture it is essential to allocate the technical team based part facilities, to different machines in an optimal manner. Each part family may visit a number of machines but not necessarily all the machines in the system. However, for this situation the amount of effort needed to work out an optimal schedule, for a real life problem, would be quite large. By adopting simpler manufacturing business strategy would comprise of a number of cells with each cell being provided with different number of machines of varied types. One cell would process a particular group of part. A system of this type is shown in Fig. 1:
For the manufacturing system in Fig. 1, the machine loading and product mix decisions are major problems. These problems have been investigated analytically with mathematical programming techniques by Hanssman (1999). From trainee engineer stand point, the production scheduling problem has been investigated by Hitomi and Ham (1978) whereas, Petrov (1977) has dealt with flow type group production planning. PERA (1950) has considered the loading and scheduling of work in a trainee engineers cell. Hitomi (n.d) and Ham (1978) have also developed optimizing algorithm for machine capacity planning and product mix in a single machine and multi stage production systems.
In this paper the authors have presented an efficient computer algorithm for the determination of optimum product-mix and machine-load, in a manufacturing system of the type shown a manufacturing system of the type shown in Fig. 1. for three different conditions.
MODEL FORMULATION
The cells in Fig. 1 comprise of a number of machines of varied types grouped in accordance with the operations necessary for a part family. Each group consists of two or more parts and is processed fully in a single cell. The present work is based on the model of Hitomi et al. (1982) however, the solution methodology and the computer algorithm developed by the authors are more accurate and less tedious to use.
MACHINE LOADING AND PRODUCT-MIX ANALYSIS
The assumptions:
1. The case of a single machine is treated and the total time available on the machine is‘d’.
2. Parts to be processed are classified into M groups. The group index is denoted by I (= 1, 2, …… M). In group Gi, Ni parts are included where the part index denoted by J (= 1, 2, … Ni).
3. The group production time consists of group set up time, and sum of job production times for each group. 4. Job-production time is equal to job set-up time, and unit production time multiplied by lot size.
5. All the parts are cylindrical in shape and produced by turning.
T
Fig. 1
Cell1
Cell2
Cell3
Cell4
Team/Gr 1 N11 N12
Team/Gr 2 J21 J22 J23
Team/Gr 3 J31, J32
Team/Gr 4 J41 J42 J43
VOLUME NO. 3 (2013), ISSUE NO. 10 (OCTOBER) ISSN 2231-5756
INTERNATIONAL JOURNAL OF RESEARCH IN COMMERCE, IT & MANAGEMENT
A Monthly Double-Blind Peer Reviewed (Refereed/Juried) Open Access International e-Journal - Included in the International Serial Directories
2
It is required to determine the optimal numbers of the kinds of parts to be produced within a limited time available as well as to decide the optimum machining speed for all products so as to maximize the production rate.
(A) Part Manufacturing Time :
The manufacturing time of jth part is ith group is given by eqn.1. The part is machined in a single pass at a constant feed and cost factor, tool life, set time etc. are all deterministic. It is assumed that the Taylors tool life relationship (VTn
= C) holds true.
= + + 1/ 1 − 1
(for j = 1, 2 … N1 and i = 1, 2, … M)
Unit production time from above equation when plotted against the cutting speed provides a typical bell shaped curve for which optimal cutting speed is obtained as:
= − 1
When processing Jij in a lot of size Jij the total manufacturing time is given by :
= +
(for j = 1, 2, … Ni and I = 1, 2, … M) (B) Manufacturing Cost
The cost of a part can be expressed as a function of machining speed (Vij)(c). This cost is given by below equations :
= + + ! + + " 1/
For j=1,2….Nij and i=1,2…M
Optimal product mix decision is to be based on the fact that optimal amount of part has to be produced within the prescribed delivery period.
ANALYSIS FOR SOLUTION
The solution of eqns. 6-8 has been attempted for three cases
Case I : (Q = d)
For this case all Xij’s are 1 and the objective function assumes the form
# $ % = &
'
(
& lij
,
(
The optimal solution is:
- = . = 0
(For j=1,2….Ni and j=1,2….M)
Case II : When Q > d
The problem is now replaced by the following 0-1 type linear program. The machining speed is initially set corresponding to maximum production rate. The objective function of CASE 1 i.e. maximized subject to Pij = Pij(t). A heuristic takes into account the selection and rejection criterion. The part with maximum production time including the set up has been considered as a candidate for rejection.
Case III : When Q < d
The unique feasible speed values for machining all the parts are based on the minimization of the total cost with the slack time. Based on this criterion the problem assumes a non-linear nature as below:
Minimize,
0 = &
'
(
[ αSi + & αζSij + LijQij Vij ζ]
,
(
The optimal solution, Vij, to this non-linear problem is solved using KUHN-TUCKER conditions . This function is termed ‘Efficiency sensitive function’. Properties of this function can be derived with following consideration. At the minimal points, the machining speed for minimum production cost is derived from the conditions.
9:
9; Vij t = 0 and
@ABC @ABD = 0
Exponent, nij varies between O<nij < 1 due to which (1/nij-1) > 0. Also, since (Vij(c) < Vij(t) therefore, from rij – bij, ij > 0 and in the speed range Eij obtained as :
The relationship between sensitivity function and speed is shown in Fig. 2.
RESULTS
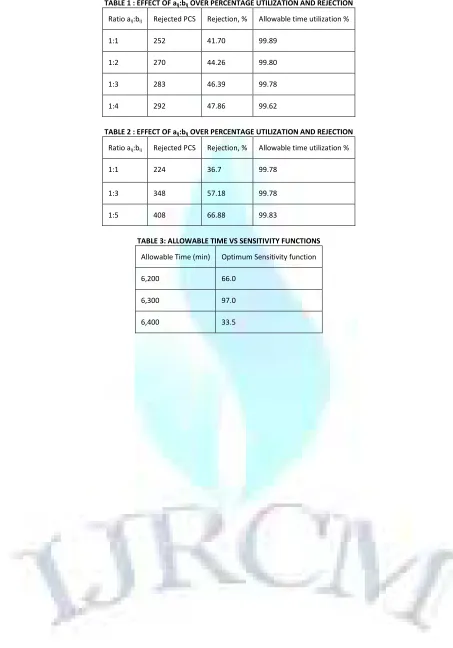
The programme has been tested for the data of Hitomi & Ham and the following conclusions have been derived : 1. Proposed procedure is computationally simpler than the branch and bound algorithm of Hitomi & Ham (1978).
2. It is noted (Table 1) that for aji remaining constant, as bij increases the rejection increases slowly. The percentage utilization is almost same, nearly 100%.
Fig. 2
VOLUME NO. 3 (2013), ISSUE NO. 10 (OCTOBER) ISSN 2231-5756
INTERNATIONAL JOURNAL OF RESEARCH IN COMMERCE, IT & MANAGEMENT
A Monthly Double-Blind Peer Reviewed (Refereed/Juried) Open Access International e-Journal - Included in the International Serial Directories
3
3. Effect of variation of ratio of tool replacement time and preparation time is given in Table 2. 4. For Q<d, the sensitivity function drops faster with marginal increase in allowable time (Table 3).
CONCLUSIONS
The approach developed to compute the optimal product mix in a GT manufacturing cell is efficient, simpler and takes less computational time. This also offers high machine utilization. It has been observed that the preparation time has maximum influence on the production rate. There is a significant relationship between the optimum value of sensitivity function and allowable time.
REFERENCES
1. Abe, Masahiro and Takeo Hoshi. “Corporate Finance and Human Resource Management.” June 2004. 2. F. & S.W.Hess, Management Technology, Vol. 1, No.1, 1960 m p. 349.
3. Hanssman, F. & S.W.Hess, Management Technology, Vol. 1, No.1, 1999 m p. 349.
4. Hanssman, Keizai Koho Center, Japan 2005: An International Comparison. Tokyo: Keizai Koho Center, 2005. 5. Hitomi, K & I. Ham, Journ. Engg. & Ind. ASME, Vol. 100, 1978, pp 370-374.
6. Hitomi, K. & Ham, Trans. ASME, Aug. 77 p. 759.
7. Hitomi, K. & I. Ham, Journ. Engg. & Ind. ASME, Vol. 1982, pp 363-368.
8. Kuhn, H.W. & A.W.Tucker, proc. II Berkley Symposium on Mathematical Statistics and Probability, 1950, pp 481-492. 9. Lomnicki, Z.A., Opr. Res. Q 16, 1965, p. 89.
10. North, Douglass C. Understanding the Process of Economic Change. Princeton, NJ: Princeton University Press, 2005.
11. Threadgold, David and Yuki Allyson Honjo, “Japanese Regional Banks: Suburban Values.” Tokyo: Fox-Pitt, Kelton Swiss Re Capital Markets (Japan), 6 May 2005.
12. Tisley, R. F.A. Lewis & D.F.Gallway, Anni. CIRP, 1977, pp 269-271.
13. Tsuru, Shigeto. Japan’s Capitalism. Cambridge: Cambridge University Press, 1993.
14. Vietor, Richard H.K. “Japan: Deficits, Demography and Deflation.” Boston MA: Harvard Business School case Study 9-706-004, Rev. 22 Sept. 2005.
15. Yasuaki, Chijiwara. “Insights Into Japan-U.S. Relations On the Eve of the Iraq War: Dilemmas over ‘Showing the Flag.’” Asian Survey, Vol. 45, No. 6 (Nov/Dec. 2005), pp. 843-664.
NOMENCLATURE
Aij Preparation time for part j of group i, min/pc
Bij Tool-replacement time for part j of group i.
Cij 1 min tool life machining speed for part j of group i.
Nij Slope constant of the Taylor’s tool life equation for part j of group i
Pij Maximum production rate per unit production time for part j of group i.
Sij Job set up time for part j of group I, min/lot.
ββββIj Machining over head for part j of group i.
λλλλIj Machining over head for part j of group i.
1ij No. of pieces in the lot Jij
Gij Speed dependent unit production cost (Rs./min)
Si Group set up time for the group G1 (min/group0
Vij Machining speed for the lot Jij (m/min)
Xij 0-1 variable for G1
∝ ∝∝
VOLUME NO. 3 (2013), ISSUE NO. 10 (OCTOBER) ISSN 2231-5756
INTERNATIONAL JOURNAL OF RESEARCH IN COMMERCE, IT & MANAGEMENT
A Monthly Double-Blind Peer Reviewed (Refereed/Juried) Open Access International e-Journal - Included in the International Serial Directories
4
TABLE 1 : EFFECT OF aij:bij OVER PERCENTAGE UTILIZATION AND REJECTION
Ratio aij:bij Rejected PCS Rejection, % Allowable time utilization %
1:1 252 41.70 99.89
1:2 270 44.26 99.80
1:3 283 46.39 99.78
1:4 292 47.86 99.62
TABLE 2 : EFFECT OF aij:bij OVER PERCENTAGE UTILIZATION AND REJECTION
Ratio aij:bij Rejected PCS Rejection, % Allowable time utilization %
1:1 224 36.7 99.78
1:3 348 57.18 99.78
1:5 408 66.88 99.83
TABLE 3: ALLOWABLE TIME VS SENSITIVITY FUNCTIONS
Allowable Time (min) Optimum Sensitivity function
6,200 66.0
6,300 97.0
VOLUME NO. 3 (2013), ISSUE NO. 10 (OCTOBER) ISSN 2231-5756
INTERNATIONAL JOURNAL OF RESEARCH IN COMMERCE, IT & MANAGEMENT
A Monthly Double-Blind Peer Reviewed (Refereed/Juried) Open Access International e-Journal - Included in the International Serial Directories
5
A STUDY ON THE CHALLENGES FACED BY TIRUPUR GARMENT EXPORTERS
DR. S. SARAVANAN
HEAD
DEPARTMENT OF B.COM INFORMATION TECHNOLOGY
DR. N.G.P ARTS & SCIENCE COLLEGE
DR. N.G.P NAGAR
S. MOHANRAJ
ASST. PROFESSOR
DEPARTMENT OF INTERNATIONAL BUSINESS
DR. N.G.P ARTS & SCIENCE COLLEGE
DR.N.G.P NAGAR
ABSTRACT
This study highlights the challenges faced by Tirupur garment exporters and its impact on export business, the research shows that the Tirupur knitwear export industry has registered 10-15 per cent growth every year is seeing business down with problems that started almost four years ago, though there are hopes of revival. The problems started in 2007-08 with the rupee appreciating against the dollar. Then, it was losses in Forex derivatives, slowdown in the U.S., closing down of processing units, and now the economic slowdown in the European Union. While all these have had an impact on exports, what worries Tirupur more is that its garments are becoming expensive in the international market. Some of the big overseas buyers have moved out of the Indian knitwear town to Bangladesh in the last two years. Business is estimated to have dropped by nearly 25 per cent.
KEYWORDS
Free Trade Agreement, Preferential Trade Agreement, Tirupur Exporters Association, Apparel Export Promotion Council.
INTRODUCTION
anaging globalization is one of the biggest challenges in Indian garment industry. The Indian garment industry is vital to the economy of the country. It is one of the largest industrial sector in India and a leading foreign exchange earner. The exporters of Indian textile and clothing have grown under the environment of MFA quota for over two decades. The Indian textile and clothing trade is facing a tough competition due to liberalization of trade under WTO. The post quota period commencing 1st
Jan 2005, the industry has in an expansionary phase, keen to cut down on flab accumulated by it over the ten years of quota enforcement on India by the developed world. With competition being free- for- all in the post quota phase, the industry has felt the urgent need to cut down on available costs to stay competitive. The Indian garment export industry has shown tremendous potential for growth in the coming few decades. The first knitwear unit in Tirupur was set up in 1925 and the growth of the industry was slow till late 1930s. A series of strikes in late 1930s in knitting factories in the neighboring towns of Salem and Madurai resulted in the opening of new firms in Tirupur. Subsequently, it emerged as the prominent centre for knitwear in South India by 1940s. In 1942, 34 units were engaged in the production of knitwear all these units were composite mills and the production was carried out in the same unit (sic). There are also references to some units performing specific tasks / operations like bleaching and dyeing, located in the larger units. By 1961, the number of units rose to 230 and till early 1970s, the industry catered only to the domestic market. These units were mostly composite mills without any subcontracting system of production. It was in the 1980s, the export market began to expand and subsequently Tirupur emerged as the largest exporter of cotton knitwear from the country, accounting for roughly 80 percent of the total cotton knitwear exporters.
REVIEW OF LITERATURE
Soundariya Preetha (2012) in her article “Fading fortunes of Tirupur” point out that Wages and dyeing and finishing charges in Tirupur are more than 15 per cent higher compared to Bangladesh, say a couple of leading exporters in the town. A hanger manufacturer hiked the per unit price by Rs.10 recently because of the increasing use of generator sets to tide over the power problem. These are small factors that add to the costs, they point out. Nearly 60 per cent of Tirupur's export supply is to the European Union. With the economic slowdown in the European countries, orders have dropped. Further, Bangladesh has zero duty access to the European Union under the General System of Preferences. This makes Bangladesh goods cheaper by 10 per cent. A large number of international brands say that they are able to get goods at lower prices from other countries, add the exporters.
Sakthivel(2012) in his article “Most Tirupur units limping back to normalcy” pointed out that India first raised its voice of concern when the EU countries’ sop was extended to Pakistan as a relief measure to help that country come out of the devastating floods last year,” This bilateral move will have a detrimental effect on the Indian textile industry as Pakistan is one of our major competitors.
The signing of FDI and FTA with the EU is expected to be a game changer and hopes to revive this industry back to its original scale. This decision is an enabling policy that will open up new windows of opportunity to modernize the retail sector. The Indian industry will benefit to a great extent once global retailers will start setting up local operations here and sourcing products from local manufacturers.
Sunil Patwari (2013) “Indian textile exporters pin hopes on EU-India FTA” said The textile and garment exporters of India are pinning hopes on Free Trade Agreement (FTA) between the European Union (EU) and India as it is expected to boost their exports to the EU. The EU is a major export market for Indian textile and garment exports. So by signing the EU-India FTA, there will be an increase. “Our neighboring countries such as Pakistan and Bangladesh are enjoying duty-free exports to the EU in yarn, fabric and garments. Once the India EU FTA is in place, we will be able to compete with these countries in exports,” he informs. As the production cost of apparels is increasing in China, we expect to receive more export orders from the European Union
OBJECTIVES OF THE STUDY
1. To study in detail about Tirupur garment industry
2. To study the role of AEPC and its impact on garment exporters
3. To analyze the factors which acts as a problem for Tirupur garment exporters 4. To offer suggestions based on the study
METHODOLOGY
The study was conducted by using both primary and secondary data. Primary data were collected through structured questionnaire using convenient random sampling method. The secondary data was collected from various, journals, magazines, news papers and web sites
VOLUME NO. 3 (2013), ISSUE NO. 10 (OCTOBER) ISSN 2231-5756
INTERNATIONAL JOURNAL OF RESEARCH IN COMMERCE, IT & MANAGEMENT
A Monthly Double-Blind Peer Reviewed (Refereed/Juried) Open Access International e-Journal - Included in the International Serial Directories
6
SAMPLE DESIGN AND SAMPLE SIZE
100 sample units in Tirupur are selected adopting convenient random sampling method
LIMITATIONS OF THE STUDY
The study was restricted to the particular place only. The study considers the data from Tirupur only The sample size was restricted to 100 because of tome factor
DATA ANALYSIS AND INTERPRETATION
PERCENTAGE ANALYSIS
TABLE 1: THE LEVEL OF SATISFACTION WITH OVERALL PERFORMANCE OF AEPC Particulars No. of Respondents Percentage
Highly satisfied 32 32%
Satisfied 38 38%
Neither satisfied nor dissatisfied 10 10%
Dissatisfied 14 14%
Highly dissatisfied 6 6%
Total 100 100
Source: Primary Data
The above table clearly indicates the satisfactory level of exporters on overall performance of AEPC. Out of 100 samples taken for study, 38% of the respondents are satisfied, 32% of the respondents are highly satisfied, 10% of the respondents are neither satisfies nor dissatisfied , 14% of the respondents are dissatisfied and 6% of the respondents are highly dissatisfied.
TABLE 2: THE LEVEL OF SATISFACTION TOWARDS EXPORT PROMOTION POLICIES INITIATED BY GOVERNMENT OF INDIA Particulars No. of Respondents Percentage
Highly satisfied 26 26%
Satisfied 60 60%
Neither satisfied nor dissatisfied 6 6%
Dissatisfied 4 4%
Highly dissatisfied 4 4%
Total 100 100
Source: Primary Data
The above table shows that level of satisfaction towards export promotion policies initiated by government of India. Out of 100 samples taken for study, 26% of the respondents are satisfied, 60% of the respondents are highly satisfied, 6% of the respondents are neither satisfied nor dissatisfied, 4% of the respondents are dissatisfied and 4% of the respondents are highly dissatisfied.
Ho: There is no significant relationship between the experience in export business and level of satisfaction towards export promotion policies initiated by government of India.
TABLE 3: SHOWING THE EXPERIENCE IN EXPORT BUSINESS & LEVEL OF SATISFACTION TOWARDS EXPORT PROMOTION POLICIES INITIATED BY GOVERNMENT OF INDIA
Experience in export business
Level of satisfaction towards export promotion policies
Highly Satisfied
Satisfied Neither
satisfied/dissatisfied
Dissatisfied Highly dissatisfied
Total chi -square
Less than 5 years 1 8 2 0 2 13 Degree of freedom=12 Level of
significance=0.05 Table value=21.026 Calculated value=1105.53
5-10 years 23 15 3 3 0 44
10-15 years 0 14 0 0 0 14
Above 15 years 2 23 1 1 2 29
Total 26 60 6 4 4 100
It is found from the above table the table value is less than calculated value at 12 Degree of Freedom. Hypothesis is rejected. Hence it is conclude that there is a significant relationship between the experience in export business and level of satisfaction towards export promotion policies initiated by government of India. Ho: There is no significant relationship between the experience in export business and level of satisfaction towards overall performance of TEA.
TABLE4: SHOWING THE EXPERIENCE IN EXPORT BUSINESS AND LEVEL OF SATISFACTION TOWARDS OVERALL PERFORMANCE OF TEA experience in export
business
Level of satisfaction towards overall performance of TEA
Highly Satisfied
Satisfied Neither
satisfied/dissatisfied
Dissatisfied Highly dissatisfied
Total Chi -square
Less than 5 years 5 4 2 1 1 13 Degree of freedom=12 Level of
significance=0.05 Table value=21.026 Calculated value=212.679
5-10 years 15 12 11 3 3 44
10-15 years 5 3 0 3 3 14
Above 15 years 5 16 2 3 3 29
Total 30 35 15 10 10 100
It is found from the above table the table value is less than calculated value at 12 Degree of Freedom. Hypothesis is rejected. Hence it is conclude that there is a significant relationship between the experience in export business and level of satisfaction towards overall performance of TEA.
TABLE 5: SHOWING WEIGHTED AVERAGE RANKING FOR FACTORS INFLUENCING IMPORTER Factors influencing Importer Total Score WAS* Rank
Ability to execute orders on time 1077 10.77 1 Preferential trade Agreement 847 8.47 2 Social Government Stability 315 3.15 3 Exchange Rate 527 5.27 4 Fashion &Design 504 5.04 5 Better Quality 446 4.46 6 Plant efficiency 419 4.19 7 good infrastructure 397 3.97 8 Reliability and Relationship 393 3.93 9
low cost 315 3.15 10
VOLUME NO. 3 (2013), ISSUE NO. 10 (OCTOBER) ISSN 2231-5756
INTERNATIONAL JOURNAL OF RESEARCH IN COMMERCE, IT & MANAGEMENT
A Monthly Double-Blind Peer Reviewed (Refereed/Juried) Open Access International e-Journal - Included in the International Serial Directories
7
From the above table it is clear that.’ Ability to execute orders on time is the prime most factor influences importer to buy Indian garments. The second, third and fourth rank was secured by ‘PTA’, ‘Social and government stability’, ‘ Exchange rate’, respectively. ‘Fashion and design’, ‘ Better quality’, ‘Plant efficiency’, ‘ Good infrastructure’, Factors secured Fifth, Sixth, Seventh and Eight rank respectively. Ninth & Tenth rank was secured by ‘Reliability and Relationship’, ‘Low cost’ respectively.
TABLE 6: SHOWING WEIGHTED AVERAGE RANKING FOR CRITERIA THAT ACTS AS A COMPETITIVE EDGE FOR COMPRTITORS
Source: Primary Data *Weighted average Sore
The above table clearly depicts that. ‘FTA, PTA’ is the prime most criteria which act as a competitive edge for Tirupur garment exporters. ‘Lower import duty’, ‘Lower interest rate’, ‘Stability of labour force’, secured second, third and fourth rank respectively. The fifth, sixth and seventh rank was secured by ‘Low labour cost’, ‘cheap fabric’ and ‘Lower cost of raw material’ respectively.
FINDINGS
32% of the respondents are highly satisfied with overall performance of AEPC,14% are neither satisfied nor dissatisfied 30% of the respondents are satisfies with overall performance of TEA
26% of the respondents are highly satisfies with Export Promotion Policies Initiated By Government Of India 26% of the respondents feels china as their competitors ,20% feels Bangladesh as their competitors 20% of the respondents are not satisfied with availability of labour
30% of the respondents are not satisfied with availability of skilled labour 42% of the respondents feels that the wages are high
24% of the respondents are dissatisfies with export procedures
SUGGESTIONS
Free Trade Agreement with EU will place garment exports at par with Bangladesh garment exports, as India will also enjoy the custom free duty in EU like Bangladesh and the advantage gained out of it will be helpful for increasing garment exports to the EU market. If Free Trade Agreements (FTA) is not possible across the board in near future, the Government can take a decision to have sector wise agreement including textiles industry
Ten per cent excise duty imposed on branded readymade garment should be removed
Governments have to increase the DBK rate to support the exporters and it must store the necessary cotton because of increase in cotton price and surplus cotton can be exported.
TEA recommends banks to provide the following measures to tackle the current situation:
•
A moratorium for a period of one year in repayment of term loan and interest.•
Waiver from payment of interest for one year as a special case.•
Restructuring of the loans without any additional provision to be done by the banks.CONCLUSION
Tirupur have the ability to take up small orders or large orders at short notice. It is also able to produce the entire range of woven wear and knitwear at low cost with reasonably good quality within specified schedules. However, Tirupur are constrained by occasional delays in delivery. It also suffers from failures to meet standards demanded by higher price niche markets and inability to compete with China, Bangladesh and Sri Lanka in the low price product segment. Non-tariff barriers emerged along with quota phase out (on account of environmental and social issues like child labour and personal safety norms) also affected the growth of the study region. Its inability to reap benefits of economies of scale due to fragmented holdings is yet another threat. At the same time, it also failed to reap the full benefits of a cluster model due to absence of professionalism and snail pace government systems.
REFERENCES
1. “AEPC taking ‘DISHA’ to exporters” (2011) Apparel online Dec1-15, p.40. 2. “Apparel exports dip by17%.”(2010)The Indian textile journal, Jan,p.8. 3. “Apparel price may fall only after February” (2011) Apparel views Sep, p.16.
4. “Bangladesh ahead of India in knitwear exports” (2011) Asian textile journal November, p.16. 5. “China records highest apparel exports to US”(2009) The Stitch times April, p.16 .
6. “EU import of apparel steady with growth of 17.90% in value and 3.09% increase in volumes” (2011) Apparel online Oct 1-15, p.56. 7. “Export incentive of 5% duty credit for cotton” (2009) Textile Excellence, March1-15,p 2.
8. “Exports need government support” (2009) The Apparel Times, 1 Jan-Feb, p.30.
9. karuppusamy.R. (2012) “Tirupur exporters and their strength.” Global research analysis, 1(5)/Nov, p. 8-14. 10. Soundariya Preetha (2012) Fading fortunes of Tirupur. The Hindu, march 11,2012
11. “Vietnam poised to pip India in apparel exports” (2009) The Stitch times, May, p.16.
Influencing factors Total score WAS* Rank
FTA,PTA 536 5.36 1
VOLUME NO. 3 (2013), ISSUE NO. 10 (OCTOBER) ISSN 2231-5756
INTERNATIONAL JOURNAL OF RESEARCH IN COMMERCE, IT & MANAGEMENT
A Monthly Double-Blind Peer Reviewed (Refereed/Juried) Open Access International e-Journal - Included in the International Serial Directories
8
HEALTHCARE AND MEDICAL TOURISM: RETROSPECT AND PROSPECT
R. VEERAPPAN
ASST PROFESSOR
DEPARTMENT OF BUSINESS ADMINISTRATION
SACRED HEART COLLEGE (AUTONOMOUS)
TIRUPATTUR
J. SASIGANTH
DEPARTMENT OF MANAGEMENT STUDIES
ASST PROFESSOR
SACRED HEART COLLEGE (AUTONOMOUS)
TIRUPATTUR
FR. ANGELO JOSEPH
HEAD
DEPARTMENT OF BUSINESS ADMINISTRATION
SACRED HEART COLLEGE (AUTONOMOUS)
TIRUPATTUR
A. JOE ROBINSON
STUDENT
SACRED HEART COLLEGE (AUTONOMOUS)
TIRUPATTUR
ABSTRACT
There was no tourism in the beginning, Tourism is getting out of the usual rut of things and going away from one’s home base for some rest and recreation. It was about meeting new people, seeing new places and having new experiences. The things have come a long way from there as Now, tourism is no longer a singular activity, and it is not about simply having a good time goofing off. These days it is ‘thematic tourism’. Tourism has evolved in to sports tourism, eco-tourism, bio eco-tourism, aqua eco-tourism, heritage eco-tourism, beach tourism and so on. Fast jumping on to the thematic tourism bandwagon is Medical Tourism or Health Tourism. Health tourism refers to the increasing tendency among people living where medical services are either very expensive or not available to travel overseas in search of more affordable health options, often packaged with tourist attractions. Today India has become one of the fastest growing economic nations in the field of Medical Tourism. India is one of the leading players in the Medical Tourism industry today. It requires overcoming all the weakness and the barriers to become the emerging industry in the coming years.
KEYWORDS
healthcare, medical tourism.
INTRODUCTION
simple way to explain the concept of medical tourism would be to say that it is not a standalone effort of either the healthcare or the tourism industry, but is an integrated and collaborative approach from both the industries. India is ranked among the top five international holiday destinations when Independent Traveler conducted a poll in 134 countries. India is rated amongst the world’s top ten “must see destinations”. Hopefully, today we are in a better position to sell our tourism services to the rest of the world.
India is probably the only country that offers various categories of tourism. These include history tourism, adventure tourism, medical tourism, spiritual tourism, adventure tourism, medical tourism, beach tourism etc. The countries where medical tourism is being actively prompted include Greece, South Africa, Japan, India, Malaysia, Philippines and Singapore. India has the most competent doctors and world class medical facilities. The merits of Medical Tourism in India are best medical treatment, high quality medical care low wait time for treatments, Hospitality, Multi - Talented Doctors and nurses and fluency English Speaking Staff members.
Sports tourism, eco-tourism, bio tourism, aqua tourism, heritage tourism, beach tourism and so on where it has a fast jumping on to the thematic tourism bandwagon is Medical Tourism or Health Tourism. Health tourism refers to the increasing tendency among people living where medical services are either very expensive or not available to travel overseas in search of more affordable health options, often packaged with tourist attractions.
The World tourism Organization includes the following in its definition of medical tourism; medical care, sickness and well-being, rehabilitation and recuperation. The concept of Medical Tourism is not entirely new, As a matter of fact, as far back as 3,000 B.C. people with eye problems made pilgrimage to Tell Brak, Syria, where healing deities were said to perform miracles. Ancient Roman spas that were believed to cure an endless list of ailments still offer hope and relief to bathers today. As people travelled to these destinations they had inadvertently embarked on Medical Tourism.
According to the International Trade Centre, Geneva, the global demand for clinical services has estimated US$804 billion in the year 2000 itself, Where it is a large market and everybody seems to want a piece of the pie. Traditionally, the western countries were considered the leaders and front runners in good healthcare. Times have changed and these days developing nations too are able to offer the same, if not better services in terms of healthcare, technology, and comfort during recuperation and most importantly at affordable prices. As a matter of fact, healthcare costs less in some of these developing nations. This has caused many a person to seek alternate destination to cure their ills outside western countries.
VOLUME NO. 3 (2013), ISSUE NO. 10 (OCTOBER) ISSN 2231-5756
INTERNATIONAL JOURNAL OF RESEARCH IN COMMERCE, IT & MANAGEMENT
A Monthly Double-Blind Peer Reviewed (Refereed/Juried) Open Access International e-Journal - Included in the International Serial Directories
9
more and more women interested in enhancing their endowments at a reasonable cost, many medical practitioners in these developing countries want to get abreast of the problem.
In view of all these issues, medical tourism has blossomed in many countries as yet another opportunity to get better, look better, feel better, have a good time, see a new place and still have some money left over. And most importantly, they want to have it happens within this lifetime.
The healthcare facilities and the ability of India’s healthcare professionals are comparable to some of the best in the world in many areas. This coupled with a stable government with moderate outlooks in many areas and a multitude of holiday destinations make India ideal address for medical tourists. The India Medical Tourism industry although extremely lucrative, faces tremendous challenges from neighbor’s i.e. Thailand and Singapore. A sustained effort is needed by the Tourism Board and the Ministry of Health to overwhelm these challenges as soon as they appear. With the pie being as big as it is, India must acknowledge that the competition will mobilize all avenues within its means to garner as much as is possible.
In terms of facilities, we are not in short supply either. India has the right infrastructure, especially when we have comprehensive network of hospitals and clinics. Further, our healthcare professionals are conversant in the English language allowing us to better communicate with the tourists. Moderately conservative figures indicate half a million patients are traveling abroad for health purposes. India with its 5,000 years of medicine has just begun to formally claim its share. Hotels are a key part of the plan. Kerala hoteliers started the trend five years ago with their back water ayurvedic packages. Spas are just the latest phase of the trend.
The true size of the iceberg is always out of sight. Two external agencies, McKinsey and Messe Berlin have painted very bright pictures of medical tourism in India in a short eight years into the future.
QUALITY OF CARE OF THE DOCTORS
Americans and the British are already familiar with highly skilled Indian doctors at their local hospital down the street. What they may not know is that many of these doctors are heading back to India as the living and working conditions here for doctors have changed in the last 15 years or so since liberalization of the economy. India, with its extensive labour pool and extremely educated population is an excellent destination for world class medical treatment. Having had a long association with Great Britain, the English language is prevalent throughout the country.
Two key drawbacks to India, which both the public and private sector are working feverishly to change, are 1. Foreigners are required to obtain a visa to enter the country
2. Many areas outside of the major cities may be unsettling to American visitors who are not accustomed to seeing large scale poverty
This being said, both the hospitals and hotels are totally safe, modern, clean and have world class facilities. During the past few years, many of the top private hospitals in India have build brand new, ultra modern facilities and invested in the latest medical technology in order to lure international patients from around the world.
INDIA BECOMING THE MOST FAVORED MEDICAL TRAVEL DESTINATION
With 8 million tourists in 2012 with an additional of 4 million predicted for 2013, the Indian Tourism Ministry is placing medical travel and tourism on top priority. The National Healthcare Committee and the Indian Tourism Ministry have jointly organized workshops aimed at marketing the country’s medical travel industry and Indian medical tourism packages. The focus of these workshops is improvement in the quality and pricing of Indian medical tourism packages, developing competitive strategies and handling litigation issues.
IN INDIA THE STRONG TRADITION OF TRADITIONAL SYSTEMS OF HEALTH CARE IN KERALA
For example, Kerala Ayurveda centers have been established at multiple locations in various metro cities, thus highlighting the advantages of Ayrveda in health management. The health tourism focus has seen Kerala participate in various trade shows and expos wherein the advantages of this traditional form of medicine are showcased. A generic problem with medical tourism is that it reinforces the medicalised view of health care. By promoting the notion that medical services can be bought off the shelf from the lowest priced provider anywhere in the globe, it also takes away the press all its citizens. It is a deepening of the whole notion of health care that is being pushed today which emphasizes on technology and private enterprise. The important question here is for whom is ‘cost effective’ services to be urea from the government to provide comprehensive health provided. Clearly the services are “Cost Effective” for those who can pay and in addition come from countries where medical care costs are exorbitant – because of the failure of the government to provide affordable medical care. It thus attracts only a small fraction that can pay for medical care and leaves out large sections that are denied medical care but cannot afford to pay. The demand for cost effective specialized care is coming from the developed countries where there has been a decline in public spending ads rise in life expectancy and non communicable diseases that requires specialist services.
INDIA OFFERS WORLD CLASS MEDICAL FACILITIES
VOLUME NO. 3 (2013), ISSUE NO. 10 (OCTOBER) ISSN 2231-5756
INTERNATIONAL JOURNAL OF RESEARCH IN COMMERCE, IT & MANAGEMENT
A Monthly Double-Blind Peer Reviewed (Refereed/Juried) Open Access International e-Journal - Included in the International Serial Directories
10
SWOT ANALYSIS OF MEDICAL TOURISM
Strengths Weakness
• Quality services at affordable cost
• Vast supply of qualified doctors
• Strong presence in advanced healthcare
• International reputation of hospitals and doctors
• High confidence level in Indian Doctors
• Diversity of Tourism destination and experience
• No strong initiative to promote Medical Tourism
• Customer perception as a hygienic country
• Lack of uniform pricing policy
• No proper accreditation and regulation system for hospitals
• Low coordination between the various players in the industry – airline operations, hotels and hospitals
Opportunity Threats
• Increase demand for healthcare services from countries with aging population (US, UK)
• Reduce / Competitive cost of international travel
• Demand from countries with underdeveloped countries
• Present an opportunity for hospitals to tap the potential of its potential and leverage its business
• Strong Competition from countries like Thailand, Malaysia, Singapore
• Under investment in Health infrastructure
• Lack of Proper insurance policy for this sector
THE NEW ECONOMY IN MEDICAL TOURISM
It has now become tourism that the services sector is one of the biggest drivers of the India Economy. But it becomes a concrete reality for us in the bigger metros when we see the upward mobility of disadvantaged sections of the community. Young men and women in urban areas now have the prospect of taking up jobs that can rapidly improve their financial and social status. We are all now seeing the children of our domestic servants getting educated and becoming computer operators or call centre workers. Caste and creed are literally no bar for the sunrise industries, which are just hungrily looking for youth with a basic education and a knowledge of English.
The enthusiasm of private hospital care companies to make such investments stems from several studies which indicate that the substantially lower costs in India compared to developed countries are going to lead to a boom in medical tourism. A study by Ernst and young makes the projection that the medical tourism business may reach as much as two billion dollars annually by the year 2014 from the level of 333 million dollars in 2007.
The study which covers many areas of specialization notes that as far as only one segment, eye care is concerned, the country boasts impressive credentials. With 10,000 eye doctors in this country, the status of eye care and surgery is extremely high. Not only our doctors and eye care centers available in the big cities, it is pointed out that they are also available in smaller towns. Interestingly enough, there are even more Lasik centers in India than in many developed countries. Cost effectiveness and quality are said to be the two factors driving the flow of foreign patients to these eye care centers.
Besides, the cost of treatment in India has been estimated to be on an average one eighth to one fifth of those in the west in most areas of specialization. For instance, the Ernst and Young study has found that a cardiac procedure costs anywhere between 40,000 and 60,000 dollars in the US, 30,000 dollars in Singapore, 12,000 to 15,000 dollars in Thailand and only 3000 to 6000 dollars in India. Besides, surgeries costs are also lower not only due to cheaper rates charged by Indian Surgeons but also because of less litigation here. The cost of malpractice insurance in New York is about 1, 00,000 dollars as compared to 4000 dollars in India. One of the reasons for the growing influx of people seeking medical treatment in this country is the pressure on the health services of developed countries like the US and Europe. In the UK for instance, patients have to wait for months to be given critical operations while the lack of insurance makes medical treatment virtually unaffordable. India also has the potential to emerge as a hub for preventive health screening. A total health check up that could cost 350 pounds in the UK can cost as low as 84 dollars in this country. An MRI costs 60 dollars here compared to 700 dollars in New York.
CONCLUSION
Beauty, youth, and wellness are a huge area for growth and we need to promote the aggressively. Over the past few years alone, many countries have realized that an equally big opportunity lies in promoting the more conventional treatments. Some of this, of course, was always happening in the background – like people from Mauritius, Bangladesh and the Gulf coming to India for conventional surgeries and people from Japan flying to Singapore, Malaysia or Thailand for similar reasons. Only now, the nations have started pitching themselves as world class but inexpensive destinations for almost all health requirements.
Today India becomes the fastest growing economic nation due to the Medical Tourism. India is one of the leading players in the Medical Tourism industry today. It requires overcoming all the weakness and the barriers to become the emerging industry in the coming years.
India is not only cheaper but the waiting time is almost nil. This is due to the outburst of the private sector, which comprises of hospitals and clinics with the latest technology and best practitioners. If India will give more benefits to the foreign patients the patient’s arrival will improved fourth coming years. In 2020 the India will be the top leader in medical tourism
REFERENCES
1. Arnold K. Going under the knife abroad: medical tourism industry booms as health costs rise. The Monitor (McAllen, Texas) :A1. November 15, 2006. 2. Beat waiting lists with overseas op. Daily Express (UK) July 3, 2005.
3. Great Indian hospitality can be biz too. The Economic Times (India) July 29, 2005.
4. Hancock D. The Complete Medical Tourist – Your Guide to Inexpensive Cosmetic, Medical and Dental Surgery Abroad. London, UK: John Blake Publishing; 2006.
5. Jones CA, Keith LG. Medical tourism and reproductive outsourcing: the dawning of a new paradigm for healthcare. Int J Fertil Womens Med. 2006;51:251– 255.
6. Lancaster J. Surgeries, side trips for medical tourists. p. A1. Washington Post. October 21, 2004. 7. Leigh S. Reproductive ‘tourism’ USA Today. :D7. May 2, 2005.
8. MacReady N. Developing countries court medical tourists. Lancet. 2007;369:1849–1850.
9. Schult J. Beauty from Afar – A Medical Tourist's Guide to Affordable and Quality Cosmetic Care Outside the U.S. New York, NY: Stewart, Tabori & Chang; 2006.
10. Sen C. Thai health tourism gives India headache. The Economic Times (India) July 24, 2005.
VOLUME NO. 3 (2013), ISSUE NO. 10 (OCTOBER) ISSN 2231-5756
INTERNATIONAL JOURNAL OF RESEARCH IN COMMERCE, IT & MANAGEMENT
A Monthly Double-Blind Peer Reviewed (Refereed/Juried) Open Access International e-Journal - Included in the International Serial Directories
11
TRADE BETWEEN INDIA AND ASEAN COUNTRIES FOR AGRICULTURAL AND MINERAL PRODUCTS:
EXPLORING COMPATIBILITY THROUGH REVEALED COMPARATIVE ADVANTAGE
DR. B. P. SARATH CHANDRAN
ASSOCIATE PROFESSOR
VVM’S SHREE DAMODAR COLLEGE OF COMMERCE & ECONOMICS
MARGAO
ABSTRACT
In the post 1990 liberalized economic environment, India made concerted efforts to improve trade relations with ASEAN countries which culminated in signing of
the India – ASEAN Free Trade Agreement in August 2009. India - ASEAN FTA in trade in goods which will come to effect from 1st January 2010 envisages reduction
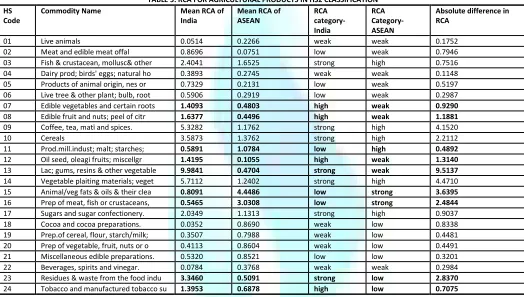
and elimination of tariffs in 89.34 percent of the product lines where as the remaining 10.66 percent product lines are kept outside the ambit of tariff reduction in the negative list. For any Regional Trade Agreement (RTA) to be successful, it is imperative on partner countries to have complementary trade structure to be exploited for mutual benefit. Countries which got complementary trade structure are likely to trade more where as economies with similar trade structure often struggle to improve trade share unless there is substantial intra industry trade. Revealed Comparative Advantage (RCA) indices, despite their limitations, provide a useful guide to underlying comparative advantage and offer a further insight into the competitiveness of participating countries and hence reveal the possibility of increased trade cooperation between them. In this direction the paper computed RCA between India and ASEAN countries for Agricultural Products and Mineral Products to understand the trade structure between them. Computation of RCA at finer levels of disaggregation helped to identify complementarity trade structure existing between India and ASEAN.
JEL CLASSIFICATION
F10, F14, F15
KEYWORDS
Agricultural Products, ASEAN, India, Regional Trade Agreements, Revealed Comparative Advantage.
INTRODUCTION
t is generally understood that complementarity in the trade structure of the countries facilitates more export and import between them and there is scope for mutual benefit from this increased trade. Hence identifying and measuring trade complementarity is an important task in realizing trade potential and for forging trade cooperation among countries. Regional Trade Agreements are effective and successful only if they are carefully designed by identifying and collating complementary products and sectors. There are different indices developed to examine the trade pattern and to see whether increased cooperation is possible between nations. In this paper an attempt is made to construct Revealed Compartive Index (RCA) for Agricultural and Mineral Products between India and ASEAN and to see whether increased trade cooperation between these two trading partners is possible or not in these very important sectors.
REVEALED COMPARATIVE ADVANTAGE (RCA) INDEX
Revealed Comparative Advantage Index shows how comparative is a product in countries export compared to the products share in world trade. A product with high RCA is
![FIG. 1.3: THE VECTOR-BORNE DISEASE EPISYSTEM ILLUSTRATING INTERACTIONS BETWEEN SELECTED ENVIRONMENTAL FACTORS WITH EFFECTS ON THE VECTOR–PATHOGEN–HOST EPIDEMIOLOGIC CYCLE [MODIFIED FROM SUTHERST (SUTHERST, 2004)]](https://thumb-us.123doks.com/thumbv2/123dok_us/209099.2015281/96.595.86.514.185.420/episystem-illustrating-interactions-environmental-pathogen-epidemiologic-modified-sutherst.webp)
