A Monthly Double-Blind Peer Reviewed (Refereed/Juried) Open Access International e-Journal - Included in the International Serial Directories Indexed & Listed at:
Ulrich's Periodicals Directory ©, ProQuest, U.S.A., EBSCO Publishing, U.S.A., Cabell’s Directories of Publishing Opportunities, U.S.A., Open J-Gage, India [link of the same is duly available at Inflibnet of University Grants Commission (U.G.C.)],
VOLUME NO.3(2013),ISSUE NO.10(OCTOBER) ISSN 2231-5756
INTERNATIONAL JOURNAL OF RESEARCH IN COMMERCE, IT & MANAGEMENT
CONTENTS
CONTENTS
CONTENTS
CONTENTS
Sr.No.
TITLE & NAME OF THE AUTHOR (S)
Page No. 1. MACHINE USAGE BASED ON PRODUCT MIX IN MANUFACTURING CLASSIFICATIONS
DR. SURESH TULSHIRAM SALUNKE & SHWETA SURESH TULSHIRAM SALUNKE
1
2. A STUDY ON THE CHALLENGES FACED BY TIRUPUR GARMENT EXPORTERS
DR. S. SARANANAN & S. MOHANRAJ
5
3. HEALTHCARE AND MEDICAL TOURISM: RETROSPECT AND PROSPECT
R. VEERAPPAN, J. SASIGANTH, FR. ANGELO JOSEPH & A. JOE ROBINSON
8
4. TRADE BETWEEN INDIA AND ASEAN COUNTRIES FOR AGRICULTURAL AND MINERAL PRODUCTS: EXPLORING COMPATIBILITY THROUGH REVEALED COMPARATIVE ADVANTAGE
DR. B. P. SARATH CHANDRAN
11
5. RELEVANCE OF ISLAMIC BANKING TO INDIAN ECONOMY
S. NAYAMATH BASHA & DR. BADIUDDIN AHMED
17
6. AXIOMATIZATION OF THE PREFERENCE CORE IN MULTICRITERIA COOPERATIVE GAMES
A. SUGUMARAN & P. VISHNU PRAKASH
21
7. CORPORATE GOVERNANCE & INFORMATION SECURITY: AN ANALYTICAL STUDY
DR. BADIUDDIN AHMED, SYED HAMID MOHIUDDIN QUADRI & IRFANUDDIN
25
8. RUPEE FALLING: DOLLAR IS ON HORSE RIDE
M. RAMU, M. S. K. VARMA & S.SUDHEER
28
9. AN ANALYSIS OF INDIAN AUTOMOBILE INDUSTRY: SLOWDOWN AS AN OPPORTUNITY FOR NEW DEVELOPMENT
DR. ANKUR KUMAR RASTOGI & NITIN GOPAL GUPTA
36
10. A PROPOSED THEORY OF NEURAL NETWORKS IN KNOWLEDGE MANAGEMENT FOR AN EXPERT SYSTEM
V. SUMALATHA
41
11. THE INFORMATION MANAGEMENT PRACTICES OF BHIRDAR UNIVERSITY
DR. MATEBE TAFERE
45
12. VEBLENIAN SOCIO-PSYCHOLOGICAL MODEL: AN ETHNOGRAPHIC STUDY
DR. K. ABRAHAM & DR. M. RAJASEKHAR
51
13. INNOVATIVE TEACHING AND LEARNING TO ENHANCE CRITICAL THINKING AND REFLECTIVE PRACTICE, FOR QUALITY AND RELEVANCE OF HEALTH EDUCATION
DR. BIRHANU MOGES ALEMU
56
14. A STATISTICAL ANALYSIS OF PHYSICALLY DISABLED POPULATION: DEVELOPMENT IN REHABILITATION SCHEMES
DR. CHINNA ASHAPPA
68
15. USE OF E-JOURNALS IN THE DISCIPLINES OF LIFE SCIENCE IN K.U.K: AN ANALYTICAL STUDY
ANIL KUMAR
72
16. ISLAMIC MICROFINANCE-FINANCING THE POOREST OF THE POOR
DILAWAR AHMAD BHAT
79
17. USE OF CLOUD COMPUTING IN MANUFACTURING COMPANIES
SHEETAL MAHENDHER & SUBASHREE
83
18. CLIMATE CHANGE AND VECTOR BORNE DISEASES: THE ROLE OF GIS & REMOTE SENSING
DIVYA GEORGE & DR. R. RAJKUMAR
88
19. FEASIBILITY STUDY FOR IMPLEMENTATION OF AN ACTIVITY- BASED COSTING SYSTEM (ABCS) IN ALLOY STEEL INDUSTRIES (ASI)
MAJID NILI AHMADABADI & ALI SOLEIMANI
96
20. AN IMPACT OF SERVICE QUALITY ON LOYAL CUSTOMER AND ITS SATISFACTION: A STUDY OF PRIVATE BANKS IN KANPUR CITY (INDIA)
RAVINDRA KUMAR KUSHWAHA, GURPREET SINGH, NEERAJ JOSHI & NEHA PUSHPAK
101
21. A STUDY ON EMPLOYEE PERFORMANCE APPRAISAL IN CEMENT INDUSTRY IN TAMILNADU
DR. M. RAGURAMAN, R. VEERAPPAN, S. ALBERT, M. SUGANYA & S. HEMAVATHY
107
22. DETERMINANTS OF MOBILE BANKING TECHNOLOGY ADOPTION OF COMMERCIAL BANKS IN ETHIOPIA
ZEMENU AYNADIS, TESFAYE ABATE & ABEBE TILAHUN
110
23. EVALUATION OF LIC’S EFFICIENCY IN GENERATING CAPITAL FUNDS UNDER ULIP’S SCHEMES
MANJUSHREE S
117
24. EVALUATION OF COST MANAGEMENT TOOLS: A STUDY ON MULTINATIONAL PHARMACEUTICAL COMPANIES OF BANGLADESH
TAHMINA AHMED
120
25. AN EVALUATION OF NEW ZEALAND’S EXPORT COMPETITIVENESS USING SHIFT-SHARE ANALYSIS
DR. SATYA GONUGUNTLA
126
26. INCREASING INTERNATIONAL COLLABORATIONS IN SCIENCE AND TECHNOLOGY AROUND THE WORLD, AND ITS PATTERNS IN INDIA WITH SPECIAL REFERENCE TO INDO-GERMAN COLLABORATION
MUNEEB HUSSAIN GATTOO & MUJEEB HUSSAIN GATTOO
131
27. A STUDY ON THE ETHICAL INVESTMENT DECISION MAKING IN INDIAN RELIGIOUS ORGANISATIONS
BINCY BABURAJ KALUVILLA
135
28. GREEN MARKETING MIX: A STRATEGY FOR SUSTAINABLE DEVELOPMENT
L. NANDA GOPAL
138
29. CONSIDERING RELATIONSHIP BETWEEN CASH WITH CAPITAL COST AND FINANCIAL FLEXIBILITY
AHMAD GHASEMI & DR. ROYA DARABI
140
30. UNDERSTANDING THE GREEKS AND THEIR USE TO MEASURE RISK
SANJANA JUNEJA
146
INTERNATIONAL JOURNAL OF RESEARCH IN COMMERCE, IT & MANAGEMENT
CHIEF PATRON
CHIEF PATRON
CHIEF PATRON
CHIEF PATRON
PROF. K. K. AGGARWAL
Chairman, Malaviya National Institute of Technology, Jaipur
(An institute of National Importance & fully funded by Ministry of Human Resource Development, Government of India)
Chancellor, K. R. Mangalam University, Gurgaon
Chancellor, Lingaya’s University, Faridabad
Founder Vice-Chancellor (1998-2008), Guru Gobind Singh Indraprastha University, Delhi
Ex. Pro Vice-Chancellor, Guru Jambheshwar University, Hisar
FOUNDER
FOUNDER
FOUNDER
FOUNDER PATRON
PATRON
PATRON
PATRON
LATE SH. RAM BHAJAN AGGARWAL
Former State Minister for Home & Tourism, Government of Haryana
Former Vice-President, Dadri Education Society, Charkhi Dadri
Former President, Chinar Syntex Ltd. (Textile Mills), Bhiwani
CO
CO
CO
CO----ORDINATOR
ORDINATOR
ORDINATOR
ORDINATOR
AMITA
Faculty, Government M. S., Mohali
ADVISORS
ADVISORS
ADVISORS
ADVISORS
DR. PRIYA RANJAN TRIVEDI
Chancellor, The Global Open University, Nagaland
PROF. M. S. SENAM RAJU
Director A. C. D., School of Management Studies, I.G.N.O.U., New Delhi
PROF. M. N. SHARMA
Chairman, M.B.A., Haryana College of Technology & Management, Kaithal
PROF. S. L. MAHANDRU
Principal (Retd.), Maharaja Agrasen College, Jagadhri
EDITOR
EDITOR
EDITOR
EDITOR
PROF. R. K. SHARMA
Professor, Bharti Vidyapeeth University Institute of Management & Research, New Delhi
CO
CO
CO
CO----EDITOR
EDITOR
EDITOR
EDITOR
DR. BHAVET
Faculty, Shree Ram Institute of Business & Management, Urjani
EDITORIAL ADVISORY BOARD
EDITORIAL ADVISORY BOARD
EDITORIAL ADVISORY BOARD
EDITORIAL ADVISORY BOARD
DR. RAJESH MODI
Faculty, Yanbu Industrial College, Kingdom of Saudi Arabia
PROF. SANJIV MITTAL
University School of Management Studies, Guru Gobind Singh I. P. University, Delhi
PROF. ANIL K. SAINI
VOLUME NO.3(2013),ISSUE NO.10(OCTOBER) ISSN 2231-5756
INTERNATIONAL JOURNAL OF RESEARCH IN COMMERCE, IT & MANAGEMENT
DR. SAMBHAVNA
Faculty, I.I.T.M., Delhi
DR. MOHENDER KUMAR GUPTA
Associate Professor, P. J. L. N. Government College, Faridabad
DR. SHIVAKUMAR DEENE
Asst. Professor, Dept. of Commerce, School of Business Studies, Central University of Karnataka, Gulbarga
ASSOCIATE EDITORS
ASSOCIATE EDITORS
ASSOCIATE EDITORS
ASSOCIATE EDITORS
PROF. NAWAB ALI KHAN
Department of Commerce, Aligarh Muslim University, Aligarh, U.P.
PROF. ABHAY BANSAL
Head, Department of Information Technology, Amity School of Engineering & Technology, Amity
University, Noida
PROF. A. SURYANARAYANA
Department of Business Management, Osmania University, Hyderabad
DR. SAMBHAV GARG
Faculty, Shree Ram Institute of Business & Management, Urjani
PROF. V. SELVAM
SSL, VIT University, Vellore
DR. PARDEEP AHLAWAT
Associate Professor, Institute of Management Studies & Research, Maharshi Dayanand University, Rohtak
DR. S. TABASSUM SULTANA
Associate Professor, Department of Business Management, Matrusri Institute of P.G. Studies, Hyderabad
SURJEET SINGH
Asst. Professor, Department of Computer Science, G. M. N. (P.G.) College, Ambala Cantt.
TECHNICAL ADVISOR
TECHNICAL ADVISOR
TECHNICAL ADVISOR
TECHNICAL ADVISOR
AMITA
Faculty, Government M. S., Mohali
FINANCIAL ADVISORS
FINANCIAL ADVISORS
FINANCIAL ADVISORS
FINANCIAL ADVISORS
DICKIN GOYAL
Advocate & Tax Adviser, Panchkula
NEENA
Investment Consultant, Chambaghat, Solan, Himachal Pradesh
LEGAL ADVISORS
LEGAL ADVISORS
LEGAL ADVISORS
LEGAL ADVISORS
JITENDER S. CHAHAL
Advocate, Punjab & Haryana High Court, Chandigarh U.T.
CHANDER BHUSHAN SHARMA
Advocate & Consultant, District Courts, Yamunanagar at Jagadhri
SUPERINTENDENT
SUPERINTENDENT
SUPERINTENDENT
SUPERINTENDENT
INTERNATIONAL JOURNAL OF RESEARCH IN COMMERCE, IT & MANAGEMENT
CALL FOR MANUSCRIPTS
CALL FOR MANUSCRIPTS
CALL FOR MANUSCRIPTS
CALL FOR MANUSCRIPTS
We invite unpublished novel, original, empirical and high quality research work pertaining to recent developments & practices in the areas of Computer Science & Applications; Commerce; Business; Finance; Marketing; Human Resource Management; General Management; Banking; Economics; Tourism Administration & Management; Education; Law; Library & Information Science; Defence & Strategic Studies; Electronic Science; Corporate Governance; Industrial Relations; and emerging paradigms in allied subjects like Accounting; Accounting Information Systems; Accounting Theory & Practice; Auditing; Behavioral Accounting; Behavioral Economics; Corporate Finance; Cost Accounting; Econometrics; Economic Development; Economic History; Financial Institutions & Markets; Financial Services; Fiscal Policy; Government & Non Profit Accounting; Industrial Organization; International Economics & Trade; International Finance; Macro Economics; Micro Economics; Rural Economics; Co-operation; Demography: Development Planning; Development Studies; Applied Economics; Development Economics; Business Economics; Monetary Policy; Public Policy Economics; Real Estate; Regional Economics; Political Science; Continuing Education; Labour Welfare; Philosophy; Psychology; Sociology; Tax Accounting; Advertising & Promotion Management; Management Information Systems (MIS); Business Law; Public Responsibility & Ethics; Communication; Direct Marketing; E-Commerce; Global Business; Health Care Administration; Labour Relations & Human Resource Management; Marketing Research; Marketing Theory & Applications; Non-Profit Organizations; Office Administration/Management; Operations Research/Statistics; Organizational Behavior & Theory; Organizational Development; Production/Operations; International Relations; Human Rights & Duties; Public Administration; Population Studies; Purchasing/Materials Management; Retailing; Sales/Selling; Services; Small Business Entrepreneurship; Strategic Management Policy; Technology/Innovation; Tourism & Hospitality; Transportation Distribution; Algorithms; Artificial Intelligence; Compilers & Translation; Computer Aided Design (CAD); Computer Aided Manufacturing; Computer Graphics; Computer Organization & Architecture; Database Structures & Systems; Discrete Structures; Internet; Management Information Systems; Modeling & Simulation; Neural Systems/Neural Networks; Numerical Analysis/Scientific Computing; Object Oriented Programming; Operating Systems; Programming Languages; Robotics; Symbolic & Formal Logic; Web Design and emerging paradigms in allied subjects.
Anybody can submit the soft copy of unpublished novel; original; empirical and high quality research work/manuscriptanytime in M.S. Word format after preparing the same as per our GUIDELINES FOR SUBMISSION; at our email address i.e. [email protected] or online by clicking the link online submission as given on our website (FOR ONLINE SUBMISSION, CLICK HERE).
GUIDELINES FOR SUBMISSION OF MANUSCRIPT
GUIDELINES FOR SUBMISSION OF MANUSCRIPT
GUIDELINES FOR SUBMISSION OF MANUSCRIPT
GUIDELINES FOR SUBMISSION OF MANUSCRIPT
1. COVERING LETTER FOR SUBMISSION:
DATED: _____________
THE EDITOR
IJRCM
Subject: SUBMISSION OF MANUSCRIPT IN THE AREA OF.
(e.g. Finance/Marketing/HRM/General Management/Economics/Psychology/Law/Computer/IT/Engineering/Mathematics/other, please specify)
DEAR SIR/MADAM
Please find my submission of manuscript entitled ‘___________________________________________’ for possible publication in your journals.
I hereby affirm that the contents of this manuscript are original. Furthermore, it has neither been published elsewhere in any language fully or partly, nor is it under review for publication elsewhere.
I affirm that all the author (s) have seen and agreed to the submitted version of the manuscript and their inclusion of name (s) as co-author (s).
Also, if my/our manuscript is accepted, I/We agree to comply with the formalities as given on the website of the journal & you are free to publish our contribution in any of your journals.
NAME OF CORRESPONDING AUTHOR: Designation:
Affiliation with full address, contact numbers & Pin Code: Residential address with Pin Code:
Mobile Number (s): Landline Number (s): E-mail Address: Alternate E-mail Address:
NOTES:
a) The whole manuscript is required to be in ONE MS WORD FILE only (pdf. version is liable to be rejected without any consideration), which will start from
the covering letter, inside the manuscript.
b) The sender is required to mentionthe following in the SUBJECT COLUMN of the mail:
New Manuscript for Review in the area of (Finance/Marketing/HRM/General Management/Economics/Psychology/Law/Computer/IT/ Engineering/Mathematics/other, please specify)
c) There is no need to give any text in the body of mail, except the cases where the author wishes to give any specific message w.r.t. to the manuscript. d) The total size of the file containing the manuscript is required to be below 500 KB.
e) Abstract alone will not be considered for review, and the author is required to submit the complete manuscript in the first instance.
f) The journal gives acknowledgement w.r.t. the receipt of every email and in case of non-receipt of acknowledgment from the journal, w.r.t. the submission
of manuscript, within two days of submission, the corresponding author is required to demand for the same by sending separate mail to the journal.
2. MANUSCRIPT TITLE: The title of the paper should be in a 12 point Calibri Font. It should be bold typed, centered and fully capitalised.
3. AUTHOR NAME (S) & AFFILIATIONS: The author (s) full name, designation, affiliation (s), address, mobile/landline numbers, and email/alternate email address should be in italic & 11-point Calibri Font. It must be centered underneath the title.
VOLUME NO.3(2013),ISSUE NO.10(OCTOBER) ISSN 2231-5756
INTERNATIONAL JOURNAL OF RESEARCH IN COMMERCE, IT & MANAGEMENT
5. KEYWORDS: Abstract must be followed by a list of keywords, subject to the maximum of five. These should be arranged in alphabetic order separated bycommas and full stops at the end.
6. MANUSCRIPT: Manuscript must be in BRITISH ENGLISH prepared on a standard A4 size PORTRAIT SETTING PAPER. It must be prepared on a single space and single column with 1” margin set for top, bottom, left and right. It should be typed in 8 point Calibri Font with page numbers at the bottom and centre of every page. It should be free from grammatical, spelling and punctuation errors and must be thoroughly edited.
7. HEADINGS: All the headings should be in a 10 point Calibri Font. These must be bold-faced, aligned left and fully capitalised. Leave a blank line before each heading.
8. SUB-HEADINGS: All the sub-headings should be in a 8 point Calibri Font. These must be bold-faced, aligned left and fully capitalised.
9. MAIN TEXT: The main text should follow the following sequence:
INTRODUCTION
REVIEW OF LITERATURE
NEED/IMPORTANCE OF THE STUDY
STATEMENT OF THE PROBLEM
OBJECTIVES
HYPOTHESES
RESEARCH METHODOLOGY
RESULTS & DISCUSSION
FINDINGS
RECOMMENDATIONS/SUGGESTIONS
CONCLUSIONS
SCOPE FOR FURTHER RESEARCH
ACKNOWLEDGMENTS
REFERENCES
APPENDIX/ANNEXURE
It should be in a 8 point Calibri Font, single spaced and justified. The manuscript should preferably not exceed 5000 WORDS.
10. FIGURES &TABLES: These should be simple, crystal clear, centered, separately numbered & self explained, and titles must be above the table/figure. Sources of data should be mentioned below the table/figure. It should be ensured that the tables/figures are referred to from the main text.
11. EQUATIONS:These should be consecutively numbered in parentheses, horizontally centered with equation number placed at the right.
12. REFERENCES: The list of all references should be alphabetically arranged. The author (s) should mention only the actually utilised references in the preparation of manuscript and they are supposed to follow Harvard Style of Referencing. The author (s) are supposed to follow the references as per the following:
•
All works cited in the text (including sources for tables and figures) should be listed alphabetically.•
Use (ed.) for one editor, and (ed.s) for multiple editors.•
When listing two or more works by one author, use --- (20xx), such as after Kohl (1997), use --- (2001), etc, in chronologically ascending order.•
Indicate (opening and closing) page numbers for articles in journals and for chapters in books.•
The title of books and journals should be in italics. Double quotation marks are used for titles of journal articles, book chapters, dissertations, reports, workingpapers, unpublished material, etc.
•
For titles in a language other than English, provide an English translation in parentheses.•
The location of endnotes within the text should be indicated by superscript numbers.PLEASE USE THE FOLLOWING FOR STYLE AND PUNCTUATION IN REFERENCES: BOOKS
•
Bowersox, Donald J., Closs, David J., (1996), "Logistical Management." Tata McGraw, Hill, New Delhi.•
Hunker, H.L. and A.J. Wright (1963), "Factors of Industrial Location in Ohio" Ohio State University, Nigeria. CONTRIBUTIONS TO BOOKS•
Sharma T., Kwatra, G. (2008) Effectiveness of Social Advertising: A Study of Selected Campaigns, Corporate Social Responsibility, Edited by David Crowther &Nicholas Capaldi, Ashgate Research Companion to Corporate Social Responsibility, Chapter 15, pp 287-303. JOURNAL AND OTHER ARTICLES
•
Schemenner, R.W., Huber, J.C. and Cook, R.L. (1987), "Geographic Differences and the Location of New Manufacturing Facilities," Journal of Urban Economics,Vol. 21, No. 1, pp. 83-104. CONFERENCE PAPERS
•
Garg, Sambhav (2011): "Business Ethics" Paper presented at the Annual International Conference for the All India Management Association, New Delhi, India,19–22 June.
UNPUBLISHED DISSERTATIONS AND THESES
•
Kumar S. (2011): "Customer Value: A Comparative Study of Rural and Urban Customers," Thesis, Kurukshetra University, Kurukshetra.ONLINE RESOURCES
•
Always indicate the date that the source was accessed, as online resources are frequently updated or removed.WEBSITES
INTERNATIONAL JOURNAL OF RESEARCH IN COMMERCE, IT & MANAGEMENT
AN EVALUATION OF NEW ZEALAND’S EXPORT COMPETITIVENESS USING SHIFT-SHARE ANALYSIS
DR. SATYA GONUGUNTLA
PRINCIPAL LECTURER
FACULTY OF BUSINESS & INFORMATION TECHNOLOGY
MANUKAU INSTITUTE OF TECHNOLOGY
NEW ZEALAND
ABSTRACT
Being a small country, New Zealand’s economic performance depends largely on external trade. Accordingly, New Zealand negotiated free trade agreements with several countries the most notable being the Closer Economic Relations agreement with its closest neighbour, Australia. As a result, there has been a significant increase in the merchandise exports coupled with a change both in the export market structure and the commodity composition during the study period i.e. 2005-2011. The aim of the study is to analyse the influence some key variables such as growth in world exports, commodity composition, trading partner distribution and competitiveness on the export growth. Shift-share analysis has been applied to decompose the impact of these factors on exports. Top 10 commodities to top 6 destinations have been included in the study. Data has been sourced from UNCOMTRADE database and Statistics New Zealand. The results show that overall growth in world exports, Globo, has been the major contributing factor followed by a positive effect of New Zealand’s own export competitiveness, Perfo. Both commodity composition, Compo, and trading partner distribution, Geo, had a negative impact on New Zealand’s exports. In order for the Geo component to become positive New Zealand needs to increase its exports to countries that do not export primary products such as dairy and meat on a large scale.
JEL CLASSIFICATION
F1 Trade
KEYWORDS
Composition (Compo), Geographical (Geo), Global (Globo), Performance (Perfo), Shift-share Analysis.
INTRODUCTION
ew Zealand (NZ) is a trade dependent nation and being a small country its economic prosperity depends on its export performance. Historically, New Zealand had a narrow export base both in terms of markets and commodity composition. In 1970, the major export markets were the UK and the USA accounting for 55% of NZ’s exports. The commodity composition concentrated on primary products such as Dairy, Meat and Wool which together accounted for 95% of the merchandise exports. NZ was accorded a special status with UK as a result of a trade agreement in 1932, accordingly the latter remained NZ’s major export destination. When the UK joined the EEC in 1973 the special status extended to NZ ended (Abbott 2007). This development has compelled NZ to find new markets for its exports. A major development in this direction was the signing of Closer Economic Relations Trade Agreement (CER) with Australia in 1983. Consequently, there has been a significant growth in NZ’s merchandise exports to Australia. Encouraged by this, subsequently NZ has negotiated free trade agreements (FTAs) with several other countries to diversify the export markets. These agreements include a Closer Economic Partnership Agreement with Singapore in 2001, Trans-Pacific Strategic Economic Partnership agreement with Singapore, Chile and Brunei (2005), a CEP with Thailand (2005) NZ-China FTA (2008), and ASEAN-AUSTRALIA-NZ FTA in 2010 to strengthen the external sector and enhance the gains of free trade.
FTAs tend to have a positive impact on export growth and market diversification. NZ’s merchandise exports recorded a significant growth in the recent years from 17% of GDP in 2003 to 24% in 2011. During the years 2005-2010 the world merchandise exports increased by an average of 8% per annum. As against this, New Zealand’s merchandise exports increased by an average of 8.25% per annum during the above period. An important feature of NZ’s merchandise exports is that between the years 2000 and 2004 the growth was practically stagnant with a 5% growth in 2004 over 2000. From the year 2005 onwards there has been a considerable growth in merchandise exports registering a 55% growth of in 2011 over 2005. Also, there has been a change in the export market structure, in terms of ranking, during this period. Canada, Germany have lost their place in the top 10 export destinations. Whereas, the position of PRC has increased to 2nd from 4th place. Another key development in the recent past is the growing competition in some of the major export markets for some of the commodities in
which NZ has a comparative advantage. For example, Russia and Korea have become strong competitors for timber in China and Japan. Similarly, NZ wine industry faces tough competition from Australia in the UK and USA markets.
This paper investigates the influence of some key export markets as well as changes in competitiveness on the overall growth in merchandise exports during the years 2005 to 2011using shift share analysis. The background and objective of the study is presented in section II. Literature review is presented in section III and section IV explains the methodology. The results of the analysis are presented in section V and section VI concludes.
THE BACKGROUND
A key aspect of the New Zealand’s merchandise exports is the changing market structure in the recent years i.e. changing importance of export markets (Table-1). In the year 2005 five of the top 10 destinations were Asian countries accounting for 23% of the merchandise exports. By the year 2011 seven out of the top 10 destinations were from Asia and accounted for 31% of the merchandise exports. This change in the export market structure is a clear indication of the growing importance of Asian markets to the New Zealand economy and the declining share of the European markets. Some highlights of the changes in NZ’s export markets are presented below.
Australia has emerged as New Zealand’s most important trading partner in the post CER period indicating a significant growth in bilateral trade flows between the two countries. Currently, Australia accounts for 23% NZ’s merchandise exports and about same percent of imports, a considerable growth from the 13% recorded in 1983. During the study period Australia retained its position as New Zealand’s top export destination. USA, which was in the second position was replaced by China in 2010. Japan has been relegated to 4th place from 3rd which was taken over by USA. Germany which was in the 7th position in 2005, lost its
place from the top 10 markets by 2010. Whereas Indonesia and India which were not in the top 10 list in 2005 have found place in the top 10 export destinations by 2011. Indonesia became the 7th largest export destination in 2007 and remained in the top 10 list by 2011. India’s position has been moving up from 13th in
2009 to 7th in the year 2011. The changing structure of the New Zealand’s top 10 export markets is presented in Table-1.
A second aspect of NZ’s merchandise exports is the changes in commodity composition. The composition of top 10 commodities has also changed in 2011 compared to 2005. Some significant changes are, Mechanical machinery equipment which was in 4th place in 2005, has been relegated to 7th place by 2011.
Aluminium and Aluminium articles from 7th to 8th, Electrical machinery and equipment from 8th to 10th place. Whereas milk powder, butter, and cheese, meat
and edible offal, logs, wood and wood articles retained their respective positions of 1,2, and 3 of the top 10 commodities which were in the top 10 category in 2005. A key development during this period is that by 2011 crude oil occupied 4th place and wine 9th place. Both these commodities were not in the top 10 list in
2005. Two of the top 10 commodities in 2005 viz, wool, paper & paperboard lost their place in the list. Crude oil and wine have joined the list in 2011 (Table-1). In 2011, 7 out of 10 top commodities were land based as against 6 out of 10 in 2005 highlighting the dominance of primary products in NZ’s merchandise exports.
VOLUME NO.3(2013),ISSUE NO.10(OCTOBER) ISSN 2231-5756
INTERNATIONAL JOURNAL OF RESEARCH IN COMMERCE, IT & MANAGEMENT
TABLE-1: TOP 10 EXPORT DESTINATIONS & TOP 10 COMMODITIES-RANKINGSYear 2005 2011 Year 2005 2011
Country Commodity
Australia (1) (1) Milk powder,
Butter and Cheese HS Code 0401-0406
(1) (1)
USA (2) (3) Meat and Edible Offal
HS Code 02
(2) (2)
Japan (3) (4) Logs, Wood and Wood articles
HS Code 44
(3) (3)
U K (5) (6) Crude oil
HS Code 2709
(4)
Korea (6) (5) Mechanical Machinery and Equipment
HS Code 84
(4) (7)
PRC (4) (2) Fruit &Nuts
HS Code 0803-0814
(5) (5)
Germany (7) (13) Fish
HS Code 03
(6) (6)
Hong Kong (SAR) (10) (12) Aluminium and Aluminium articles HS Code 76
(7) (8)
Taiwan (8) (8) Wine
HS Code 22
(9)
Malaysia 468
(11) 875 (9)
Electrical Machinery and Equipment HS Code85
(8) (10)
Canada (9) (18) Wool
HS Code 51
(9)
Indonesia (10) Paper and Paperboard
HS Code 48
(10)
India 938
(7) I
Source: Statistics New Zealand.
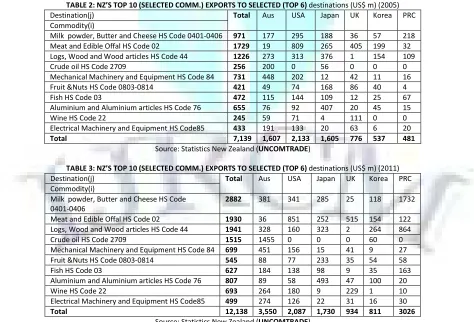
For the purpose of this study only the top six destinations consisting of Australia, PRC, Japan, Korea, USA, and UK have been considered.
(Table-2) as they account for about 90% of NZ’s merchandise exports. Accordingly, the top 10 commodities exported to these selected destinations have been included (Table-3). These countries also appear in the list of top 10 destinations in 2005 as well as in 2011 but their rankings have changed.
TABLE 2: NZ’S TOP 10 (SELECTED COMM.) EXPORTS TO SELECTED (TOP 6) destinations (US$ m) (2005)
Destination(j) Total Aus USA Japan UK Korea PRC
Commodity(i)
Milk powder, Butter and Cheese HS Code 0401-0406 971 177 295 188 36 57 218
Meat and Edible Offal HS Code 02 1729 19 809 265 405 199 32
Logs, Wood and Wood articles HS Code 44 1226 273 313 376 1 154 109
Crude oil HS Code 2709 256 200 0 56 0 0 0
Mechanical Machinery and Equipment HS Code 84 731 448 202 12 42 11 16
Fruit &Nuts HS Code 0803-0814 421 49 74 168 86 40 4
Fish HS Code 03 472 115 144 109 12 25 67
Aluminium and Aluminium articles HS Code 76 655 76 92 407 20 45 15
Wine HS Code 22 245 59 71 4 111 0 0
Electrical Machinery and Equipment HS Code85 433 191 133 20 63 6 20
Total 7,139 1,607 2,133 1,605 776 537 481
Source: Statistics New Zealand (UNCOMTRADE)
TABLE 3: NZ’S TOP 10 (SELECTED COMM.) EXPORTS TO SELECTED (TOP 6) destinations (US$ m) (2011)
Destination(j) Total Aus USA Japan UK Korea PRC
Commodity(i)
Milk powder, Butter and Cheese HS Code 0401-0406
2882 381 341 285 25 118 1732
Meat and Edible Offal HS Code 02 1930 36 851 252 515 154 122
Logs, Wood and Wood articles HS Code 44 1941 328 160 323 2 264 864
Crude oil HS Code 2709 1515 1455 0 0 0 60 0
Mechanical Machinery and Equipment HS Code 84 699 451 156 15 41 9 27
Fruit &Nuts HS Code 0803-0814 545 88 77 233 35 54 58
Fish HS Code 03 627 184 138 98 9 35 163
Aluminium and Aluminium articles HS Code 76 807 89 58 493 47 100 20
Wine HS Code 22 693 264 180 9 229 1 10
Electrical Machinery and Equipment HS Code85 499 274 126 22 31 16 30
Total 12,138 3,550 2,087 1,730 934 811 3026
Source: Statistics New Zealand (UNCOMTRADE)
INTERNATIONAL JOURNAL OF RESEARCH IN COMMERCE, IT & MANAGEMENT
product composition component (COMPO) indicating growth due to the mix of products exported, and a residual term indicating changes in competitiveness, or performance (PERFO). The first 3 components, GLOBO, COMPO and GEO all relate to what the change in trade would be if trade changes proportionally. The fourth and residual component, PERFO, refers to the trade that "shifts away" from expected proportional changes, hence the term shift-share analysis ( Piezas-Jerbi and Nee 2009).
LITERATURE REVIEW
Shift share analysis is a popular method used in economic studies to identify the sources of differences in regional and national economic, employment and export growth rates. Berzeg (1978) in his study on the empirical content of shift share technique concluded that the technique has been one of the main tools to analyse not only growth rates by region and industry but also to study other economic problems. Relative simplicity and reasonable accuracy are the two main reasons for the popularity of this technique. Nazara and Hewings (2004) attributed the technique’s wide usability to its ability to capture the underlining changes in the variables under consideration. Shi and Yang (2008) observed that although the shift share technique is relatively simple requiring modest amounts of data the analysis is reasonably accurate. That the technique is versatile, in that it can be used to study a variety of economic issues is well established in economic literature.
Tu and Sui (2011) applied shift share analysis to investigate the regional patterns of structural transitions and contributing factors behind the changes in the state of Texas. They found that the emergence of an information economy may precipitate further spatially differentiated growth in different regions of the state. Robson (2008) applied the shift share analysis to decompose the employment growth in South East Queensland during the decade 1991-2001. He found that most of the growth in employment came from national growth while changes in regional industry mix contributed the smallest portion of the employment growth.
Shift-share analysis is also extensively used to analyse various aspects of a country’s export performance. The method can be used to measure the changes in the export competitiveness, the relative gains or losses of export markets and the changes in export performance due to the country's distribution of trading partners. Shift-share analysis can also be applied to identify market potential and growth in a region and to identify the best market for a specific product. The technique is appropriate for the initial screening phase of the export opportunity identification process. The analysis provides a representation of changes in import growth or decline, and it is useful for targeting countries that might offer significant future opportunities (Rubin 2005).
Srivatsava (2010) applied shift share analysis to assess the impact of the phase-out of the Multi-Fibre Agreement on the exports of textile products by India during the years 1996-2006. He noted that when applied to the study of export growth, shift –share analysis measures the relative gain or loss of export markets to overall export growth. The net shift in export is a better measure of export market performance compared to absolute and relative changes in export growth. Shift share analysis also takes into account both size and growth of a particular market when assessing its export performance with another market.
Peh and Wong (1999) applied shift share analysis to study Singapore’s export market growth during 1991-96. They computed the net shifts in export markets by analysing the industry mix, regional, and interaction effects. They concluded that the regional economies played a significant role in expanding Singapore’s exports during the study period.
The technique can also be used to compare the export performance of a country in relation to a particular industry vis a vis its rivals in a major export market. Wu and Kumarapathy (1998) used shift share analysis to analyse Singapore’s competitiveness in electronic exports to the United States. They found that although there was an improvement in Singapore’s overall competitiveness, it lagged behind its regional rivals i.e. Malaysia, China and the Philippines.
Ballingall and Briggs (2001) compared Australia’s and New Zealand’s export performance during three time periods 1970-85; 1985-1993, and 1993-99. The three variables considered include the growth in world trade, commodity composition, and competitiveness. It was found that Australia’s competitiveness increased since 1985 whereas New Zealand’s competitiveness decreased during the same period. In this study a new component viz., GEO is added to evaluate the effects on NZ’s total merchandise exports that can be attributed to the distribution of trading partners in addition to the above three components.
METHODOLOGY
This study applies the methodology used by PIEZAS-JERBI and NEE (2009).
In their study of Market Shares In The Post-Uruguay Round Era an extended shift share analysis was used to decompose the growth in exports to four components viz., a global component (GLOBO) indicating changes due to overall growth in world trade, a geographical component (GEO) indicating changes due to the country's distribution of trading partners, a product composition component (COMPO) indicating growth due to the mix of products exported, and a residual term indicating changes in competitiveness, or performance (PERFO). The advantage of this method is that it is possible to clearly identify the trading partner effect on the export performance.
V'.. – V.. = ΣiΣj rijVij + ΣiΣj (V'ij – Vij – rijVij)
= rV.. + Σi(ri – r)Vi. + ΣiΣj(rij –ri)Vij + ΣiΣj(V'ij – vij – rijVij)
(1) (2) (3) (4) (Piezas-Jerbi and Nee 2009)
Where:
Vi. = the value of country A's exports of product i in period 1, V'i. = the value of country A's exports of product i in period 2, V.j = the value of country A's exports to country j in period 1, V'.j = the value of country A's exports to country j in period 2,
Vij = the value of country A's exports of product i to country j in period 1, V'ij = the value of country A's exports of product i to country j in period 2, r = percentage change in world exports between periods 1 and 2,
ri = percentage change in world exports of product i between periods 1 and 2, rij = percentage change in world exports of product i to country j between periods 1 and 2.
RESULTS AND DISCUSSION
NZ’s total exports of top 10 commodities increased by US$ 4,999m i.e. a 70% increase in 2011 over 2005. The final result of the shift-share analysis which is used to disaggregate the total increase in exports are presented below ( refer to appendix-1 for detailed calculations).
4,999 = 5712 - 266 - 1462 + 1015 100% = (114)% - (5%) - (29%) + (20%)
(Globo) (Compo) (Geo) (Perfo)
The Globo component indicates that NZ’s exports would have been114% of the total increase had the actual growth rate was equivalent to world growth rate. The results indicate that the growth in NZ’s exports was largely due to growth in world exports implying a substantial rise in the global demand for these commodities overall during the study period.
VOLUME NO.3(2013),ISSUE NO.10(OCTOBER) ISSN 2231-5756
INTERNATIONAL JOURNAL OF RESEARCH IN COMMERCE, IT & MANAGEMENT
The third term Geo i.e., the distribution of trading partnersalso had a negative influence on NZ’s exports. The decomposition of the total increase in exports shows that 29% share of the exports was lost due to the behaviour of the six individual trading partners.
Finally, the residual term Perfo had a 20% positive influence on the total exports implying that NZ’s exports increased by 20% due to competitiveness.
CONCLUSIONS
Firstly, there was an overall increase in the exports of selected commodities by the selected countries albeit of varying degrees during the period of the study (Table-4). There has been a 70% increase (the second highest) in NZ’s exports of the selected commodities to the selected destinations (Table 2 & Table 3) as against 80% increase in world exports of the selected commodities during the study period. PRC achieved the highest growth rate of 109% (Table-4). Seconldy, with regard to individual commodities NZ recorded the highest export growth rate of 492% as against world’s 53% for crude oil followed by milk powder, butter and cheese. Other commodities that exceeded the world growth rate are wine with a growth rate of 183% as against world’s growth rate of 25%, dairy products achieved 197% increase and timber also exceeded the world growth rate. All these commodities are primary or land based products i.e. NZ’s export growth of land based products is comparable to world’s growth rate. A point to be noted in this regard is the fact that world’s largest growth rate of 120% relates to Electrical Machinery and Equipment for which NZ recorded a 15% growth rate which is far less than the world growth rate. This is an indication that NZ lacks competitiveness in technology based exports. This is also evident from the fact that composition of commodities had a negative effect indicating that the world growth rate for these commodities was less than the overall world growth in exports. Thirdly, the distribution of trading partners had a negative impact as the growth rate of exports of selected commodities to these destinations was less than the overall world export growth rate of these commodities. Some of these countries which are in NZ’s top 6 export destinations such as the US are also major exporters of similar commodities e.g. dairy, meat, timber and aluminium articles (Table-5). Given this the Geo component can be expected to be negative unless there is a change in NZ’s export market structure. Finally, although the term Perfo had a positive influence, Perfo is an indicator of competitiveness in a broad sense. This is because the term merely indicates a country’s potential to increase its exports beyond what can be attributed to Globo, Compo, and Geo effects (Piezas-Jerbi and Nee, 2009). To conclude, the decomposition of the Globo, Compo, Geo, and Perfo indicate that NZ was competitive enough to be able to increase its exports in line with world exports. Further research needs to be done on the impact of macroeconomic policies e.g. foreign trade policies to isolate their influence on the Perfo term.
TABLE-4: WORLD* GROWTH RATE IN TOP 10 COMMODITIES 2005-2011
Year
Commodity
2005 (US$ m)
2011 (US$ m)
% Change
HS0401-0406 Milk powder, Butter and Cheese 7737 16865 118
HS02 Meat and Edible Offal 16309 29748 82
HS44 Logs, Wood and Wood articles 15546 23620 52
HS2709 Crude oil 28378 43329 53
HS0801-14 Fruit &Nuts 9139 17257 89
HS03 Fish 12976 23203 79
HS76 Aluminium and Aluminium articles 25031 46871 87
HS2204-05 Wine 3923 4918 25
HS85 Electrical Machinery and Equipment 404953 890049 120
HS84 Mechanical Machinery and Equipment 543107 864660 59
Source: UNCOMTRADE *Consists of NZ, Aus, Japan, Korea, PRC, USA and UK.
TABLE-5: TOTAL EXPORTS BY SELECTED DESTINATIONS 2005-2011
Destination (j)
Product (i)
Percentage change. % (r)
Total NZ Aus Japan Korea PRC USA UK
Total (7) 80 70 26 28 55 109 24 2
HS0401-0406 Milk powder, Butter and Cheese 118 197 26 0 0 0 394 73
HS02 Meat and Edible Offal 82 12 0.36 0 0 0 228 26
HS44 Logs, Wood and Wood articles 52 58 21 7 0 38 99 (-)32
HS2709 Crude oil 53 492 103 0 0 (-)14 0 (-)36
HS0801-14 Fruit &Nuts 89 29 39 0 0 59 56 0
HS03 Fish 79 33 (-)8 (-)5 88 78 26 251
HS76 Aluminium and Aluminium articles 87 23 24 33 21 85 141 (-)21
HS2204-05 Wine 25 183 (-)25 0 0 0 79 (-)14
HS85 Electrical Machinery and Equipment 120 15 26 9 57 110 7 (-)6
HS84 Mechanical Machinery and Equipment 59 (-)4 32 46 52 117 15 20
Source: Calculations based on UNCOMTRADE database.
APPENDIX-1
Calculation of classic shift-share, NZ total exports of top 10 commodities, 2005-2011 (US$m) Total change in NZ’s exports of top 10 commodities = V"-V = 12,138 - 7,139 = 4,999 (1) GLOBO = r*V = (80/100*971) + (80/100*1729)…… + (80/100*433) = 5,712 ( 2 ) COMPO = ∑ (ri-r)Vi = (1.18-.8)*971 + (0.82-0.8)*1729…….+(0.59-0.80)*433 = (-) 266
(3) GEO = ∑i∑j(rij-ri)Vij = (0.26-1.18)*177 + (3.94-1.18)*295 ………+ (0.20-0.59)*42 = (-)1462
INTERNATIONAL JOURNAL OF RESEARCH IN COMMERCE, IT & MANAGEMENT
(1) GLOBO = r*V = (80/100*971) + (80/100*1729) + (80/100*1226) + (80/100*256) + (80/100*731) + (80/100*421) + (80/100*472) + (80/100*655) + (80/100*245) + (80/100*433) = 5,712
( 2 ) COMPO = ∑ (ri-r)Vi = (1.18-.8)*971 + (0.82-0.8)*1729 + (0.52-0.80)*1226 + … (0.53-0.80)*256 + (0.89-0.80)*731 + (0.79-0.80)*421 + (0.87-0.80)*472 + (0.25-0.80)*655 + (1.20-0.80)*245 + (0.59-0.80)*433 = (-) 266
(3) GEO = ∑i∑j(rij-ri)Vij = (0.26-1.18)*177 + (3.94-1.18)*295 + (0.73-1.18)*36 + (0-1.18)*188+ (0-1.18)*57 +(0-1.18)*218 = 89
= (.004-.82)*19 + (2.28-0.82)*809 + (0.26-0.82)*405 +(0-.82)*265 + (0-.82)*199 + (0-0.82)*32 = 532
= (0.21-0.52)*273 + (0.07-0.52)*376 + (0.38-0.52)*109 + (0.99-.52)*313+ (0-.52)*154 = (- 203)
= (1.03-.53)*200 + (0-.53)*56 = 70
= (0.39-0.89)*49 + (0.59-0.89)*4 + (0.56-0.89)*74 +(0-.89)*168 + (0-.89)*86 +(0-.89)*40 = (-312 )
= (-.87)*115 + (-0.84)*109 + (0.88-0.79)*25 + (0.78-0.79)*67 + (0.26-0.79)*144 + (2.51-0.79)*12 = (-)246
= (0.24-0.87)*76 + (0.33-0.87)*407 + (0.21-0.87)*45 +(0.85-0.87)*15 + (1.41-0.87)*92 +(-21.87)*20 = (-685)
= (-.5)*59 + (0.79-0.25)*71 + (-0.39)*111 + (0-.25)*71 = (-52) = (0.26-1.2)*191 + (0.09-1.2)*20 + (0.57-1.2)*6 + (1.10-1.20)*20 + (0.07-1.20)*133 + (-1.26)*63 = (-437)
= (.32-.59)*448 + (.46-.59)*12 + (.52-.59)*11 + (1.17-0.59)*16 + (0.15-0.59)*202 + (0.20-0.59)*42 = (-219)
= (-)1462 (4) PERFO = ∑i∑j(V'ij-Vij-rijVij)
Aus = (381-177) - (0.26*177) + (36-19) - (0.004*19) + (328-273) - (0.21*273) + (1455-200) - (1.03*200) + (451-448) - (0.32*448) + (88-49) - (0.39*49) + (184-115) - (-.08*115) + (89-76) - (0.24*76) + (264-59) –
(-.25*59) + (274-191) -(0.26*191) = 1427
USA = (341-295) - (3.94*295) + (851-809) - (2.28*809) + (160-313) - (0.99*313) + (156-202) - (0.15*202) + (77-74) - (0.56*74) + (138-144) - (.26*144) + (58-92) - (1.41*92) + (180-71) - (0.79*71) + (126-133) - (0.07*133) = (-3353)
Japan = (323-376) - (0.07*376) + (15-12) - (0.46*12) + (98-109) - (-.05*109) + (493-407) - (0.33*407) + (22-20)-(0.09*20) = (-135) (285-188) + (-13) + (233-168) (5) = 19
UK = (25-36) - (0.73*36) + (515-405) - (0.26*405) + (41-42) - (0.20*42) + (9-12) - (2.51*12) + (47-20) - (-.21*20) + (229-111) - (-.14*111) + (31-63) + (-.06*63) = 14 Korea = (35-25) - (0.88*25) + (100-45) - (0.21*45) + (16-6) - (0.57*6) (118-57) + (154-199) + (264-154) + (60) + (14) = 241
PRC = (1732-218) + (122-32) + (864-109) - (0.38*109) + (27-16) - (1.17*16) + (58-4) - (0.59*4) + (163-67) - (.78*67) + (20-15) - (0.85*15) + (10) + (30-20) - (1.10*20) = 2667
=1015 PS: Values have been adjusted to the nearest million.
REFERENCES
1. Abbott, M. (2007), “New Zealand and the Global Economy.”Dunmore Publishing, Wellington.
2. Ballingall, J & Briggs, P. (2001), “A Comparison of Australia’s and New Zealand’s export performance using shift share analysis,” Working paper, New Zealand Institute of Economic Research.
3. Berzeg, K. (1978), “The Empirical Content of Shift Share Analysis,” Journal of Regional Science, Vol. 18, No. 3.
4. Nazara,S. and Hewings,G. J.D. (2004), “Spatial Structure and Taxonomy of Decomposition in Shift-Share Analysis,” Growth and Change, Vol. 35 No. 4 (Fall 2004), pp. 476-490.
5. Ninez P. N. and NEE, C. (2009), “Market Shares In The Post-Uruguay Round Era: A Closer Look Using Shift-Share Analysis,” WTO Staff Working Paper ERSD-2009-14.
6. Peh, Kian-Heng. and Wong, Fot-Chyi.(1999), ”Growth In Singapore’s Export Markets, 1991-96: A Shift Share Analysis,” Asian Economic Journal, Vol 13, No.3. pp.321-344.
7. Regional Economy in the 1990s,” Regional Studies, Vol. 45.4, pp. 525–543.
8. Robson, A. (2008), “Endogenous Employment Growth and Decline in South East QUEENSLAND,” Australasian Journal of Regional Studies, Vol. 14, No. 1, 2008.
9. Rubin, R.S. (2005), “Identifying Small Business Exporting Opportunities Using a Shift-Share Analysis: An Assessment and Application,” Journal of Global Marketing, Vol. 19(1) 2005. doi:10.1300/J042v19n01_06
10. Shi, Chun-Yun. and Yang Yang. ( 2008), “A Review of Shift-Share Analysis and its Application,” Tourism International Journal of Management Perspectives, ISSN: 1307-1629, 2008, 1(1), pp.21-30.
11. Srivastava, D. K. (2010), “ Impact of MFA Phase-Out on Indian Textiles and Clothing Exports: A Shift Share Analysis Approach,” South Asian Journal of Management. Jan-Mar2010, Vol. 17 Issue 1, p94-98. 5p.
12. Wei, Tu. and Sui, Daniel Z.(2011), “ A State Transformed by Information: Texas
13. Wu, F. and Kumarapathy, S. (1998), “Are Singapore’s Electronics Exports Losing Competitiveness to Regional Rivals?,” The Asia Pacific Journal of Economics & Business, Vol.2, No.2. pp97-109.
WEBSITES
14. http://comtrade.un.org/db/default.aspx
15.
http://web.ebscohost.com.ezproxy.manukau.ac.nz/ehost/resultsadvanced?sid=303277c8-97e5-4cc7-8432-b7a7377d04cc%40sessionmgr13&vid=7&hid=8&bquery=TI+(Impact+%22of%22+MFA)&bdata=JmRiPWJ0aCZsb2dpbi5hc3AmdHlwZT0xJnNpdGU9ZWhvc3Q tbGl2ZQ%3d%3d
VOLUME NO.3(2013),ISSUE NO.10(OCTOBER) ISSN 2231-5756
INTERNATIONAL JOURNAL OF RESEARCH IN COMMERCE, IT & MANAGEMENT
REQUEST FOR FEEDBACK
Dear Readers
At the very outset, International Journal of Research in Commerce, IT and Management (IJRCM)
acknowledges & appreciates your efforts in showing interest in our present issue under your kind perusal.
I would like to request you to supply your critical comments and suggestions about the material published
in this issue as well as on the journal as a whole, on our E-mail i.e.
for further
improvements in the interest of research.
If you have any queries please feel free to contact us on our E-mail
.
I am sure that your feedback and deliberations would make future issues better – a result of our joint
effort.
Looking forward an appropriate consideration.
With sincere regards
Thanking you profoundly
Academically yours
Sd/-